
In many manufacturing plants, shop floor teams spend a surprising amount of time looking for parts, tools, and materials. Technicians pulling components from a tool crib, operators searching for replacement parts on a crowded shelf, and warehouse staff hunting for raw materials on disorganized racks – all these scenarios add unplanned search time to each workday. The result is wasted labor, stalled production, and frustrated employees. But it doesn’t have to be this way. By creating a visual inventory map – essentially a digital floor plan of the factory with live inventory data – teams can pinpoint parts instantly.
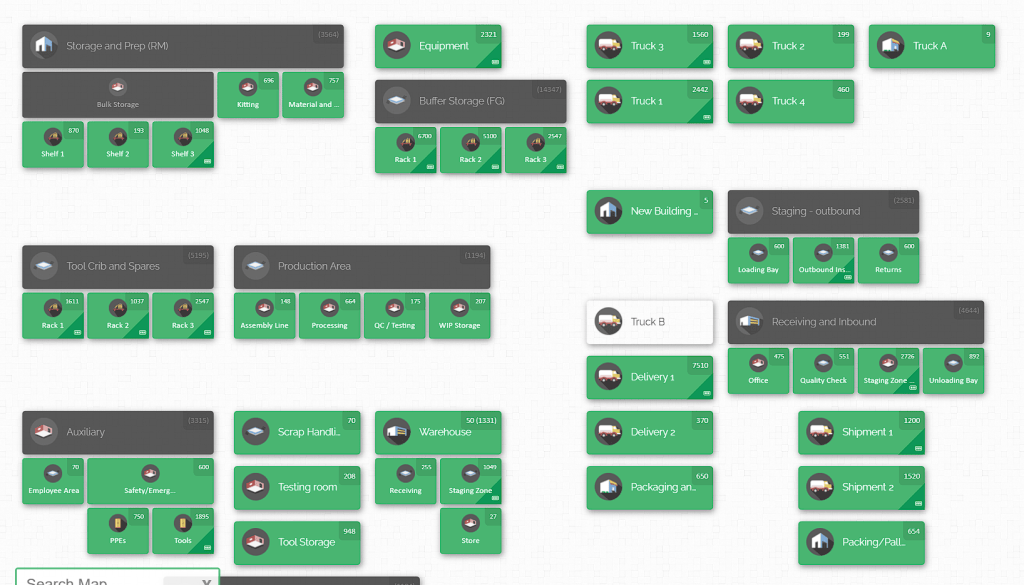
This guide explains how a map-based inventory system can slash search time, boost accuracy, and align multiple departments around a single, shared view of factory stock.
A well-designed inventory map ties together the physical layout of the plant and the inventory records in one place. Instead of guessing which shelf holds the needed hardware, you simply click the map. Operators, maintenance crews, and supply planners all reference the same “picture” of your factory. In the sections that follow, we’ll look at common search-time challenges in manufacturing, outline best practices to improve parts visibility, and walk through how to set up and use a visual mapping system. We’ll also highlight how a solution like CyberStockroom enables these practices, giving every department real-time clarity on where every part resides. By the end, you’ll have a step-by-step guide to cutting parts-search time and creating a more efficient, lean-friendly operations system.
The Search-Time Challenge on the Factory Floor

Manufacturing environments often juggle a wide variety of inventory – raw materials, work-in-progress components, sub-assemblies, spare parts, finished goods, and more – all spread across warehouses, storage rooms, production cells, and even outdoor yards. When every department is tracking parts separately, the result is inventory blind spots. Common symptoms include:
- Lost or Misplaced Items: Without a clear location system, a needed part might be “somewhere in the plant” but no one knows exactly where. People spend minutes walking between zones or opening random bins.
- Production Delays: A missing component means a machine stops or a production line halts until someone finds it. That idle time is expensive downtime.
- Emergency Reorders and Overtime: When teams think parts are missing, they rush in expedited orders or pull staff overtime. Often the part was in the building the whole time – just not visible.
- Inventory Inaccuracy: Without synchronized data, physical counts drift from what the system says. One area might think it has 100 bolts on hand, while another finds only 50 upon inspection. This leads to surprise stockouts or excess “just in case” stock.
- Wasted Labor: Studies of manufacturing operations show that an average technician can spend 15–25 minutes per shift searching for materials, tools, or work orders. In a 200-person factory, that adds up to over 50 man-hours wasted per day (pure search time).
- Unsafe Conditions: Cluttered or overloaded storage zones can create hazards. Search-related chaos (e.g. tools strewn about, blocked aisles) can violate safety norms like the 5S “Straighten” rule.
Every extra step and double-check means higher costs and lower productivity. In lean manufacturing terms, time spent hunting for parts is pure waste (one of the “Seven Wastes” or muda). A visual inventory map directly tackles this waste by turning the factory into a navigable blueprint. Instead of wandering aimlessly, every part in the plant has a known home on the map. The map answers the key questions: “What do we have, and where is it?”
What Is a Visual Inventory Map?
A visual inventory map is exactly what it sounds like: an interactive map or floor plan of your facility that shows where inventory items are stored. Think of it as a digital blueprint that overlays inventory data on top of your physical layout. Each room, aisle, shelf, bin, work cell, or yard zone becomes a marked location on the map. When implemented correctly, this map displays not just where things are, but also how many are there right now.
In practice, a visual inventory map might look like a factory floor diagram divided into zones: raw materials room, tool crib, production lines, finished goods rack, shipping dock, etc. Within each zone, shelves and bins are drawn or annotated. For example, the map could show that “Bearing 12345” is stored on Shelf A3, Bin 2 in the raw materials area and that there are 37 units on hand. Another part, “Hydraulic Valve 678”, might be in Tool Cabinet 4, Section B on the assembly line. Users can navigate this map on a computer or tablet, clicking zones to zoom in and reveal the specific items and counts.
Key elements of an effective inventory map include:
- Defined Locations & Zones: The first layer is laying out your space. For a manufacturer, zones could be “Raw Materials Storage,” “Machine Shop,” “Assembly Line 2,” “Maintenance Crib,” or “Outdoor Staging.” Each zone is a major area.
- Sublocations or Bins: Within zones, you drill down to actual storage bins, shelves, drawers, racks or containers. For instance, under “Raw Materials,” label each pallet rack or shelf (e.g. Rack A, Shelf 3). Under “Finished Goods,” mark each shipping pallet location.
- Live Inventory Counts: The map isn’t just graphical; it’s data-driven. Each sublocation on the map shows the current quantity of any stored items. If Shelf A3 has 60 of Part X and 120 of Part Y, those numbers appear on or next to the map icons. This tells you at a glance what’s full or empty.
- Item Details and Context: Clicking on a location on the map should pop up the list of items stored there, along with details like SKU, description, batch or lot number, and any custom fields (like project name or maintenance status). You might even attach photos to unusual items. This context helps workers confirm they’ve found the right thing.
- Inventory Movements: A good system will show movement history or allow you to drag items from one spot to another. Every time you receive stock, consume parts on a line, or move items, the map updates. Over time you can see flow patterns: for example, that items moved from Zone A to Zone C on this date.
- User-friendly View: Unlike a block of rows in a spreadsheet, the map format leverages visual clues. Zones might be color-coded, or critical bins marked red when low. This makes it easier for operators to spot problem areas or quickly identify part locations without reading through tables.
Imagine walking into a plant and seeing on a wall screen the entire operation laid out: warehouses on one side, production cells in the center, maintenance and shipping on the edges. The map highlights that Bearing 12345 sits in Bin B2 of Aisle 4, with a neon circle around it. Maintenance needs that bearing now, and instead of paging through spreadsheets or calling around, a single glance at the map tells them exactly where to pick it.
By turning inventory from abstract numbers into a concrete layout, a visual map answers the perennial questions “Where is that part?” and “How much do we really have?” in seconds instead of hours. It bridges the gap between digital inventory data and the physical reality of the factory floor.
Key Benefits of Inventory Mapping

Switching from lists and spreadsheets to a visual map delivers many advantages. In a high-throughput manufacturing environment, the benefits add up quickly:
- Drastically Reduced Search Time: The most immediate gain is time saved finding parts. With a map, the question “Where can I find this part?” is answered at a glance. If a line operator needs a specific bolt, they simply locate it on the map and walk straight there, eliminating guesswork. Studies and real implementations show search times can drop by 75–90%. For example, teams that once spent 15–20 minutes per shift hunting components often end up with only a few minutes of search after mapping. That frees up hours of productive time daily.
- Improved Inventory Accuracy: When every item has a designated spot on the map, it’s easier to keep records accurate. Workers return items to the same labeled location, and cycle counts become more reliable. A visual system also helps quickly spot anomalies (e.g. “Why does Shelf A3 suddenly have 0 of a part it should have 50?”). In one analysis, inventory accuracy jumped from the 70–85% range up into the high 90s after implementing real-time mapping and tracking. Accurate counts mean fewer unexpected stockouts or unnecessary overstocking.
- Faster Workflows and Production: Map-based visibility often reveals inefficiencies. For instance, you might notice a frequently used part is stored far from the assembly line that needs it, causing wasted travel time. By seeing such patterns, teams can rearrange layouts for smoother flow. Material travel distances get shorter and production delays from missing parts are minimized. Overall throughput increases when machines wait less and workers walk less.
- Consolidated Space Utilization: Visual maps help planners optimize storage. If a map highlights that one rack is 90% full while a neighboring rack is only 30% utilized, you can shuffle items to use space better. Similarly, finished goods encroaching on prime raw-materials real estate can be spotted and corrected. Over time, this leads to a leaner footprint and potentially reduced warehousing costs.
- Cross-Department Alignment: Perhaps most critically for manufacturers, the map becomes a single source of truth for all teams. Production, maintenance, quality, purchasing, and warehousing staff all work from the same map. When a line stops for parts, a maintenance manager and procurement agent can independently confirm stock levels in seconds. This alignment prevents scenarios like one department ordering emergency supplies that are languishing in another department. It unifies communication by giving everyone a shared visual context.
- Easier Onboarding and Training: New hires or temporary staff grasp a visual layout faster than text-based instructions. A map can often replace hours of orientation. Workers can click through the digital floor plan to see where key parts are stored, instead of memorizing aisle numbers from day one. This accelerates learning, especially in complex facilities.
- Stronger Lean Practices: Inventory mapping naturally reinforces lean principles like 5S. The map embodies “Set in Order” by designating fixed locations, and “Standardize” by using consistent labels and processes across shifts. It also exposes irregularities (violations of Shine) by making missing or dirty items stand out on the map interface. In effect, the map extends lean beyond just visuals on the wall to live data on the computer.
Together, these benefits transform inventory from a recurring headache into a competitive advantage. Instead of guessing and firefighting, teams make decisions based on a clear, real-time picture of the floor.
Best Practices for Parts Visibility and Inventory Organization
Achieving near-perfect parts visibility requires a combination of technology and disciplined processes. Here are proven best practices that, when integrated with a visual map, keep search times low and accuracy high:
- Centralize Inventory Data in One System. The foundation is a single source of truth for all stock levels and locations. Rather than multiple spreadsheets or siloed databases for each department, use one unified inventory management system (cloud-based if you can) that everyone updates. This way, receiving, moving, and issuing parts are logged in real time. For example, when Production uses 50 bolts, the database updates and reflects it on the map immediately. This prevents situations where Maintenance thinks there are 200 bolts in store because their system wasn’t updated with the last withdrawal. Centralization eliminates blind spots between departments.
- Standardize Location Naming and Labeling. Every storage location, rack, bin, shelf, and cabinet should have a clear, unique label. Adopt a logical naming scheme (like Aisle-Row-Bin) and stick to it across the plant. Affix durable labels or signs on each location. For instance, “WH-04-R2-B4” might mean Warehouse 4, Row 2, Bin 4. By standardizing labels, scanning or entering a location code becomes foolproof. This ensures the map’s picture of the floor matches reality exactly.
- Use Real-Time Tracking and Scanning. Speed and accuracy hinge on capturing data as transactions happen. Equip teams with barcode scanners at receiving docks, production lines, and stockrooms. Every time a part is received, transferred, picked, or returned, a quick scan should update the system. This real-time tracking means the map is always current. If feasible, employ RFID tags for high-value assets or containers: RFID readers at chokepoints can automatically log multiple movements at once, reducing manual scans. The goal is to eliminate “offline” movements. For example, set up routine motions like: every bin move must include a scan “from” and “to” on the map, and every pick or putaway also involves scanning the bin. This habit prevents inventory from “disappearing” between counts and ensures the map reflects true stock levels.
- Implement Cycle Counts and Audits. Even with everything digitized, random errors or losses can creep in. Prevent major discrepancies by doing frequent cycle counts. Unlike a full annual stocktake, cycle counting means counting portions of inventory continuously. For instance, count one rack or category per week. The visual map can actually guide counts: “Count all bins highlighted in yellow (high-use items) this week.” Investigate any mismatches immediately. Regular auditing ensures the map data stays trustworthy. Integrating these counts into the mapping tool (checking off each bin on the map as it’s counted) both verifies records and reinforces the learning of item locations.
- Adopt Lean/5S Principles with a Digital Twist. Leverage lean methodologies as you build the map. Start by Sorting: remove obsolete or excess stock so you only map active items. Next, Set in Order: place frequently used items closest to their point of use (for example, store parts for Assembly Line 1 in a nearby zone). The map helps validate these decisions by showing item movements – you’ll see if you need to relocate something. Shine: keep areas clean and organized so visual cues on the map match the physical space. Standardize: write down procedures for mapping, scanning, and updating locations, then train teams on them (standard work). Finally, Sustain: enforce the discipline that every part move goes through the map system. The result is a digitally-extended 5S culture where inventory is sorted, ordered, and clearly controlled.
- Train and Engage the Entire Team. Inventory visibility is a team sport. Make sure everyone who handles parts – from receiving clerks to assemblers to storekeepers – understands the map system and why it’s important. Provide hands-on training on how to use the map interface: how to look up a part’s location, how to scan a transfer, how to update counts. Emphasize that this process saves them time later (less frantic searching) and prevents scrambles. Encourage reporting issues like missing labels or suspicious discrepancies. When staff are part of the solution and see immediate benefits (e.g. finding parts quickly), they buy into it. A culture of inventory ownership – where each person feels responsible for updating data – is crucial.
- Keep the Map Up-to-Date. A map is only as good as its accuracy. Any time you reconfigure the floor – moving shelves, adding racks, changing a storage policy – update the map immediately. Likewise, when skus are added, discontinued, or renamed, reflect those changes. Make it a best practice to edit the digital map before rearranging hardware in the real world. Some teams hold a brief “plan review” before layout changes, walking through the software first. That way, the map always mirrors the actual facility.
By following these practices, you build a foundation that lets a visual inventory map truly shine. Technology does its part, but disciplined processes and engaged people make it effective.
Building a Factory Floor Plan Inventory Map
Creating an inventory map of your factory floor may sound daunting, but breaking it into steps makes it manageable. Here’s a high-level roadmap to get started:
- Survey and Plan Your Layout: Begin by sketching your facility’s major areas. Identify key zones such as receiving bay, raw material storeroom, production cells, tool cribs, finished goods area, shipping docks, and any outdoor storage yard. Decide on logical zoning (e.g., numeric or color-coded) that fits your operations. It helps to walk the floor, taking photos or notes, to ensure no space is overlooked.
- Choose or Digitize a Floor Plan: If you have existing CAD drawings or architectural blueprints, import them into your mapping software. Otherwise, create a simple digital floor plan using the tool’s drawing functions. Outline walls, aisles, and equipment locations. The goal is a map where you can draw or place visual elements for racks, cabinets, and bins. This becomes the canvas of your inventory map.
- Define Storage Locations: On the map, add markers for each storage location. Each pallet rack, shelf, drawer, bin, and toolbox gets a designated spot. Label these with your chosen location codes. For example, draw a box for “Tool Cabinet A” near the assembly area and label it accordingly. Think hierarchically: a room may contain several racks, each rack has multiple shelves, etc. Many mapping tools allow nested or parent-child locations (like “Building 1 > Mezzanine Level > Shelf 2”).
- Organize by Category or Department: It often helps to group similar storage together on the map. For instance, raw material bins in one cluster, maintenance tools in another. This grouping should reflect how your teams think about inventory. You might color-code zones by department (blue for Warehouse, green for Production, yellow for Maintenance). Clarity here makes the map intuitive to use by any department.
- Input Initial Inventory Data: Populate the system with your existing stock data. If moving away from spreadsheets, you can usually import SKUs, descriptions, and quantities into the software in bulk (CSV import). Then use the map interface to “place” items into their starting locations. For example, check in 500 units of Steel Rods to the Raw Materials Rack 3 location on the map. This seeds the map with current inventory.
- Implement Scanning and Check-In Processes: Decide on a system for logging movements. For example, at receiving, scan each incoming pallet and scan the designated location on the map to check it in. Similarly, when parts move to production, scan them into the production area location. Configure the software so that scanning a part and a location triggers a check-in or check-out. This step is crucial: it establishes the habit of keeping the map in sync with reality.
- Train Users on the Map Interface: Before rolling out widely, show key staff how to use the map. Demonstrate looking up parts (search by SKU or name and see map location), performing transfers (drag-and-drop or scan “from”/”to”), and doing cycle counts (marking off locations on the map). Ensure they understand any naming conventions and data entry rules.
- Go Live and Iterate: Start using the map for day-to-day operations. It’s wise to pilot with a small area or one department first, then expand. Encourage feedback – if someone can’t find a part, update the location on the map. Every discrepancy is a learning moment. Over the first few weeks, refine the layout: maybe some bins should be split, or rare items moved to less prominent zones. The map should evolve to match how work actually flows.
- Embed in Daily Routine: Make the inventory map the hub of stock activities. For example, when a production order is released, staff can check parts right from the map. When maintenance schedules a repair, technicians see spare part locations immediately. Use the map for planning material requests. The more it’s woven into daily tasks, the more accurate and useful it becomes.
Throughout this process, keep the map visible and accessible. If possible, display the live inventory map on monitors in planning or production offices. This constant visibility builds trust in the system.
Key Metrics and KPIs to Track

To demonstrate the impact of a visual inventory map, it’s important to measure performance before and after implementation. Key metrics related to search time and visibility include:
- Average Search Time per Task: Time how long workers spend locating parts. This can be logged during orders or recorded by a few test runs. After mapping, this time should shrink dramatically. Even anecdotal comparisons (“I found it in 2 minutes instead of 20!”) are valuable. Over time, aim for search tasks under 1/4 of their original duration.
- Inventory Accuracy (%): Compare system stock levels to physical counts. Accuracy is calculated as (system quantity – discrepancy) / system quantity. Many plants struggle to get above 80% with manual methods. Mapping with scanning should push this up near 99%. Track accuracy as a percentage or error rate over time. A rise from, say, 85% to above 98% indicates the map and processes are catching discrepancies early.
- Stockout Frequency: Count how often lines stop due to missing parts. If using the map prevents unplanned stops, this metric will fall. Likewise, emergency replenishment orders for “missing” inventory should drop. For example, if you averaged 5 emergency part orders per week before, mapping and better visibility might halve that number.
- Picking/Pull Productivity: Measure how many picks (parts retrieved) a worker can do per hour. With a map, workers can plan efficient routes (zig-zag through Aisle 1, then Aisle 2, etc.). Over time, picks-per-hour should increase. If possible, track how many line items are fulfilled per labor hour and watch for gains after map implementation.
- Cycle Count Variance: Keep track of how many locations are off-count during audits. Initially, miscounts will reveal training gaps or errors. After improvements, expect variance to drop. For instance, a 20% error rate on cycle counts might fall to under 5% as the map and scanning enforcement catch mistakes immediately.
- Time Saved (Labor Hours): This is the big one for executives. Estimate how many hours per week your staff save by not searching. If a plant of 100 people saves even 10 minutes of search each per shift, that’s 16.7 labor-hours saved per week (assuming two shifts). Multiply by wage rates to quantify savings. Many companies find mapping yields tens of thousands of dollars in annual labor savings.
- On-Time Fulfillment and Fill Rate: With better visibility, you should fill orders from stock more often (higher fill rate). Measure the percentage of internal or customer orders filled on time from inventory. Improvements here tie back to having the right parts in the right place.
- Order Lead Time or Delivery Delays: As an indirect measure, see if finished-goods or build orders face fewer delays. If less time is spent hunting parts, overall lead times should tighten.
By benchmarking these before and after implementing the map, you can clearly demonstrate ROI. For example, one asset-tracking study showed inventory accuracy go from roughly 75% up to nearly 99%, and search time shrink from an average of 20 minutes to about 3 minutes per shift. These gains translate into real financial benefits: less downtime, lower expediting costs, and streamlined audits.
Setting specific targets (e.g. 50% reduction in search time, 95% accuracy) gives your team something to shoot for and helps sustain momentum.
Cross-Department Coordination and Shared Visibility
In many plants, different departments manage their own sections of inventory. Production keeps its consumables, maintenance holds spares, and stores maintain raw materials, often with little communication. A visual inventory map breaks down those silos. Here’s how:
- One Unified View: The map is a common interface. Whether someone in production, maintenance, or procurement logs in, they all see the same floor plan and stock levels. This transparency means a request for “100 nuts” no longer requires calling multiple departments – you simply find where nuts are on the map. Everybody is literally “on the same page.”
- Real-Time Collaboration: If maintenance takes a rare part out of the storeroom, it’s immediately reflected. Production planners know not to allocate that part elsewhere. Conversely, if production moves some items for a job, maintenance sees that their storeroom levels fell. This live sharing prevents the all-too-common double-booking of parts.
- Unified Stockouts and Replenishment: When any location on the map is low on a critical part, an alert or report can trigger replenishment. But crucially, the visibility is plant-wide. There is no question like “Is department X out of stock of widget Y, or do we have it in another location?” The map shows aggregated availability across zones. Departments coordinate restocking by seeing all available inventory.
- Cross-Functional Audits: Teams can audit together. For instance, in a cycle count, a maintenance lead and warehouse manager might review the same map location for parts they both care about. Sharing the map in meetings or on shared screens helps identify who should count what. It also fosters accountability: everyone knows data is open to peers.
- Improved Communication: Sometimes showing is better than telling. Instead of describing a problem (“I think the part is in row D”), departments can simply share the screen and point to the map. New initiatives, like rearranging a section or adding just-in-time kanban, can be easily visualized with everyone looking at the map.
- Cross-Department Processes: The map allows enforcing processes across teams. For example, any movement of a part – whether by a storekeeper or a production crew – must be done on the map. This standardizes procedures across functions. It also means mistakes are caught outside each department’s bubble.
Ultimately, the shared map enforces a single version of reality. This alignment yields smoother operations: if one team runs low on an item, another team might volunteer a nearby supply. Issues like “we ordered it twice” or “I put it back, it says it’s still out” become much rarer. In lean terms, the inventory map serves as the ultimate visual management tool – but digital, interactive, and accessible to all layers of the organization.
CyberStockroom: A Map-Based Inventory Solution
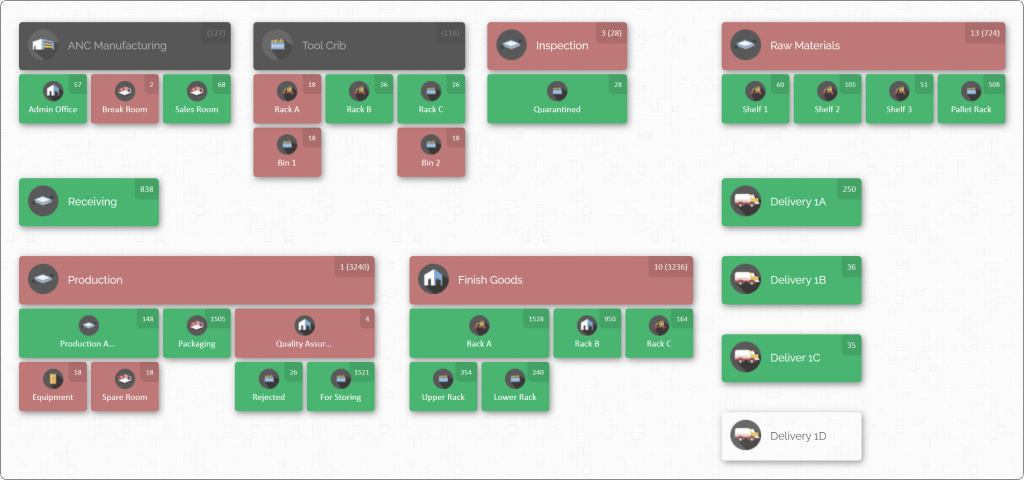
To put all the above into practice, manufacturers need a tool that brings the map and inventory data together. CyberStockroom is an example of a cloud inventory management platform built around visual mapping. In simple terms, CyberStockroom lets you recreate your entire factory floor digitally, then track every item within it. Here’s how it aligns with the best practices and solves the multi-department visibility problem:
- Custom Plant Layouts: With CyberStockroom you start by drawing out your own facility map. Every building, warehouse, assembly line, and even outdoor storage zone can be mapped. You define rooms, aisles, shelves, bins, or any container as “locations” in the system. This flexibility means one plant can have five warehouse zones and another can have tool cabinets and truck loading docks, all on the same map interface.
- Live Inventory on the Map: Once the map is in place, each location shows what’s stored there. The system displays real-time counts of each item at each bin. A manager can zoom or click into any zone and immediately see, for example, that Shelf A, Bin 3 contains 100 screws and 50 nuts. As workers move stock or update counts, those numbers change instantly. This is inventory visibility at a glance.

- Easy Transfers with Drag-and-Drop: CyberStockroom makes moving items intuitive. If a batch of parts needs to go from Warehouse A to Production Room B, you literally drag the item icon from one location box to another on-screen. The system then records a transfer. This visual action enforces the process (“scan from here and to there”) while keeping it user-friendly.
- Barcode Scanning for Accuracy: Every item and location can have a barcode. Workers use handheld scanners to check inventory in or out. Scanning the part’s code and the location code automatically updates quantities. This reduces typos and ensures each movement is tied to an exact spot on the map. Even warehouse staff in one area and maintenance techs in another use the same scanning procedures, further standardizing processes.
- Cloud Access for All Departments: Being cloud-based, CyberStockroom is accessible via any web-enabled device. Everyone – from a warehouse clerk at a desktop to a maintenance engineer on a tablet – logs into the same system. This means multiple users across departments and shifts all see the same live map and data. Whether someone is across the hall or at a remote site, they have the up-to-the-minute inventory view.
- Organization-Wide Visibility: Because the map encompasses the whole operation, CyberStockroom lets you handle multiple warehouses or even separate plants in one system. A single dashboard can show inventory across all locations. This ensures that cross-plant or cross-department queries are answered by the same source. If your plant in Plant A has excess of an item, and Plant B needs it, the solution is clear.
- Enhanced Training and Communication: New staff can open the map and see a visual orientation of the site. Training is faster because an instructor can guide them through the map instead of describing locations from memory. Likewise, meetings can include map snapshots to quickly explain issues or planned changes.

In summary, CyberStockroom effectively brings to life the “digital twin” of a factory’s inventory. Everything we’ve discussed in this guide is enabled by such a tool: it enforces standardized location naming, it centralizes data, it shows inventory in a visual way, and it makes real-time tracking simple. With CyberStockroom, teams can follow best practices without extra manual effort: scanning and dragging items on the map becomes second nature. Search time plummets because the answer to “where is that bolt?” is literally on the map in front of you.
How to Implement a Visual Inventory Map – Step by Step
Putting it all together, here’s a condensed guide to cut search time using an inventory map. These steps combine the best practices and CyberStockroom-style features into an implementation plan:
- Define Your Goals: Before starting, clarify why you need a map. Common goals include reducing downtime, improving count accuracy, or speeding up picking. Identifying metrics (like desired search time reduction or accuracy improvement) guides your effort and helps measure success.
- Choose Your Tool: Select inventory software that supports visual mapping (for example, CyberStockroom). Ensure it meets your needs: multi-department access, barcode scanning, cloud access, and customizable maps. Test it with a free trial if possible.
- Create the Floor Plan: Use the software to draw or import your facility layout. Include all relevant areas. Align this digital map with your physical labels (aisle numbers, machine numbers, etc.) so they correspond.
- Label Physical Locations: On the shop floor, make sure every storage bin, rack, or zone has a durable identifier. Enter these exact labels into the map as location names. Consistency here is key – the map labels should match what people see on shelves and pallets.
- Setup Categories or Sub-Zones: Within each major area, define sublocations. For instance, “Tool Room – Cabinet 1, Drawer A” or “Warehouse – Rack B, Level 2.” This granularity allows precise tracking. On the map, these appear as nested boxes or icons within a zone.
- Import or Add Inventory: Populate the system with current inventory items and quantities. You might upload an existing spreadsheet of SKUs and counts. Initially, you may check items into map locations in bulk (e.g. count items on one shelf and mark them as in “Rack A”).
- Implement Barcoding: Print barcodes for all items and, importantly, for each location on the map. Stick codes on shelves, bins, and product labels. Ensure scanning hardware (handheld terminals or smartphones) is available at key points. Configure the system so scanning item + location triggers a check-in/out.
- Define Processes and Train: Standardize how to use the map in daily work:
- Receiving: On arrival, scan incoming items and then scan their map location to “check them in.”
- Production picking: Scan items out of their storage location (map updates outflow) and then into the workstation location or consumption bin.
- Transfers: When moving items between locations (e.g. from Warehouse to Shop Floor), scan “from” and “to” locations on the map, or use drag-and-drop in the software.
- Cycle counts: Use the map interface to mark off locations as they are counted, and correct discrepancies on the spot. Train all relevant staff on these routines until they become habitual. Emphasize that no part should move without the map reflecting it.
- Go Live with Pilots: Start small. For example, fully implement mapping in one production line or storeroom first. Let that team fine-tune the process. Make sure all transfers there use the map. Quickly reap initial benefits (reduced search in that area) to build confidence.
- Expand Plant-Wide: Gradually roll out to other areas. Importantly, enforce that everyone – in every department – uses the map-based method. Update the map layout as you extend (new zones, updated labels, etc.).
- Monitor and Refine: Track the KPIs defined earlier (search time, accuracy, etc.). Use the map’s reporting to see if items are frequently misplaced or if certain bins are confusing. Re-organize storage if needed. The map’s visual nature helps identify inefficient layouts (perhaps two high-use items are on opposite ends of the plant – move them closer). Adjust as operations change.
- Maintain and Update: Keep the inventory map current. Whenever shop layouts change (e.g. new rack, removed shelving) or inventory is re-categorized, update the map immediately. Consider weekly checks to ensure high-priority locations are accurate.
- Leverage the System: As everyone gets comfortable, use the system’s full features. Set low-stock alerts on important parts. Pull reports like usage by location or turnover rates by bin. These insights can drive further improvements, like consolidating slow-moving SKUs or optimizing reorder points.
By following these steps, manufacturing plants can systematically build a map-driven inventory environment. The key is consistency: if you fully integrate the map into daily operations, it becomes the routine. Over time, the cumulative effect is a drastic cut in wasted search time and a culture of full parts visibility.
Conclusion
In today’s competitive manufacturing landscape, operational efficiency is paramount. Every wasted minute searching for a part chips away at productivity and profitability. Fortunately, the solution is at hand: transforming your factory floor plan into an interactive inventory map. This simple idea – visualizing inventory where it lives – yields outsized benefits. It slashes search times, boosts accuracy, streamlines workflows, and aligns teams from production to procurement.
Implementing a visual map requires an initial investment of effort: mapping the floor, tagging locations, training the team. But the payoff comes quickly. Technicians who used to wander for half an hour now know exactly where to click on the map. Inventory discrepancies become rare. Cross-department communication is easier. And as one study showed, search times can drop by roughly 80%, freeing up hours of labor that can be put back into manufacturing.
Key to success is combining good process with the right tool. Lean methods like 5S and cycle counting lay the foundation, while software like CyberStockroom brings those principles to life with a map-driven interface. In practice, such a tool lets you build your own factory blueprint in the cloud, drag-and-drop parts from bin to bin, and see live stock levels on-screen. The entire plant – from the tool crib to the loading dock – becomes an open book.
The result is a workplace where “where is this part?” is no longer a stressful question. Instead, operators simply reach for the map. Inventory teams cut needless walking and double-work, and managers gain confidence in data they can literally see. In short, a visual inventory map turns a chaotic parts storage scenario into a streamlined, visual-controlled system.
For operations teams tasked with efficiency, embracing inventory mapping is a natural next step. By making every part’s location instantly visible, manufacturing plants eliminate one of the biggest sources of waste. The factory runs smoother, downtime drops, and teams finally stop chasing ghosts.
In summary, building a factory floor plan inventory map – and using it as your operational hub – is a proven way to cut search time and elevate your entire production process. Start small if needed, but start today. As your map grows, so will your gains: faster order fulfillment, greater space utilization, and a competitive edge powered by transparency. With this approach, search time becomes a problem of the past, and full parts visibility becomes the new normal.









Leave a Reply