
Why Multi-Line Inventory Control Breaks Down
Managing multiple production lines becomes difficult long before a plant technically runs out of material. The deeper problem is usually that production, maintenance, quality, purchasing, receiving, and storeroom teams do not share the same picture of what inventory exists, where it is located, and whether it is genuinely available for use. A plant may have enough bearings, fasteners, fittings, consumables, fabricated components, electrical parts, or packaging materials in total while one line still experiences a shortage because the available stock is sitting somewhere nobody supporting that line can readily see. For this reason, improving inventory visibility should be treated as an operational control problem rather than simply a stock-counting problem.
The challenge increases as facilities add production lines because inventory stops behaving like one centrally controlled pool. Materials may be stored in a main warehouse, maintenance crib, line-side rack, quality area, receiving zone, supermarket, work cell, job-site container, or temporary staging location, while the same part number can appear in several places at once. When records show only a plant-level quantity, people know how much inventory supposedly exists but not whether it is positioned where the next production requirement can use it. Effective control therefore requires location-level visibility that connects quantity with the physical place where that quantity resides.
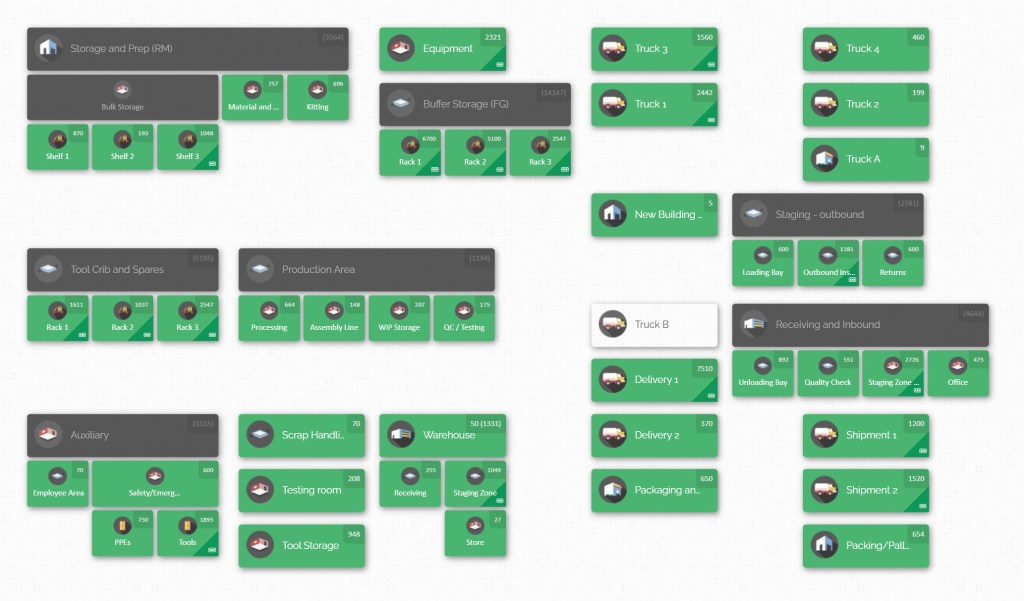
This distinction matters because a production line does not consume an abstract plant-wide balance. It consumes specific material from a specific physical location at a particular time, and an otherwise accurate total can still create disruption if stock has been staged, transferred, quarantined, partially consumed, or left at another work center without an accompanying record update. Manufacturing information models distinguish inventory balances from actual counts by item and location for precisely this reason, while established lean material-handling practices similarly emphasize point-of-use and storage-location information. Building multi-line inventory control around location therefore makes the record more representative of how production actually operates.
A common example is a component shared by Lines 1, 2, and 3. The system may show 600 units on hand, but 300 may already be staged at Line 1, 180 may be in a supermarket serving Line 2, 70 may be in a receiving area, and only 50 may remain in unrestricted central storage. If Line 3 needs 120 units for its next run, a planner looking only at the 600-unit total could conclude that material coverage is comfortable even though the immediately usable central quantity is insufficient. A useful multiple production lines inventory allocation visual makes that distribution visible before a shortage reaches the machine.
Poor visibility also encourages local optimization. Supervisors who have experienced material shortages may begin protecting themselves by keeping extra stock beside their lines, while maintenance employees may establish unofficial cabinets and purchasing teams may place precautionary orders because they cannot confidently verify plant-wide availability. Each decision can make sense from the perspective of one department, yet collectively those decisions create duplicated stock, hidden inventory, congested line-side areas, and increasingly unreliable records. In practice, inventory visibility is what allows departments to replace defensive behavior with coordinated decisions.
The resulting problem is often described as an inventory accuracy issue, but accuracy should be interpreted more carefully. Inventory accuracy means that the physical reality agrees with the recorded reality, and cycle counting is one established method for repeatedly testing that agreement rather than waiting for a full physical inventory. When the system says a component exists but people cannot locate it where expected, the plant effectively has phantom availability from an operational perspective. Repeated comparison between physical stock and system records is therefore essential to maintaining trustworthy information.
Visibility should also include material movement, because location records deteriorate quickly when transfers are treated as informal shop-floor activity. A mechanic who takes a replacement motor from a storeroom to a production line, a material handler who moves a tote between supermarkets, or an operator who returns unused components after a changeover has changed the physical inventory picture. If the digital record is not updated at roughly the same point in the workflow, the next person works from yesterday’s location assumptions rather than today’s reality. Manufacturing inventory systems consequently treat source, destination, quantity, and movement as fundamental inventory information.
Visual management helps because manufacturing teams make faster decisions when the status of work and materials can be understood without reconstructing the situation from several disconnected files. Lean production practices commonly use visual controls to make conditions, abnormalities, location information, and production status apparent at the place where work occurs. Visual systems are most valuable when they expose problems so teams can act on them, rather than merely decorating existing information. The same principle applies to inventory: a visual map should make shortages, concentrations, misplaced stock, and alternative locations easier to recognize.
For plants operating several lines, the goal is therefore not simply to create a prettier inventory screen. The goal is to establish a shared operating picture that answers four questions consistently: what material do we have, how much do we have, where is it, and which operation can actually use it? Once those answers are reliable, planners can make allocation decisions with less guesswork, production can find alternatives faster, maintenance can locate spares more efficiently, and purchasing can see whether additional stock is genuinely required. That shared picture becomes the foundation for the allocation process described throughout this guide.
Build a Visual Inventory Structure Before Allocating Stock

Before deciding how much inventory each production line should receive, define where inventory can physically exist. This sounds basic, but many allocation problems begin because a facility uses broad labels such as “warehouse”, “production”, or “maintenance” that are too vague to support daily decisions. A plant with several lines needs a location hierarchy that mirrors the real operating environment closely enough for employees to distinguish one usable stock point from another. Digital location structures can represent facilities, departments, production areas, rooms, racks, shelves, bins, vehicles, and other nested storage locations.
Start with the highest level that matters operationally, such as the plant, building, or major warehouse. Beneath that level, create locations corresponding to the areas people actually use when describing material movement, including raw-material storage, maintenance stores, quality hold, production supermarkets, fabrication, assembly, packaging, finished goods, and individual production lines where appropriate. Continue adding sublocations until a worker can identify the intended storage point without relying on personal knowledge. The purpose is not to model every square foot of the facility, but to create enough location precision that the digital record can be compared meaningfully with physical reality.
A useful test is to ask an employee unfamiliar with the area whether a location name would lead them to the correct stock. “Assembly storage” may be inadequate if the room contains twenty racks, whereas “Assembly > Rack 04 > Shelf B > Bin 03” gives a much clearer destination. Excessive detail can also become burdensome, however, particularly when every tiny temporary position is treated as a permanent location. The appropriate level is the point at which location information improves retrieval and control without forcing employees through unnecessary transactions.
Building this structure should be a cross-functional exercise rather than a warehouse-only project. Production knows which materials need to remain near machines, maintenance understands where critical spares are actually kept, quality controls restricted or inspection areas, and material handlers understand how stock moves between receiving, storage, staging, and point of use. Value-stream mapping guidance similarly recommends examining both material and information flows with cross-functional participation because different departments see different constraints and improvement opportunities. In practice, the people moving and consuming material often identify storage points that are invisible in formal layouts.
Walk the facility while designing the map instead of building it entirely from conference-room assumptions. Compare the proposed hierarchy with the locations employees use during a normal shift, including overflow racks, changeover carts, maintenance cabinets, staging areas, inspection locations, returned-material points, and partially consumed stock near machines. Value-stream mapping practice emphasizes observing work where it occurs and gathering inventory, queue, process, and information-flow details directly from the operating environment. This approach helps expose the informal storage arrangements that otherwise become blind spots in the future inventory system.
The next step is to standardize naming. Similar-looking labels such as “Line Two”, “Line 2”, “L2”, and “Assembly-02” can refer to the same place in different spreadsheets, creating unnecessary ambiguity when teams search, count, or transfer inventory. Adopt a naming convention that is short enough for daily use but specific enough to remain unique, and apply it consistently to signs, labels, maps, count sheets, and inventory records. Standardized location identification also improves the usefulness of barcode-based workflows because the scanned identifier can point to one defined storage location rather than a loosely interpreted area.
Once the location structure exists, define the role of each stock point. Central stores may carry flexible plant-wide inventory, line-side locations may hold only short-term working quantities, maintenance locations may contain specialized spares, and quality areas may contain material that is physically present but should not be treated as available to production. These distinctions prevent the damaging assumption that every on-hand unit is equally available to every production line. In practice, availability should reflect both physical location and operational status.
This is especially important with shared components. If three lines use the same connector, fastener, bearing, raw material, or packaging component, the plant should be able to see how the total quantity is distributed rather than forcing employees to inspect each storage area separately. Product-distribution mapping can show every location in which the same item appears, allowing teams to distinguish stock concentrated at one line from stock distributed across the plant. CyberStockroom’s map, for example, supports searching for a product and highlighting the locations that contain it, while its product-distribution view shows inventory across mapped locations.
A well-designed location map also improves counting discipline. Instead of issuing an instruction such as “count all bearings”, managers can assign counts by defined physical areas and compare each location’s recorded quantity with what is actually present there. This matters because plant-level accuracy can conceal location errors: two bins can be wrong in opposite directions while the total quantity remains correct. A location-based cycle-counting approach makes those errors visible and helps teams investigate why stock is moving without being recorded.
Before loading allocation rules into the process, confirm the starting quantities through a controlled physical count. A visual map built on inaccurate opening data simply makes inaccurate information easier to see, which can undermine confidence in the system immediately. Count each defined location, reconcile meaningful differences, place uncertain or unidentified material into a clearly controlled exception area, and only then establish the working baseline. Building confidence at the beginning makes employees much more likely to trust the map when they later need to decide whether another line has stock available.
The resulting facility model becomes the visual backbone for managing multiple production lines. Rather than thinking of inventory as one plant-wide number, teams can see central reserve, departmental stock, production supermarkets, line-side quantities, maintenance spares, quality-controlled stock, and staging inventory as distinct parts of the same physical network. That is the point at which inventory allocation becomes a controllable process instead of a series of informal decisions. Building on this foundation, the next task is deciding how material should be distributed among competing production requirements.
Allocate Inventory Across Production Lines Step by Step

Inventory allocation across multiple production lines should begin with demand and operating priority, not with whichever supervisor requests material first. Each line has a current production schedule, expected consumption rate, changeover pattern, material requirement, and tolerance for disruption, so equal distribution rarely produces the best result. A slow-moving line running a low-volume product may require far less shared inventory than a high-throughput line consuming the same component continuously. The objective is to position enough material to protect planned production while avoiding unnecessary line-side accumulation.
Start by separating inventory into three practical categories: dedicated stock, shared stock, and reserve stock. Dedicated stock is physically or operationally committed to one line or production order, shared stock can support more than one department or line, and reserve stock remains centrally controlled until demand justifies movement. This distinction prevents teams from treating staged material as though it were still freely available elsewhere. It also makes a multiple production lines inventory allocation visual much easier to interpret because viewers can understand not just quantity, but the role that quantity serves.
Next, establish expected consumption for each line over a meaningful operating window. Depending on the process, that window might be a shift, a day, the time between material-delivery rounds, or another replenishment interval that reflects actual shop-floor practice. Lean material-handling approaches commonly document daily usage, point-of-use location, storage location, standard container quantity, delivery frequency, and related data because those factors determine how much material should sit between central storage and consumption. The objective is to size line-side inventory from operational need rather than habit.
Consider a plant with three assembly lines using the same seal. Line A consumes approximately 400 seals per shift, Line B consumes 250, and Line C consumes 100, while material handlers replenish each line twice per shift. A reasonable starting allocation would therefore differ substantially by line even before considering safety allowances, production sequence, container size, and schedule risk. Allocating one-third of the available seals to each line would overprotect the lowest-use line and increase the chance that the highest-use line experiences a shortage. Consumption-based allocation creates a more defensible starting point.
After establishing expected usage, define minimum and maximum working quantities for each point-of-use location. The minimum should represent the level at which replenishment needs attention early enough to avoid disruption, while the maximum should prevent excessive line-side stock from consuming space or hiding inventory. These quantities should reflect replenishment frequency, container size, process variability, changeover behaviour, and the practical time needed to move material from reserve storage. Lean material-handling practice often uses minimum and maximum container quantities for exactly this reason.
Central reserve deserves special attention because it provides flexibility when production priorities change. If every available unit is pushed to individual lines, the plant loses a neutral pool that can respond to schedule changes, scrap, unexpected consumption, or temporary increases in demand. Keeping an appropriate reserve also reduces the temptation to raid another line’s point-of-use stock without recording the movement. In practice, a visible central quantity acts as a buffer for the entire plant rather than as an unexplained pile of extra inventory.
Allocation should then account for production sequence. A line preparing to start a high-priority order may deserve a temporary increase in staged material, whereas a line entering a planned changeover may need less of the current component even if its historical consumption is higher. This is where inventory visibility and production planning must meet: the map shows where material currently sits, while the schedule explains where material will soon be required. Visualizing process and material flow is a recognized way of identifying queues, inventory concentrations, bottlenecks, and opportunities to improve flow.
When supply is genuinely constrained, establish an explicit allocation rule before a shortage becomes urgent. Priority might be based on committed customer orders, production sequence, downstream dependency, line throughput, material substitution options, or another business rule approved by operations leadership. The important point is that allocation should not depend on who discovers the shortage first or who has the strongest local incentive to hoard stock. A visible rule turns constrained inventory into a coordinated plant decision rather than a departmental negotiation.
Transfers between production lines should follow a similarly defined workflow. If Line A has excess material and Line B is approaching its minimum, the plant should first confirm that the quantity at Line A is physically present, determine how much can be released without putting Line A at risk, record the transfer from source to destination, and then move the material. Source-and-destination movement records are fundamental to maintaining location accuracy because they preserve the connection between physical movement and inventory information.
A practical transfer process can be summarized in the following sequence. Each step should be simple enough to fit normal production work while preserving the information needed for trustworthy allocation.
- Confirm the receiving line’s actual requirement and required-by time.
- Check central reserve stock before removing material from another line.
- Review the donor line’s current quantity, planned consumption, and minimum level.
- Verify the material physically at the source location.
- Record the quantity, source, and destination as the transfer occurs.
- Move the material to the defined receiving location.
- Confirm that both locations now show quantities matching physical stock.
- Review repeated emergency transfers to determine whether normal allocation levels should change.
The final step is particularly important because frequent transfers are operational signals, not merely transactions. If Line B continually borrows the same component from Line A, the original min-max levels, replenishment schedule, storage design, or consumption assumptions may be wrong. Visual management is most useful when it reveals abnormalities that trigger problem solving rather than encouraging teams to normalize recurring workarounds. Production analysis boards follow this same principle by making variance visible so causes can be investigated.
Material staging also needs a clear definition because staged inventory is easily double counted in decision making. When components leave central storage for a production line, managers should decide at what point those units are considered committed and ensure the location record reflects that decision. A pallet sitting in a staging lane may still be physically near the warehouse, but operationally it could already belong to tomorrow morning’s production run. Making staging visible prevents another team from planning against material that has effectively been spoken for.
Returns require equal discipline. Production commonly ends a run with partial containers, unused kits, leftover consumables, or material removed during a changeover, and those quantities can remain invisible if employees simply place them on a convenient rack. Establish a designated return location or process so unused material moves from line-side inventory back into a recognized storage point before it is treated as generally available. This closes one of the most common gaps between physical stock and the quantities planners believe they can allocate.
Quality status adds another layer. Material awaiting inspection, investigation, disposition, or other controlled action may physically appear in the building while being unsuitable for current production. A map should therefore distinguish where controlled stock is located so employees do not confuse physical presence with permission to consume it. Accurate location records work best when they support the operational meaning of the location rather than showing an undifferentiated total.
For critical components, consider keeping visual allocation rules simple enough that supervisors and material handlers can explain them without referring to a complex planning model. For example, each line may hold one replenishment interval of working stock, central stores may retain the remaining unrestricted balance, and temporary schedule-driven increases may be staged only against released production requirements. Simple rules are easier to audit, train, and correct when conditions change. The sophistication should reside in good operating discipline and accurate information rather than unnecessary complexity.
The best allocation process therefore combines demand, location, quantity, status, and timing. None of those elements alone provides enough context: demand without location can create phantom availability, location without quantity cannot support replenishment, quantity without status can overstate usable stock, and current inventory without production timing can place material in the wrong area. A multiple production lines inventory allocation visual brings these dimensions together in a format teams can discuss during daily operating decisions. Once the plant can see the allocation clearly, the next priority is keeping that picture accurate.
Improve Accuracy and Cross-Team Operating Discipline

Inventory visibility deteriorates when transactions depend on memory. Employees may know they are supposed to record transfers, returns, issues, receipts, or adjustments, but production pressure encourages shortcuts when the recording process is slow, unclear, or detached from the physical work. Over time, small omissions accumulate until the inventory system becomes a rough estimate rather than a dependable operating tool. Accuracy therefore depends as much on workflow design and accountability as it does on the software displaying the data.
Begin by defining which inventory events require an update. Typical events include receipt into a storage location, movement between locations, issue to production, relocation between production lines, return from a line, quantity adjustment following a count, and movement into or out of controlled areas. Each event changes either the quantity, the location, or the practical availability of stock. A clear transaction standard eliminates uncertainty about when employees are expected to change the record.
Transactions should occur as close as practical to the physical movement. Recording ten transfers from memory at the end of a shift creates opportunities for forgotten quantities, reversed source and destination locations, and incorrect part selection. By contrast, updating the record during the move keeps the digital representation aligned with what the employee is doing physically. Systems that maintain inventory state, location, quantity, and movement history are built around this connection between material movement and record movement.
Location labels can reduce friction further. Machine-readable product and package markings are widely used for inventory-control and manufacturing applications because scanning can identify an item or storage point without requiring repeated manual entry. The practical benefit is not technology for its own sake, but fewer opportunities for workers to type or select the wrong identifier during routine inventory activity. Clear human-readable labels should still accompany scannable identifiers so the physical location remains understandable even when a scanner is not being used.
Cycle counting then provides the feedback loop that tests whether the operating process is working. Rather than viewing counting as an accounting exercise, treat each variance as evidence about a process that may have failed: an unrecorded transfer, an incorrect issue, material placed in the wrong bin, a return not processed, a unit-of-measure error, or an unidentified container. Repeated comparisons between physical stock and the perpetual record expose the discrepancies that otherwise remain hidden until they cause a shortage.
Count frequency should reflect operational risk rather than applying the same schedule to every item. High-use shared components, expensive parts, materials associated with frequent shortages, and inventory stored across many locations generally deserve more attention than stable low-value items with predictable movement. The plant can also increase counting frequency temporarily after changing location structures, allocation rules, or material-handling processes. The objective is to direct verification effort toward areas where inaccurate information would cause the most disruption.
Location-based counting is particularly valuable in a multi-line environment. Counting every item physically present in one rack, supermarket, production line, or storeroom allows employees to test whether that location is under control, while product-based counting tests whether a specific item is accurately distributed throughout the plant. Using both views can reveal different failure modes. For example, a line-side supermarket may have generally poor transaction discipline even though most plant-level totals remain close to correct.
When discrepancies appear, investigate patterns rather than merely correcting the number. If a fastener is repeatedly missing from Line 3, determine whether operators are consuming from the wrong bin, another department is borrowing material, the standard container quantity is incorrect, or the replenishment process routinely bypasses the expected transaction. A quantity adjustment restores the record only temporarily if the process causing the error remains unchanged. Process auditing similarly focuses on whether defined controls and operating methods are functioning as intended, not simply on whether one isolated result happens to be acceptable.
Cross-team alignment should also extend to ownership. Production may own consumption discipline, material handlers may own transfers and replenishment, receiving may own initial put-away accuracy, quality may own controlled locations, and an inventory or operations leader may own location standards and count policy. Responsibilities should be explicit enough that a discrepancy does not become everyone’s problem and therefore nobody’s responsibility. At the same time, no department should be allowed to create a private version of inventory data that other teams cannot see.
The temptation to maintain shadow spreadsheets is strong when employees distrust the main record. A supervisor may keep a personal list of spare motors, maintenance may track cabinet contents separately, or purchasing may maintain its own estimate of usable stock because plant-level quantities appear unreliable. Those parallel records initially feel safer but eventually create competing versions of reality and additional reconciliation work. A better response is to identify why the shared system is not trusted and correct the underlying location, transaction, or counting problem.
Daily operating reviews can use visual inventory information to encourage this shared ownership. A short discussion might focus on components below their expected line-side level, shared parts concentrated in the wrong production area, emergency transfers made during the previous shift, unreconciled count differences, or materials sitting in staging longer than expected. The purpose is not to review every SKU but to make abnormal conditions visible enough for teams to act. Visual production management is most effective when it supports problem identification and coordinated response.
The same discipline should be applied to production changes. When a new line is commissioned, a product transfers between lines, a supermarket moves, or a storeroom layout changes, update the visual inventory structure as part of the change rather than treating the map as historical documentation. Otherwise, employees will quickly encounter locations that no longer match the floor and will start improvising. The inventory model must remain a representation of current operations if it is expected to guide current decisions.
Training should focus on operational scenarios rather than menus. Employees need to know what to do when they transfer a container, discover an unexpected quantity, find material in the wrong location, borrow stock for another line, return unused parts, or encounter an unidentified item. Scenario-based training connects record accuracy with the situations employees actually face during a shift. This is especially useful when different departments interact with the same shared inventory but perform different types of transactions.
Managers should also avoid creating incentives that undermine accurate records. If production teams are judged only on uninterrupted output, they may view transaction steps as administrative obstacles during a busy shift, while material handlers may prioritise delivery speed without recording each movement. Operational efficiency and inventory accuracy should instead be treated as complementary goals because unreliable location information eventually creates search time, shortages, emergency movements, and duplicated stock. Improving the transaction process is therefore part of improving production flow.
Accuracy becomes self-reinforcing once employees see that the shared inventory view can answer useful questions. If a maintenance technician can find a spare quickly, a supervisor can identify alternative stock before stopping a line, and purchasing can avoid ordering something that already exists elsewhere in the plant, people gain a practical reason to keep location data current. Confidence encourages use, and use encourages greater attention to transaction quality. That cycle is what turns a visual inventory system from a reporting tool into an everyday operating discipline.
How CyberStockroom Supports Multi-Department Parts Visibility
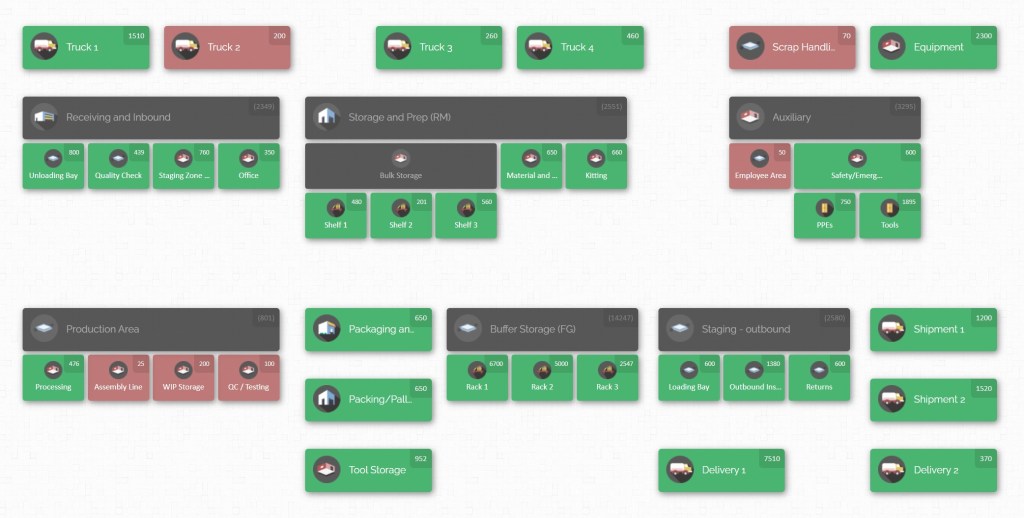
CyberStockroom is particularly relevant to multi-line manufacturing because its inventory model begins with a visual map of physical locations rather than requiring teams to understand the plant primarily through a flat item list. Users can represent real operating spaces as locations and sublocations, including facilities, departments, warehouses, production areas, storerooms, racks, shelves, bins, vehicles, and job sites. That structure mirrors the location hierarchy described earlier in this guide, allowing inventory records to reflect where material physically sits. For a plant with several production lines, the map can therefore provide a common visual language for discussing stock distribution.
The value of that approach becomes clear when inventory is decentralized. A component may exist in central storage, beside Line 1, in the maintenance crib, and inside another production area’s cabinet at the same time, so knowing the total quantity does not tell a user where to look. CyberStockroom allows users to view the contents associated with mapped locations and see quantities connected with those areas. As a result, teams can move from plant-level awareness toward the specific storage points required for operational decisions.
CyberStockroom also supports product-oriented visibility across those locations. Users can search for a product and identify the mapped locations containing it, which is useful when the same part is distributed among departments or production lines. Rather than phoning several areas or walking the floor to ask who has a particular bearing, fitting, fastener, component, or spare, a user can examine its distribution through the inventory map. This capability directly addresses the shared-inventory problem in which plant-wide stock exists but is difficult to locate.
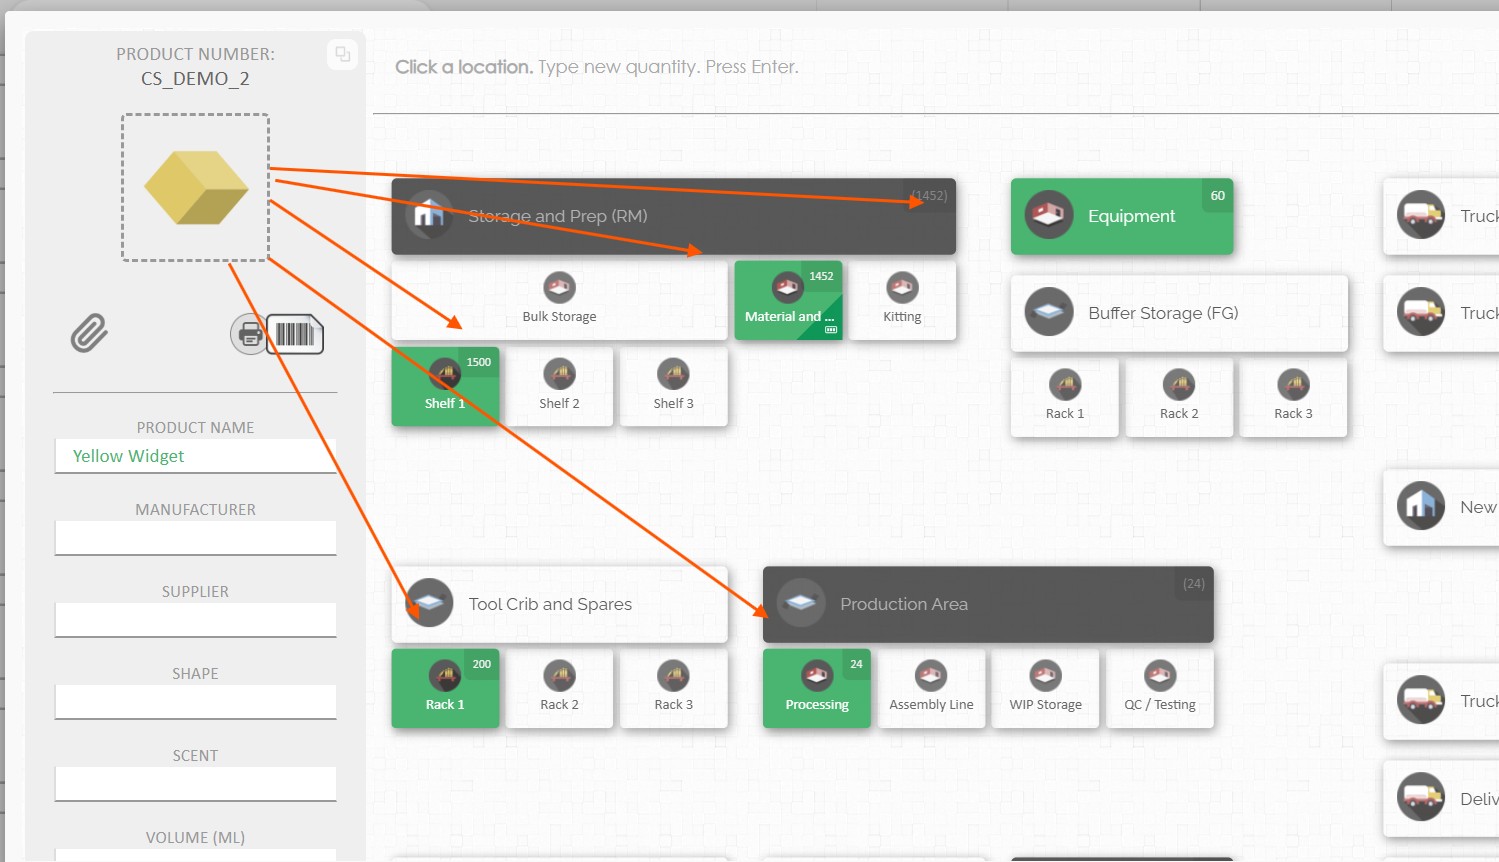
That distribution view can support more informed allocation decisions. Suppose Line 2 is approaching its minimum quantity for a component while the central storeroom appears low; a search may reveal additional stock at Line 1 or another mapped storage area. The production team can then evaluate whether those units are genuinely releasable rather than assuming the item is unavailable and immediately requesting another purchase. The software does not replace the plant’s allocation policy, but it makes the physical distribution required to apply that policy easier to understand.
Transfers are another important part of the model. CyberStockroom supports moving inventory between mapped locations, including drag-and-drop movement within its visual interface, so users can reflect changes to the physical distribution of stock. This is useful when material moves from central stores to a production line, between departmental locations, or from one line-side area to another. Keeping source and destination changes visible helps preserve the location accuracy that multi-line allocation depends on.
Visual mapping also gives organizations flexibility in how they represent the plant. CyberStockroom locations can be nested so a larger facility or department can contain increasingly specific areas beneath it, allowing the structure to follow real-world storage practices rather than forcing every operation into one generic location format. A manufacturer might create a plant, production department, individual line, line-side rack, shelf, and bin hierarchy, while another facility may choose a warehouse, room, cabinet, and shelf structure. The important point is that the map can be organised around the physical environment employees already recognise.

That flexibility should be used carefully. A visual inventory system is most effective when location names and nesting rules remain consistent, so plants should establish their hierarchy before allowing different departments to create overlapping or confusing structures. CyberStockroom provides the mapping mechanism, while the organization remains responsible for deciding how granular each location should be and how employees will use it. In practice, the strongest implementation combines the software’s visual structure with the naming, ownership, counting, and movement rules discussed earlier.
Product images and other identifying information can further reduce confusion when parts are difficult to distinguish by description alone. CyberStockroom allows products to be associated with images and other identifying fields, giving users visual context when searching for inventory. In manufacturing environments where similar components have closely related part numbers or descriptions, an image can support recognition while the formal identifier remains the basis for control. This reinforces the wider principle that visual information should make correct decisions easier without replacing disciplined item identification.
CyberStockroom’s map can also support cycle-counting workflows by giving teams a defined visual structure to work through. Instead of treating the facility as one undifferentiated inventory pool, counters can move through mapped locations and compare recorded quantities with physical stock in each area. When a discrepancy appears, the correction can be associated with a specific location rather than being hidden inside a plant-wide total. This supports the location-level accuracy needed when multiple lines depend on shared inventory.
For multi-department visibility, perhaps the most important benefit is that the map provides a shared reference point. Production can see where components are distributed, maintenance can locate parts within mapped areas, material handlers can understand source and destination locations, and inventory teams can review where stock concentrations or discrepancies are developing. The same physical structure is visible across those conversations, reducing the need to translate between several departmental spreadsheets or informal location names. A common visual representation supports the cross-functional approach that manufacturing improvement methods consistently encourage.
The software is particularly useful when a plant wants its inventory map to resemble the way employees conceptualize the facility. A storeroom manager may think in terms of aisles, racks, and bins, while a production supervisor thinks in terms of lines, work centers, and staging points; both can exist within the same broader location hierarchy. This makes the map useful for conversations that cross departmental boundaries because each group can navigate from the overall facility down to the physical area relevant to its work. The resulting visibility can make inventory allocation discussions more concrete and less dependent on tribal knowledge.
Consider a maintenance part used on several production lines. Without a visual distribution view, the maintenance team might see a low quantity in its own crib and request a replacement purchase even though identical parts exist elsewhere in the facility. With the component mapped across locations, the team can first determine whether another mapped stock point contains usable inventory and coordinate an approved transfer if appropriate. The same principle applies to production components that are temporarily overstocked at one line and urgently needed at another.
CyberStockroom should therefore be positioned within a broader operating system rather than treated as a substitute for process discipline. The map can expose where stock is recorded, but teams still need clear rules for allocation, movement, replenishment, returns, exception handling, and cycle counting. Visual information becomes powerful when employees agree on what each location means and consistently update quantities as physical conditions change. Software supports the shared picture; operating discipline keeps that picture trustworthy.

A practical implementation can begin with one production area rather than attempting to model every storage point simultaneously. Map the central storeroom and two or three production lines that share a meaningful set of components, verify the opening quantities, establish movement rules, and use the resulting view during daily production discussions. Once employees demonstrate that transfers and counts remain accurate, expand the same location logic to maintenance, quality, additional lines, or remote storage areas. This staged approach keeps the focus on operational usefulness rather than simply completing a large data-entry exercise.
The central benefit is straightforward: CyberStockroom enables teams to see inventory in the context of the physical plant. When multiple departments compete for or share the same materials, that context makes it easier to determine where stock is concentrated, which locations need replenishment, and where alternative quantities may exist. Combined with clear allocation rules and accurate movement recording, a visual inventory map can support faster decisions without asking employees to reconstruct the plant from disconnected records. That makes CyberStockroom a practical fit for organizations trying to turn inventory location data into day-to-day manufacturing visibility.
Sustain the System With Metrics, Governance, and Continuous Improvement

Once a visual allocation process is operating, the next risk is gradual deterioration. New storage locations appear, employees create shortcuts, production schedules change, items migrate between lines, and temporary staging areas quietly become permanent inventory points. A system that was accurate at launch can therefore become unreliable within months if nobody owns the underlying standards. Sustaining visibility requires governance that treats inventory locations and movement rules as part of normal manufacturing control.
Assign an owner for the location structure. That person or team should approve new permanent locations, retire obsolete ones, maintain naming standards, and resolve duplicate or ambiguous location definitions. Lean material-handling guidance has similarly recommended controlled ownership of key material-plan data because unrestricted changes can erode data integrity. The goal is not bureaucracy but consistency, particularly when many departments depend on the same information.
At the same time, ownership should not become centralized to the point that operational problems remain invisible. Production, maintenance, material handling, purchasing, receiving, and quality should have clear routes for requesting changes when the physical process no longer matches the mapped structure. For example, if Line 4 receives a permanent point-of-use supermarket, the map should be updated as part of commissioning that area rather than months later. Governance works best when change is controlled but easy to initiate.
Inventory accuracy is one of the most useful performance measures, but it should be analyzed below the plant total. Measure accuracy by location, product group, department, or another operationally meaningful category so teams can identify where errors originate. A plant can have a respectable overall result while one production supermarket remains consistently unreliable, particularly when overages in one location offset shortages in another. Cycle counting provides the repeated physical-versus-record comparison needed to expose those local problems.
Transfer accuracy is another useful measure. Review whether recorded source and destination quantities agree with physical stock after movements, particularly for high-frequency transfers among production lines. A rising number of transfer-related discrepancies may indicate confusing location names, rushed transactions, unclear ownership, or a movement workflow that is too difficult to use during normal production. Tracking the error pattern helps managers improve the process rather than simply increasing counting effort.
Emergency material movements deserve their own attention because they reveal weaknesses in the allocation model. Record how often one production line has to borrow stock from another, which components drive those events, and whether the same locations appear repeatedly. A few exceptional transfers may be normal, but repeated borrowing suggests incorrect min-max levels, poor replenishment timing, unstable consumption assumptions, or unreliable inventory data. In this way, the transfer history becomes evidence for improving future allocation.
Search time can also provide insight even when it is not captured as a formal metric. Employees spending ten minutes looking for a part represent an inventory visibility failure whether or not the system’s total quantity is technically correct. Observe repeated searches, phone calls, messages, or physical walks used to locate material and identify which parts or locations cause the most difficulty. Visual management should reduce the effort required to understand current conditions at the point of work.
Stockouts should be classified by cause rather than counted only as one category. A true supply shortage is different from a part that exists elsewhere in the plant, a component sitting in the wrong location, a quantity lost through unrecorded consumption, or material that is physically present but unavailable for use. These causes require different corrective actions. A multiple production lines inventory allocation visual is particularly valuable for separating “we do not own enough” from “we own it but cannot see or access it where required.”
Review line-side inventory levels as well. Visibility improvements sometimes expose that substantial quantities have accumulated at individual lines because historical shortages encouraged departments to keep local safety stock. Once teams trust the shared map and replenishment process, some of those buffers may no longer be necessary. Reducing unnecessary line-side inventory can free space, make abnormalities easier to see, and return flexible stock to a centrally available pool.
However, inventory reduction should follow improved control rather than precede it. Removing buffers while location accuracy remains poor simply makes the plant more vulnerable to shortages. First establish reliable movement records, cycle-count accuracy, replenishment response, and shared visibility; then evaluate whether excess quantities can be reduced safely. This sequence reflects a broader lean principle: improve flow and expose problems systematically rather than stripping away protection without strengthening the underlying process.
A monthly governance review can examine a compact set of indicators such as inventory accuracy by key location, repeated count discrepancies, emergency transfers, recurring line shortages, inactive or obsolete storage locations, and unusually concentrated shared inventory. The discussion should focus on causes and corrective action rather than creating another reporting ritual. If Line 2 repeatedly runs short while Line 1 returns excess material after each changeover, the solution may be an allocation change rather than simply increasing total inventory. A visual map makes these patterns easier to discuss because participants can connect the data to physical areas they recognize.
Physical audits should periodically test whether the map still matches the facility. Walk selected areas and verify that racks, shelves, bins, production locations, and other mapped stock points exist where the system says they do, that labels remain readable, and that unidentified storage points have not appeared. Process auditing is intended to confirm whether established controls and methods are functioning within defined requirements. Applying that mindset to inventory locations helps prevent the visual model from drifting away from the shop floor.
Continuous improvement should also examine the information flow surrounding inventory. If material handlers receive replenishment requests through verbal messages, handwritten notes, email, and several unrelated boards, the physical stock may be well mapped while replenishment decisions remain fragmented. Value-stream mapping explicitly considers both material movement and information flow because delays or ambiguity in either one can constrain performance. Improving inventory visibility therefore includes simplifying how production communicates material needs across departments.
The same review can identify unnecessary handling. Material may travel from receiving to central stores, from central stores to a supermarket, from the supermarket to temporary staging, and from staging to a line even when some steps add little operational value. Mapping the current state helps teams see where material waits, changes hands, or accumulates between processes. Simplifying those paths reduces opportunities for location records and physical reality to diverge.
As production changes, revisit allocation parameters rather than assuming historical settings remain valid. New products, different batch sizes, faster equipment, changed shifts, altered container quantities, or a new replenishment route can all change how much material each line needs at point of use. A minimum established twelve months earlier may now be either excessive or dangerously low. Regular review keeps allocation aligned with actual consumption and operating rhythm.
Shared components deserve the most frequent review because their distribution affects several areas simultaneously. Ask whether the current split among central stock and individual lines still reflects demand, whether one department consistently holds unused excess, and whether the central reserve remains large enough to respond to schedule changes. If the product distribution is visible on a map, these discussions become easier because the team can see where the physical quantity is concentrated. CyberStockroom’s mapped product-distribution capability can support this type of plant-wide review.
Management behavior is equally important. Leaders should use the shared inventory view when making real decisions rather than asking employees to prepare a separate spreadsheet whenever a shortage occurs. Every time a parallel record becomes the preferred source, confidence in the common system weakens. Using the visual map during production reviews, shortage discussions, count investigations, and allocation decisions demonstrates that accurate location data has operational value.
Over time, the organization should aim for a simple standard: any authorized employee looking at the inventory view should be able to understand where a critical part is expected to be and which location holds the quantity needed for the next decision. Achieving that standard requires accurate opening data, disciplined movements, recurring counts, controlled location structures, and cross-functional ownership. No individual measure guarantees visibility, but together they create a system in which the digital picture and physical plant remain closely aligned.
From Inventory Visibility to Dependable Production Flow

Managing multiple production lines effectively depends on seeing inventory as a flow of physical material rather than a collection of totals. Production interruptions often begin when that flow becomes invisible: components have moved without records, shared stock is concentrated at one line, staged material is mistaken for unrestricted inventory, or departments maintain different assumptions about what is available. A visual, location-based approach gives teams a way to connect stock quantities with the places and production activities that give those quantities meaning. That connection is the foundation of dependable allocation.
The most effective process begins with the physical plant. Map the warehouses, storerooms, departments, production lines, supermarkets, racks, shelves, bins, staging locations, and other stock points that genuinely matter to daily operations, then verify the inventory associated with them. Manufacturing improvement methods consistently emphasize understanding current material and information flows before designing the future state. Once the map matches reality, teams can establish allocation rules from a much stronger starting point.
From there, allocate shared inventory according to consumption, production timing, replenishment capability, and operating priority rather than relying on equal splits or historical habit. Keep a sensible central reserve when flexibility is valuable, define minimum and maximum line-side quantities, and treat transfers as controlled movements from one named location to another. This approach preserves enough context to distinguish stock that is centrally available from stock already positioned for a production requirement. The result is a clearer picture of what each line can actually use.
Accuracy then becomes an everyday responsibility. Receiving, transfers, issues, returns, adjustments, and relocations should update the shared inventory picture as close as practical to the physical event, while recurring cycle counts test whether that discipline is working. When differences appear, investigate the process that created them rather than simply correcting the quantity. Repeated physical-versus-record comparison is what keeps inventory information dependable over time.
Cross-team visibility is what converts that accuracy into operational value. Production can see alternative stock before escalating a shortage, maintenance can locate shared spares, material handlers can understand where replenishment is required, and purchasing can make decisions with a clearer view of plant-wide quantities. NIST manufacturing guidance on value-stream mapping emphasizes cross-functional participation because material and information problems rarely belong to only one department. Inventory visibility should follow the same principle.
A multiple production lines inventory allocation visual is especially useful because it turns an abstract planning problem into something employees can understand in the context of the facility. Instead of asking whether the plant owns 500 units, teams can see that 200 are at Line A, 100 are at Line B, 50 are at Line C, and 150 remain in central storage. That picture immediately supports better questions about replenishment, reserves, transfers, and upcoming production. Visual control therefore becomes a practical decision tool rather than simply an inventory presentation.
CyberStockroom supports this approach by allowing organizations to represent inventory through visual locations and sublocations, view quantities within those locations, search for products across the map, examine how items are distributed, and move stock between defined locations. Those capabilities align closely with the operating requirements of multi-department inventory visibility because they preserve the connection between an item and its physical position in the plant. Used with consistent naming, disciplined transactions, and recurring verification, the map can become a shared reference for production and inventory teams.
The larger objective is not to put every part on a screen. It is to reduce the uncertainty that causes production employees to search, supervisors to hoard, material handlers to make emergency moves, and buyers to order inventory that may already exist elsewhere. When teams can answer what they have, how much they have, where it is, and whether it is available, many of those defensive behaviors become less necessary. Better visibility creates the conditions for better inventory decisions.
For manufacturers running several production lines, that improvement can have effects far beyond the storeroom. Visual management has been used in manufacturing improvement efforts to strengthen inventory control, workflow accuracy, and production flow, while shared visibility supports coordination across forecasting, operations planning, and inventory management. These outcomes reinforce the idea that inventory visibility is not an isolated warehouse initiative. It is part of the operating system that keeps material moving to the right place at the right time.
The strongest plants therefore treat inventory location accuracy with the same seriousness they apply to production routing or work-center status. When a component moves, the shared picture moves with it; when a new production area opens, the inventory structure changes with the floor; when a count exposes a discrepancy, the underlying process is examined. This discipline keeps the visual model connected to physical reality instead of allowing it to become another historical database. As a result, inventory information remains useful precisely when production pressure is highest.
Managing multiple production lines ultimately comes down to creating one dependable version of where material is and how it should be used. A well-designed location structure provides the framework, consumption-based allocation determines how stock should be distributed, disciplined movements preserve accuracy, cycle counts verify the result, and cross-functional governance keeps the system relevant as the plant changes. A visual inventory platform such as CyberStockroom can make that operating model far easier to understand by giving teams a shared representation of stock across departments and production areas. When visibility, accuracy, and allocation are managed together, inventory becomes easier to control and production teams can spend less time searching for material and more time keeping work moving.








Leave a Reply