
Managing multiple job site containers and dispersed parts across departments is a daunting task without a clear system. For example, using a visual inventory management approach that maps each container, rack, and tool location can significantly improve visibility and control. Construction and manufacturing teams often rely on job site storage containers (conex boxes) and warehouse stockrooms to house tools, fasteners, and spare parts. When inventory data is scattered across spreadsheets or siloed systems, teams waste time searching for items and risk costly project delays. A modern solution is a visual inventory map: an interactive diagram of your site’s storage layout, allowing teams to pinpoint every part.
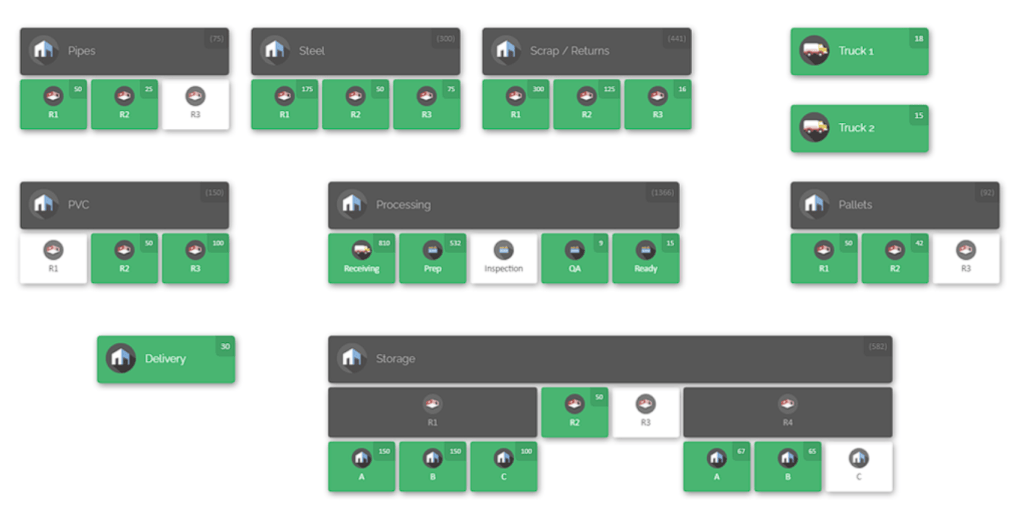
A visual map can display every container, rack, or truck location as a clickable zone. Labels and counts on each zone show current stock levels. By clicking into a container on the map, a manager can instantly see the exact contents – for example, how many drills, screws, or safety kits it holds. In this demo map, each “Conex” container (shipping crate) on site is drawn to scale and annotated with live item totals. Instead of hunting through notebooks or calling supervisors, workers consult the map to find parts instantly, saving time and avoiding errors.
The Challenge of Dispersed Inventory
In a large manufacturing or construction operation, inventory often lives in many places: central warehouses, machine shops, field offices, and on-site containers. Each department – maintenance, production, electrical, or fabrication – may draw from the same pool of parts. Without a unified system, this leads to hidden stock, over-ordering, and confusion. For example, if one department takes bearings from a container and does not update the system, other teams might not know those parts are gone and could end up ordering duplicates.
These gaps hurt operational efficiency and accuracy. Teams can waste hours locating missing parts or verifying quantities. Project timelines slip when crews cannot find the components they need on time. Warehouse managers can’t plan purchasing properly because they don’t have real-time data. In short, poor parts visibility across multiple job site containers means waste, idle labour, and budget overruns. The goal is to give every team member – from the warehouse clerk to the field foreman – a clear, single source of truth about what is on hand and where it is located.
Best Practices for Full Parts Visibility

To improve parts visibility and inventory accuracy, organisations should adopt several best practices. These practices focus on coordination and transparency so that everyone works from the same information. Key steps include:
- Centralize Inventory Data: Use a single inventory management platform for all locations. Replace disconnected spreadsheets and departmental lists with one unified database or cloud system that covers every site and department. When one team updates a count or moves inventory, the change is visible to all immediately. This central source of truth prevents blind spots. For example, if a maintenance crew logs on a mobile device that they have issued 20 filter cartridges, every department sees that change in real time and avoids duplicate orders.
- Implement Real-Time Tracking: Adopt barcode scanning for parts and locations. Whenever inventory arrives, is transferred, or is consumed, scan it to update the system immediately. This practice keeps data fresh and accurate. For instance, when a truck delivers plumbing fittings to Site B, crews scan the pallets into that container’s stock. Everyone sees the delivered quantities in the central system the moment the scan is done. Real-time updates eliminate guessing games – you always know exactly how much stock is available.
- Map All Locations and Containers: Digitally map each storage container, warehouse aisle, bin, or vehicle as a distinct location in the system. The interactive map should include every job site container and yard zone. Label each one clearly – e.g. “Site 5 – Container A (Electrical Spares)” or “Warehouse – Rack B3 – Shelf 2.” When all locations are mapped and tagged, the system knows where every item belongs. This visual blueprint means someone can scan an item and immediately put it on the correct container or shelf without confusion.
- Standardize Part Identification: Assign a unique SKU or part number to every item and attach barcode labels to parts, storage bins, and containers. Consistency is key: the same part number should be used by every department. Standard labelling makes training easy and reduces errors. For example, when a screwdriver is labeled “S000123” and is scanned upon receiving or issuance, the system instantly updates the count for that SKU. This uniform approach prevents mix-ups where different teams might have used different names for the same part.
- Routine Cycle Counts and Audits: Schedule regular checks of inventory. Instead of waiting for problems to appear, carry out cycle counting on a rotating basis. For example, count high-value or fast-moving items weekly and slower-moving parts monthly. During a count, compare the physical quantity in a container against the system record. If you find discrepancies, investigate immediately. Perhaps someone forgot to scan a transfer during a rush, or an item rolled under a pallet. Catching these errors early ensures data stays accurate and uncovers process issues quickly.
- Define Clear Workflows: Establish standard operating procedures for every inventory transaction. For example, have a receiving process that requires scanning goods into the system before shelving, and an issuing process that requires scanning when items are checked out to a crew. Document each step clearly: who inspects, who logs, and who approves. Make it part of the culture that no part moves without being recorded. When workflows are consistent, you prevent “rogue” actions that leave items off the radar.
- Organise Inside Each Container: Within every container or rack, group related parts together and label internal bins or shelves. For example, dedicate one shelf to fasteners and another to tools. Clear internal organisation and signage help workers find items quickly and keep track of where things belong. Periodically review and tidy contents so that misplaced items don’t degrade accuracy. Well-organised containers mean faster picks and simpler audits.
- Encourage Cross-Team Collaboration: Foster a culture where all departments use the shared inventory system. Grant access to relevant personnel so that maintenance technicians, purchasing agents, and site supervisors can all view stock levels. With everyone seeing the same data, communication improves. If the production team forecasts needing extra motors, maintenance can check the inventory map of containers for leftovers before placing a new order. Similarly, if one site has surplus components, another site can borrow the stock, avoiding waste.
- Use Inventory Metrics: Track key performance indicators like stockout frequency, fill rate, and inventory accuracy. For instance, measure how often a container runs completely empty on critical parts, or how many times inventory counts are adjusted. Reviewing these metrics highlights which parts or processes need attention. If one site’s container frequently faces shortages, you may raise its safety stock level or improve its resupply process. Regularly analysing data keeps the operation efficient and drives continuous improvement.
Combining these best practices lays the groundwork for reliable parts visibility. The next step is to put these principles into action through a visual inventory management platform. A map-driven solution can make these steps intuitive and consistent across your entire operation.
Building a Visual Inventory Map

A critical part of managing multiple containers is visualizing their locations. An inventory map is like a real-time blueprint of your storage footprint. Each container or storage area is represented by a box or icon on the map. For example, you might draw Site A with several labeled containers (“Container A – Supplies”, “Container B – Tools”) and warehouse racks (“Rack 1 – Bearings”, “Rack 2 – Belts”). Each map location holds data on what it contains. This approach turns inventory from abstract tables into a clear, user-friendly visual layout.
To build an effective inventory map:
- Outline Primary Zones: Start by mapping high-level areas. Identify major regions such as “Main Warehouse”, “Site 1 Yard”, “Site 2 Crane Bay”, etc. These top-level zones help orient the map. Within each area, you will drill down to specific containers or shelves.
- Add Each Container and Sub-Location: Within a zone, add every physical container, truck bed, shelf, or bin. If you have multiple conex boxes on a site, represent each one separately. A good practice is to break down large units into sub-locations. For instance, if a container has multiple shelves, create sub-items on the map for each shelf level or bin. This way you track inventory precisely rather than lumping everything together.
- Label with Context: Give every location a descriptive name. Instead of “Bin 12,” use something like “Site B – East Conex (Electrical Spare Parts)”. Include project or site identifiers, and function if relevant. Consistent naming helps team members quickly identify where they are and what that location holds.
- Group by Workflow or Department: Reflect how teams use space. If electricians tend to use two containers while plumbers use others, group them or colour-code them accordingly. This way, the map clearly shows each trade’s area. Team-specific mapping supports accountability – each crew sees exactly which containers they manage.
- Include the Warehouse and Yard: Don’t limit the map to just field sites. Map your central warehouse aisles, racks, bins, and open yard areas as part of the same layout. For example, mark “Main Warehouse – Aisle 5 – Bin C3” or “Yard Zone 2 – Scaffolding”. Including all locations ensures that site-to-warehouse transfers are visible in one view.
- Account for Mobility: Some teams even map vehicles or crew as locations. A delivery truck or service van carrying parts can be a node on the map. Each container truck could be listed as “Truck 7 – Tools”. Likewise, a crew leader might have an entry to record the tools they have issued. When inventory moves into these mobile locations, the map tracks it there.
Mapping your operation visually yields big benefits. Teams orient themselves easily: a new employee on site can click the map to find the “Hammer Storage” container rather than asking around. Managers can instantly assess stock distribution: a glance shows which container is low on nails, or which site has extra bolts. The map becomes the dashboard for inventory decisions and actions, increasing transparency and speed.
CyberStockroom: A Map-Based Inventory Solution
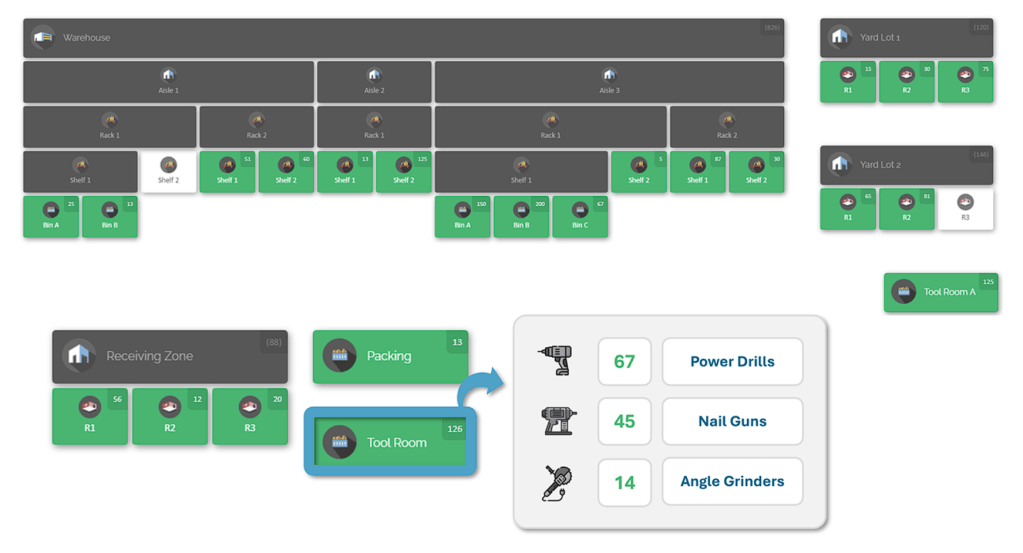
Putting the above practices into play requires a flexible tool. CyberStockroom provides a cloud-based, map-centric inventory platform built for multi-site visibility. Here’s how it brings the theory into practice in real operational terms:
- Interactive Inventory Maps: You can create custom maps for each site and warehouse. Each container, rack or zone is a location on the map. These are completely configurable: place and name them exactly as they appear on the ground. The interface shows item counts on each map block. Users navigate the same shared map.
- Drag-and-Drop Transfers: CyberStockroom’s core is moving parts visually. To transfer inventory, you simply drag the item icon from one map location to another. For example, if a maintenance crew needs parts from a warehouse shelf to bring to a job site container, a user can drag that part’s icon on the map from “Warehouse Bay A” to “Site B – Container 1”. This action automatically updates the quantities in both locations and logs the transfer. The visual action mirrors the physical workflow and reduces data entry errors. This direct drag-and-drop approach makes transferring stock intuitive for any user.

- Real-Time Updates: Every scan or drag action updates live for all users. As soon as someone checks in supplies to a container, the map’s display changes for everyone. If a foreman scans parts into a truck’s inventory, a warehouse manager in the office sees that change instantly. There is no lag or syncing needed – the cloud infrastructure keeps all locations in sync at all times.
- Full Audit Trails: Every inventory action is logged with date, time, and user. The system maintains a complete history of who moved which parts and when. This audit trail is invaluable for accountability and problem solving. For example, if a high-value tool is missing, you can check who last recorded it on the map. Regular audits become simpler too: you can run reports to see when inventory was last verified and target those areas.
- Custom Fields and Attachments: To add context, you can attach images or documents to map locations or items. For example, a container location can have an attached floor plan or list of typical contents. Critical manuals or safety data sheets can be linked to relevant parts. Team members tapping the location icon in the system will immediately see these attachments, ensuring crucial information is always at hand.

By consolidating all sites on an interactive map, CyberStockroom makes inventory visible in a way spreadsheets never could. Teams stop working in their own bubbles: a planner can see exactly what a technician on site checked out, and operations can reroute parts digitally rather than physically locating them. The platform ties together the workflows described earlier, making the whole process smooth and intuitive.
Implementation Steps
Putting it all together, here is a step-by-step approach to get up and running:
- Audit Existing Inventory: Perform an initial count of items in all containers and locations. Update the central system so the starting numbers are correct. This baseline ensures the map will reflect real stock from day one.
- Define and Label Locations: Make a comprehensive list of every container, bin, rack, and vehicle to be tracked. Assign each a unique label. In the software, create these as locations and arrange them on the interactive map. Physically tag each container with a label matching the system’s name.
- Import or Enter Inventory: Use a CSV import tool or manual entry to load current item quantities into the system under their mapped locations. Alternatively, scan items directly into the system by site, verifying one zone at a time. Accuracy here is crucial: it’s the foundation of trust in the data.
- Configure Users and Roles: Set up user accounts for managers, warehouse staff, and field teams. Assign permissions according to roles (who can move stock, who can view, etc.). Ensure key stakeholders have access to the map view they need.
- Train Your Team: Run training sessions on the new inventory procedures and map interface. Provide step-by-step job aids: how to scan in a received part, how to transfer between containers, and how to read the map dashboard. Make sure everyone understands that all movements must be recorded.
- Go Live and Observe: Once the system is live, closely monitor its use. Watch for errors like missed scans or incorrect transfers. Provide quick assistance to fix mistakes and adjust processes. If teams find the map layout or labelling confusing, revise it. Clear communication and support are vital in these early days.
- Enforce Routine Checks: Integrate cycle counting and stock reviews into daily or weekly tasks using the new system. For example, assign one team member to verify counts in a container every Monday. When discrepancies are found, investigate and correct them immediately. Consistency in checking maintains accuracy and builds trust.
- Scale and Refine: After the initial rollout, gradually add secondary locations and more complex items. Keep iterating on the map as projects change. If a new job site opens, set up its containers on the map right away. Use the data you gather (trends, issues) to further refine reorder points and storage layouts.
- Review Performance: Use built-in reports and analytics to measure results. Track metrics like stockouts, inventory turns, and task completion times. Celebrate improvements (for instance, note how much time was saved this quarter). Continuous review and optimisation will keep the system effective as your operation grows.
By following these steps, your organisation can transform its parts management into a proactive, visible system. The workload of inventory checks drops, and teams gain confidence that the inventory picture is complete and current.
Benefits and Impact

Implementing a visual inventory system for multiple job site containers delivers significant improvements:
- Operational Efficiency: Teams spend less time searching for parts or reconciling stock levels. A field technician can instantly locate the right connector on a map, rather than hunting through dusty boxes. Inventory tasks like picking or restocking become more straightforward. Time spent on manual counts or lookups drops sharply, allowing staff to focus on project work.
- Improved Accuracy: With standardised scans and audit routines, the gap between recorded stock and actual stock narrows. Stock counts stay accurate, which means procurement and scheduling decisions are based on reality. Over time, inventory carrying costs fall because fewer spare parts are stored “just in case.” You keep the correct amount on hand without hoarding.
- Cross-Team Alignment: All departments – operations, procurement, maintenance – share one inventory picture. Miscommunications decline because everyone references the same map. For example, if the production team needs an urgent tool kit, the warehouse manager sees that update immediately on the map and can prioritise delivery. This transparency fosters accountability: every move is logged and visible, so teams coordinate rather than working in silos.
- Cost Savings: Reduced lost time and lower excess inventory carry costs produce savings. You avoid buying unnecessary spares and cut down on rush shipments. Early adopters of these practices often see fewer expedited orders because shortages are caught in advance. Ultimately, better visibility turns into lower expenses.
- Scalability and Clarity: Adding new sites or containers is easy: just drag another icon onto the map. The visual map scales up without losing clarity. Even as your operation grows, the interface remains intuitive, keeping all teams on the same page.
- Data-Driven Insights: Having all inventory data in one system enables powerful insights. You can analyse usage patterns, spot slow-moving parts, and plan more effectively. For example, a dashboard might reveal that electrical supplies at Site C deplete faster than expected, prompting a change in reorder policy. This level of insight was impossible with fragmented tracking.
In combination, these outcomes mean that managing multiple job site containers is no longer guesswork. A map-based, visual inventory approach turns scattered stock into an organised, efficient and transparent operation. Teams get real-time answers about “what we have, where it is, and who’s using it.” By following the guidelines above and using the right tools, organisations transform their inventory process and unlock leaner, smarter operations.
Visual Inventory in Action
Consider a mid-size industrial company that operates across multiple sites with separate storage containers for parts. Before switching to a map-based system, each maintenance crew kept its own list of items, and stock discrepancies were common. After implementing a visual inventory platform, the company created maps for two major sites and their warehouses. Within weeks they gained concrete benefits:
- They discovered duplicate stock of critical parts at different sites. For instance, each site had independently ordered its own supply of bearings even though one container already had excess. By centralising visibility on one map, they reallocated parts efficiently and avoided unnecessary purchases.
- Technicians no longer wasted hours searching for hidden items. The map allowed them to locate replacement drills, filters or sensors at a glance. As a result, downtime fell significantly: machines were repaired faster because crews could send required parts from the correct container immediately.
- Inventory accuracy improved dramatically. Since all check-ins and transfers were logged in real time, the data on the map became a reliable reference. The organisation was then able to optimise its reorder levels: parts that had been frequently running low were identified, preventing future stockouts, while surplus items were spotted and consumption was reduced.
- Collaboration between sites got smoother. For example, when Site A needed a specific gasket, the planner saw on the map that Site B had a full container of that part. Instead of waiting for a new order, the gasket was transferred from Site B, saving time and money.
In this scenario, mapping the inventory turned a chaotic, reactive process into a proactive one. The company found that a visual inventory system quickly paid for itself by avoiding project delays and reducing excess inventory.
Conclusion
Managing inventory across multiple job sites and containers demands clear visibility and coordination. By centralising data and using a map-driven inventory system, teams gain an immediate view of all parts and storage areas – turning uncertainty into control. With these best practices and the right platform, operations become leaner and faster: tools and parts are easier to find, stockouts and overstocking become rare, and communication among departments improves. A visual inventory solution unites everyone around one source of truth, enabling better planning and execution. The result is fewer delays, lower costs, and a much smoother workflow. Organisations that adopt this approach achieve true parts visibility, ultimately helping their entire operation run faster, leaner and smarter.








Leave a comment