
For most industrial construction, manufacturing, and field operations teams, the inventory system began as a spreadsheet. Someone built a workbook to track pipe fittings, spare bearings, electrical components, or fasteners, and it worked well enough that the file spread across the company. Years later, that same workbook often holds tens of thousands of rows and is maintained by several people with different habits. The question of spreadsheets vs. inventory software usually comes up only after something goes wrong, such as a crew waiting on a part that the file said was on the shelf.
The difficulty is that the cost of Excel rarely shows up as a line item. A spreadsheet has no license fee, so it looks free on paper, while the real expenses are spread across labor hours, expedited freight, duplicate purchases, idle crews, and avoidable arguments between departments. In practice, these costs are absorbed into daily operations and attributed to other causes, such as a busy week or a supplier delay. As a result, many organizations pay for their spreadsheets many times over without ever seeing the invoice.
This article walks through the true cost of managing inventory in Excel, explains why those costs multiply when several departments depend on the same data, and describes best practices for improving inventory visibility. It also shows where a purpose-built tool such as CyberStockroom fits into the picture, and when a spreadsheet is still the right answer. Whether you manage a manufacturing floor, a construction project, or a maintenance storeroom, the goal is the same: give every team an accurate, shared understanding of what you have and where it is. Building on that goal, let’s start with a look at how spreadsheets became the default in the first place.
CyberStockroom Inventory Demo Map
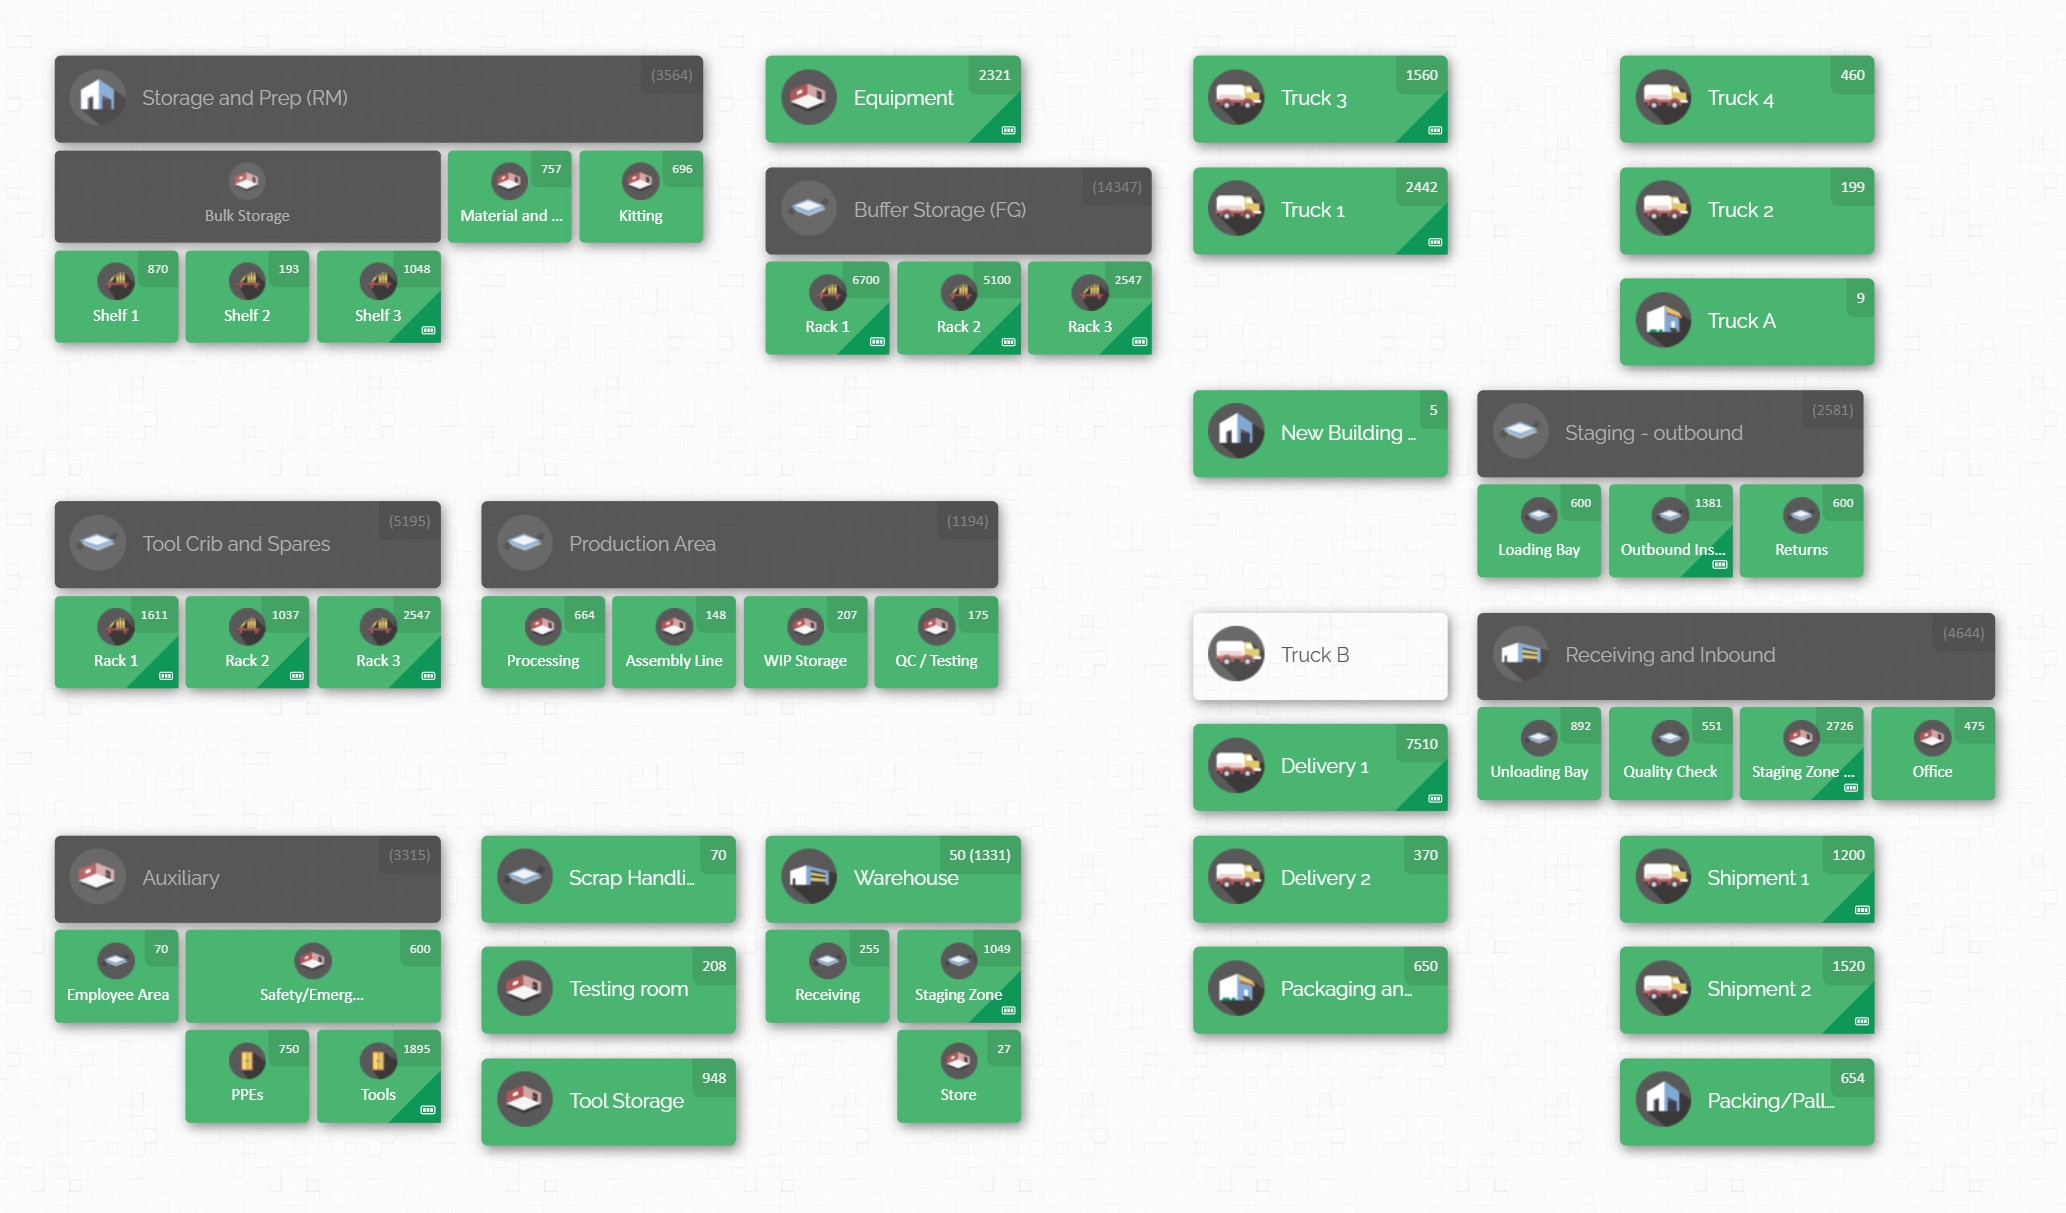
Before going deeper into the comparison, it helps to see what a location-based approach to inventory looks like. The demo above shows a sample inventory laid out on a map, so you can see how parts, materials, and equipment appear in the places where they physically sit. Instead of scanning rows for a bin code and then trying to picture where that bin is, you look at the space itself. This is especially useful for anyone who has ever tried to explain a storage location to a coworker over the phone.
As you read the rest of this article, keep the demo in mind as a reference point. Each cost and best practice we discuss can be tested against a simple question: how quickly could a purchasing agent, a maintenance planner, and a project manager all arrive at the same answer about a part? In a spreadsheet, that answer depends on which version of the file each person opened and how recently someone updated it. On a shared inventory map, the answer is visible to everyone at once, which is the central idea behind the rest of this discussion.
Why Excel Became the Default Inventory Tool

Excel became the default for good reasons, and understanding those reasons makes it easier to see when the tool stops serving you. Nearly every office worker already knows how to open a workbook, sort a column, and apply a filter, so there is no training burden and no procurement process. A foreman or storeroom lead can create a working inventory list in an afternoon, which is exactly how most spreadsheets are born. In practice, the speed of getting started is the main reason spreadsheets spread so widely in industrial settings.
Excel is also flexible in ways that early-stage inventory work demands. You can add a column for supplier, another for heat number, and a third for the shelf or rack, and nobody has to ask permission or wait for a software configuration. This flexibility is valuable when a small team is still working out what it needs to track. However, the same flexibility becomes a liability as more people edit the file, because every person is free to invent their own conventions for naming, abbreviations, and units.
Finally, spreadsheets persist because switching away from them feels risky and time consuming. The workbook contains years of institutional knowledge, including notes, color coding, and private formulas that only one or two people fully understand. Teams worry that moving to inventory software means retyping everything and disrupting operations during a busy season. These concerns are legitimate, and they are the reason a thoughtful transition plan matters, a subject we will return to later. First, though, it is worth being fair about what spreadsheets actually do well.
What Spreadsheets Do Well
A fair comparison of spreadsheets vs. inventory software begins by acknowledging the strengths of Excel. For a small operation with a few hundred items, one person responsible for updates, and a single storage location, a spreadsheet can be perfectly adequate. It is easy to search, easy to print, and easy to share with a supplier by email. When the inventory is small and the number of people touching it is smaller, the weaknesses we will discuss simply do not have room to appear.
Spreadsheets are also excellent for analysis and one-off calculations. A purchasing analyst can pivot a list of parts by supplier, build a quick cost projection, or compare usage across months without waiting on anyone else. These analytical strengths matter because inventory data often needs to be reshaped for budgeting or planning conversations. In practice, many organizations that adopt inventory software still use Excel alongside it for exactly this purpose.
The problem is not that Excel is a bad tool but that it is a general-purpose tool being asked to do a specialized job. Inventory management involves physical space, many contributors, frequent changes, and the need for a trustworthy shared answer. Spreadsheets handle the first of these poorly and the others only with heavy manual discipline. With that in mind, the next section breaks down where the hidden costs actually accumulate.
Where the Real Cost of Excel Hides

The cost of Excel is best understood as a set of recurring friction points rather than a single expense. Each one is small enough to be dismissed in isolation, yet together they consume a meaningful share of operating budgets. Industry consultants often find that teams underestimate these costs because they never measure them directly. The following subsections examine the six most common categories, beginning with the one that affects the most people every day.
Because these costs compound, the order in which you address them matters less than recognizing that they exist. A team that fixes only search time but ignores accuracy will still make bad purchasing decisions. Likewise, a team that cleans up its data but leaves version control unresolved will watch the cleanup erode within weeks. Keeping that interconnection in mind will help as we move through each category.
The Labor Cost of Searching and Reconciling
The most visible cost of a spreadsheet is the time people spend finding things. A technician who needs a replacement valve opens the workbook, filters by description, scrolls through near-duplicate entries, and then walks to the storage area to confirm that the part is where the file claims. If the entry is wrong, the technician repeats the process, often asking a coworker for help. Each trip may cost only ten or fifteen minutes, but multiplied by dozens of requests per week, it becomes a substantial labor expense.
Reconciliation adds a second layer of labor that is easy to overlook. Someone has to compare the spreadsheet against what is physically on the shelves, correct the discrepancies, and send the updated file to the people who need it. In many organizations this is a weekly or monthly chore that falls to a storeroom lead or an administrative employee. As a result, skilled people spend hours on data cleanup that could have gone toward planning, safety, or production.
The Cost of Inaccurate Counts
Inaccurate counts are the quiet center of most spreadsheet problems. A workbook is only as accurate as the last person who updated it, and updates depend on memory and discipline during busy shifts. When a crew pulls ten fittings and forgets to adjust the quantity, the file now overstates what is available. The next person who plans a job around that number discovers the shortage only when the work is already underway.
The financial consequences go in both directions. Overstated quantities lead to stockouts and emergency orders, while understated quantities lead to unnecessary purchases and shelves cluttered with surplus. In an environment where a single specialized component can cost thousands of dollars, even a handful of these errors each year can outweigh the price of dedicated software. Moreover, inaccurate counts erode trust, and once people stop believing the spreadsheet, they stop using it, which creates its own set of problems.
Version Control and Duplicate Files
Version control is where spreadsheets most clearly show their limits in a multi-person environment. A workbook gets emailed, saved to a personal desktop, copied to a shared drive, and renamed with suffixes like “final” or “v3 revised.” Before long, three departments are working from three different files, each partly right and partly wrong. In practice, no one can say with confidence which version is current.
This fragmentation has a direct operational cost. A maintenance planner reserves a part using one file while a project engineer allocates the same part using another, and the conflict surfaces only when both crews arrive at the shelf. Even shared cloud workbooks do not fully solve the problem, because simultaneous edits, accidental overwrites, and sorting mistakes can quietly corrupt rows. The result is a layer of confusion that slows decisions and encourages people to keep private copies as a hedge.
Single-Person Dependency and Knowledge Loss
Many spreadsheets depend on one person who built the file and understands its quirks. That person knows which tab holds the older stock, which abbreviation means a particular fitting, and which rows should be ignored. When they take a vacation, change roles, or leave the company, the knowledge goes with them. Teams are then left with a file that nobody fully trusts and that nobody dares to restructure.
The cost of this dependency is difficult to quantify until it occurs, which is precisely why it is so often ignored. Onboarding a replacement can take weeks, and during that period inventory decisions are made on partial information. In operations where parts availability directly affects schedules, even a short period of uncertainty can lead to delays. Reducing reliance on individual memory is therefore one of the strongest arguments for moving to a system where location and stock information is visible to everyone.
Duplicate Purchases and Expedited Freight
When teams cannot find a part, they buy another one. This is one of the most direct and expensive consequences of poor inventory visibility, and it happens constantly in organizations that rely on spreadsheets. A purchasing agent receives an urgent request, checks the file, sees nothing reliable, and places an order. Weeks later, someone discovers the original part sitting on a rack in another building or storage area.
Expedited freight compounds the loss. When a crew is waiting and the spreadsheet cannot confirm a local supply, the quickest solution is to pay for rush shipping on a replacement. Over a year, premium freight charges and duplicate stock can add up to a figure that rivals the annual cost of purpose-built software. In practice, the money disappears into individual purchase orders and is never traced back to its root cause, which is the lack of a dependable shared view.
Downtime, Idle Crews, and Schedule Slippage
The most expensive cost of all is the time lost when work stops because a part cannot be found. In manufacturing, a line waiting on a component pays for idle labor and delayed output. In industrial construction, a crew waiting on materials pays for standby time, and the delay can cascade into later phases of the schedule. These costs dwarf the price of any software, yet they are rarely linked back to inventory management.
What makes this category particularly frustrating is that the part is often on site. It simply cannot be located quickly or confirmed with confidence, so the crew waits while someone searches. In practice, the time between recognizing a need and physically holding the part is the number that matters most. Anything that shortens that interval, such as knowing exactly where an item sits, has a measurable effect on productivity.
A Worked Example: Putting a Price on Spreadsheet Friction

Abstract discussion only goes so far, so consider a hypothetical mid-sized fabrication and maintenance operation with three departments sharing one inventory file. Suppose that on an average week, ten employees each spend forty-five minutes searching for or confirming parts, and one administrative employee spends four hours reconciling the file. If the blended labor rate is around forty dollars per hour, that adds up to roughly two thousand dollars per month before any other cost is counted. Over a year, the labor of searching and reconciling alone approaches twenty-five thousand dollars.
Now layer on the other categories. Assume a handful of duplicate purchases each quarter, a few expedited shipments each month, and several hours of crew idle time every few weeks while a part is hunted down. Even with conservative estimates, the annual cost of these events can exceed the labor figure. The exact numbers will differ for every organization, but the pattern holds: the visible cost of the spreadsheet is zero, while the invisible cost is substantial.
To estimate your own figure, it helps to gather a few simple data points from the past year. Consider collecting the following:
- The number of times a part was bought that you later discovered you already owned
- The number of expedited shipments caused by a missing or unconfirmed part
- The hours per week staff spend searching for, counting, or correcting inventory records
- The hours of crew or production downtime attributed to waiting on materials
Once you have rough answers, multiply each by an average cost and add them together. This exercise is rarely precise, but it nearly always reveals that the true cost of Excel is far larger than anyone assumed. Having established that number, we can turn to the structural reasons these costs grow when more than one department is involved.
Why Spreadsheets Break Down Across Departments
A spreadsheet that works for one team often fails when several teams depend on it. Each department has a different relationship with inventory: purchasing cares about quantities and reorder timing, maintenance cares about critical spares, operations cares about availability for the next job, and warehouse staff care about physical organization. A single flat table struggles to serve all of these perspectives at once. As a result, departments create their own private lists, and the organization ends up with several partial views instead of one complete one.
The second structural problem is that spreadsheets describe items but not space. A row can say that a part is in “Bay 4, Rack C, Shelf 2,” but it cannot show how Bay 4 relates to the rest of the facility or how far a technician must walk to reach it. When inventory is spread across multiple buildings, storage areas, and outdoor locations, text-based location codes become increasingly abstract. In practice, only the person who created the codes truly understands them, which reinforces the single-person dependency discussed earlier.
Finally, cross-team alignment suffers because nobody can tell whether the data is current. A project manager looking at a spreadsheet cannot distinguish between a number updated this morning and one that has been wrong for a month. This uncertainty causes teams to double-check with each other by phone, message, or physical inspection, and those verification steps consume time and goodwill. Resolving the problem requires a shared source of truth, which brings us to a direct comparison of the two approaches.
Spreadsheets vs. Inventory Software: A Practical Comparison
When comparing spreadsheets vs. inventory software, the most useful lens is not feature count but the problems each approach solves. Spreadsheets excel at flexible calculation and quick setup, while inventory software excels at keeping many people aligned around one dependable record. In a low-volume, single-user situation, the spreadsheet wins on simplicity. As the number of items, locations, and contributors grows, the balance shifts decisively toward a purpose-built system.
Consider the dimension of findability. In a spreadsheet, finding a part means searching text and interpreting a location code. In location-based inventory software, finding a part means seeing it on a map and understanding immediately where to go. This difference may seem cosmetic, but for a new employee or a crew member from another department, it can mean the difference between a thirty-second retrieval and a thirty-minute search.
Consider also the dimension of shared understanding. A spreadsheet requires everyone to open the right file and trust that it is current, while inventory software gives everyone the same view by design. That shared view reduces the duplicate files, the private copies, and the verification calls that spreadsheets encourage. With this contrast in place, we can turn to the best practices that improve inventory visibility regardless of which tool you use, and then to how software makes them easier to sustain.
Best Practices for Improving Inventory Visibility Across Departments

Inventory visibility is not simply a matter of owning the right tool. It is a combination of structure, habits, and shared agreements that determine whether everyone sees the same reality. Teams that achieve strong visibility tend to follow a consistent set of practices, whether they use a refined spreadsheet or dedicated software. The following subsections describe the practices that produce the greatest improvements in accuracy, efficiency, and cross-team alignment.
It is worth noting that these practices reinforce one another. Standardized naming makes location organization easier, and clear ownership makes counting routines more reliable. Attempting only one or two of them often produces disappointing results, whereas adopting them together creates a durable foundation. With that in mind, we begin with the principle that underpins all the others.
Establish a Single Source of Truth
A single source of truth means that every department consults the same inventory record, and no one maintains a competing list. This sounds obvious, yet it is the practice most often violated in organizations that rely on spreadsheets. Teams create private lists because the shared one is slow, unreliable, or inaccessible, and each private list then drifts further from reality. The first step toward improvement is therefore an explicit agreement that one record is the official one.
In practice, adopting a single source of truth requires retiring the shadow files that have accumulated over the years. This can feel uncomfortable, because those files often contain useful notes and local knowledge. A better approach is to migrate the valuable information into the shared record before retiring the copies. Once everyone is working from the same place, disagreements about quantity or location become questions that can be resolved by looking, rather than arguments about whose file is correct.
Standardize Naming, Categories, and Units
Inconsistent naming is one of the most common causes of poor inventory visibility. If one person records “3/4 in. ball valve” and another records “valve, ball, .75,” the same part appears as two different items, and neither search will find both. Standardized naming conventions eliminate this problem by ensuring that every item is described in a predictable format. The convention does not need to be elaborate, but it must be consistent and documented.
Categories and units deserve the same attention. A clear category structure, such as electrical, piping, fasteners, rotating equipment, and consumables, helps people browse when they do not know the exact name of a part. Consistent units of measure prevent the confusion that arises when one department counts in boxes and another counts in individual pieces. As a result, even a modest investment in standards pays off every time someone searches for or orders an item.
Organize Stock by Physical Location
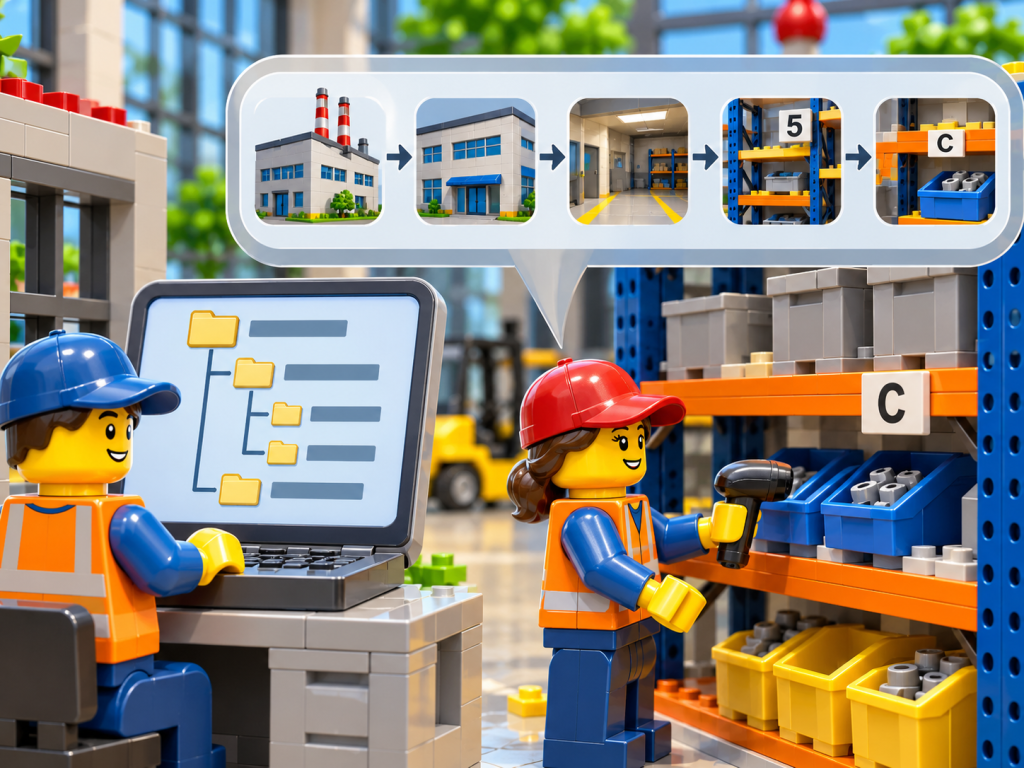
Knowing that you own a part is only half of visibility, because the other half is knowing where it is. Organizing stock by physical location means that every item is tied to a specific, identifiable place, whether that is a rack in a warehouse, a cabinet in a maintenance shop, or a designated area on a project site. Without this link, inventory records tell you what exists but leave the hunt to the individual. In operations with several storage areas, location accuracy is often more valuable than quantity accuracy.
A clear location structure should reflect how people actually move through the space. Grouping related items together, labeling areas consistently, and keeping location names stable over time all make retrieval faster and reduce errors. This is where a visual approach offers a major advantage, because a map conveys spatial relationships that a text code cannot. When teams can see where each category of stock sits relative to the rest of the facility, new employees become productive faster and experienced employees waste less time.
Assign Clear Ownership Without Creating Bottlenecks
Every storage area and every category of stock should have someone who is responsible for its accuracy. Without ownership, errors accumulate because everyone assumes someone else will correct them. Ownership does not mean that only one person may make changes; rather, it means that one person is accountable for noticing and resolving discrepancies. This accountability is what keeps a shared inventory trustworthy over time.
The challenge is to assign ownership without turning the owner into a bottleneck. If every update must pass through a single person, the record becomes stale whenever that person is busy or absent. A healthier model allows anyone who handles inventory to update it, while the owner reviews and corrects as needed. In practice, this balance keeps information current while preserving a clear point of responsibility.
Build a Regular Cycle Counting Routine
Even well-organized inventory drifts over time, so periodic verification is essential. Cycle counting, which means counting a portion of the inventory on a rotating schedule rather than shutting down for a full count, spreads the effort across the year and catches errors early. Teams typically focus first on high-value and high-criticality items, then work down to lower-priority stock. This approach keeps accuracy high without disrupting daily operations.
The key to successful cycle counting is consistency rather than intensity. A fifteen-minute count of one shelf each week will do more for accuracy than a heroic annual count that is outdated within a month. When counts reveal a discrepancy, the team should investigate the cause as well as correct the number, because patterns of error often point to a process problem. Over time, this discipline builds the confidence that allows departments to rely on the shared record instead of verifying everything themselves.
Align Departments on Shared Definitions
Cross-team alignment depends on everyone meaning the same thing when they use the same words. For example, does “available” mean physically on the shelf, or does it mean on the shelf and not already reserved for a job? Does “critical spare” follow a formal definition, or is it a matter of personal judgment? When departments interpret these terms differently, the same inventory record produces conflicting conclusions.
Taking the time to define key terms and document them in a short, accessible reference prevents many of these conflicts. It is also helpful to hold a brief, regular conversation among purchasing, operations, maintenance, and warehouse staff to review recurring issues. These conversations do not need to be long, but they create a habit of shared ownership over inventory outcomes. As a result, the organization moves from departmental silos toward a coordinated approach in which each team understands how its actions affect the others.
How CyberStockroom Supports Multi-Department Parts Visibility
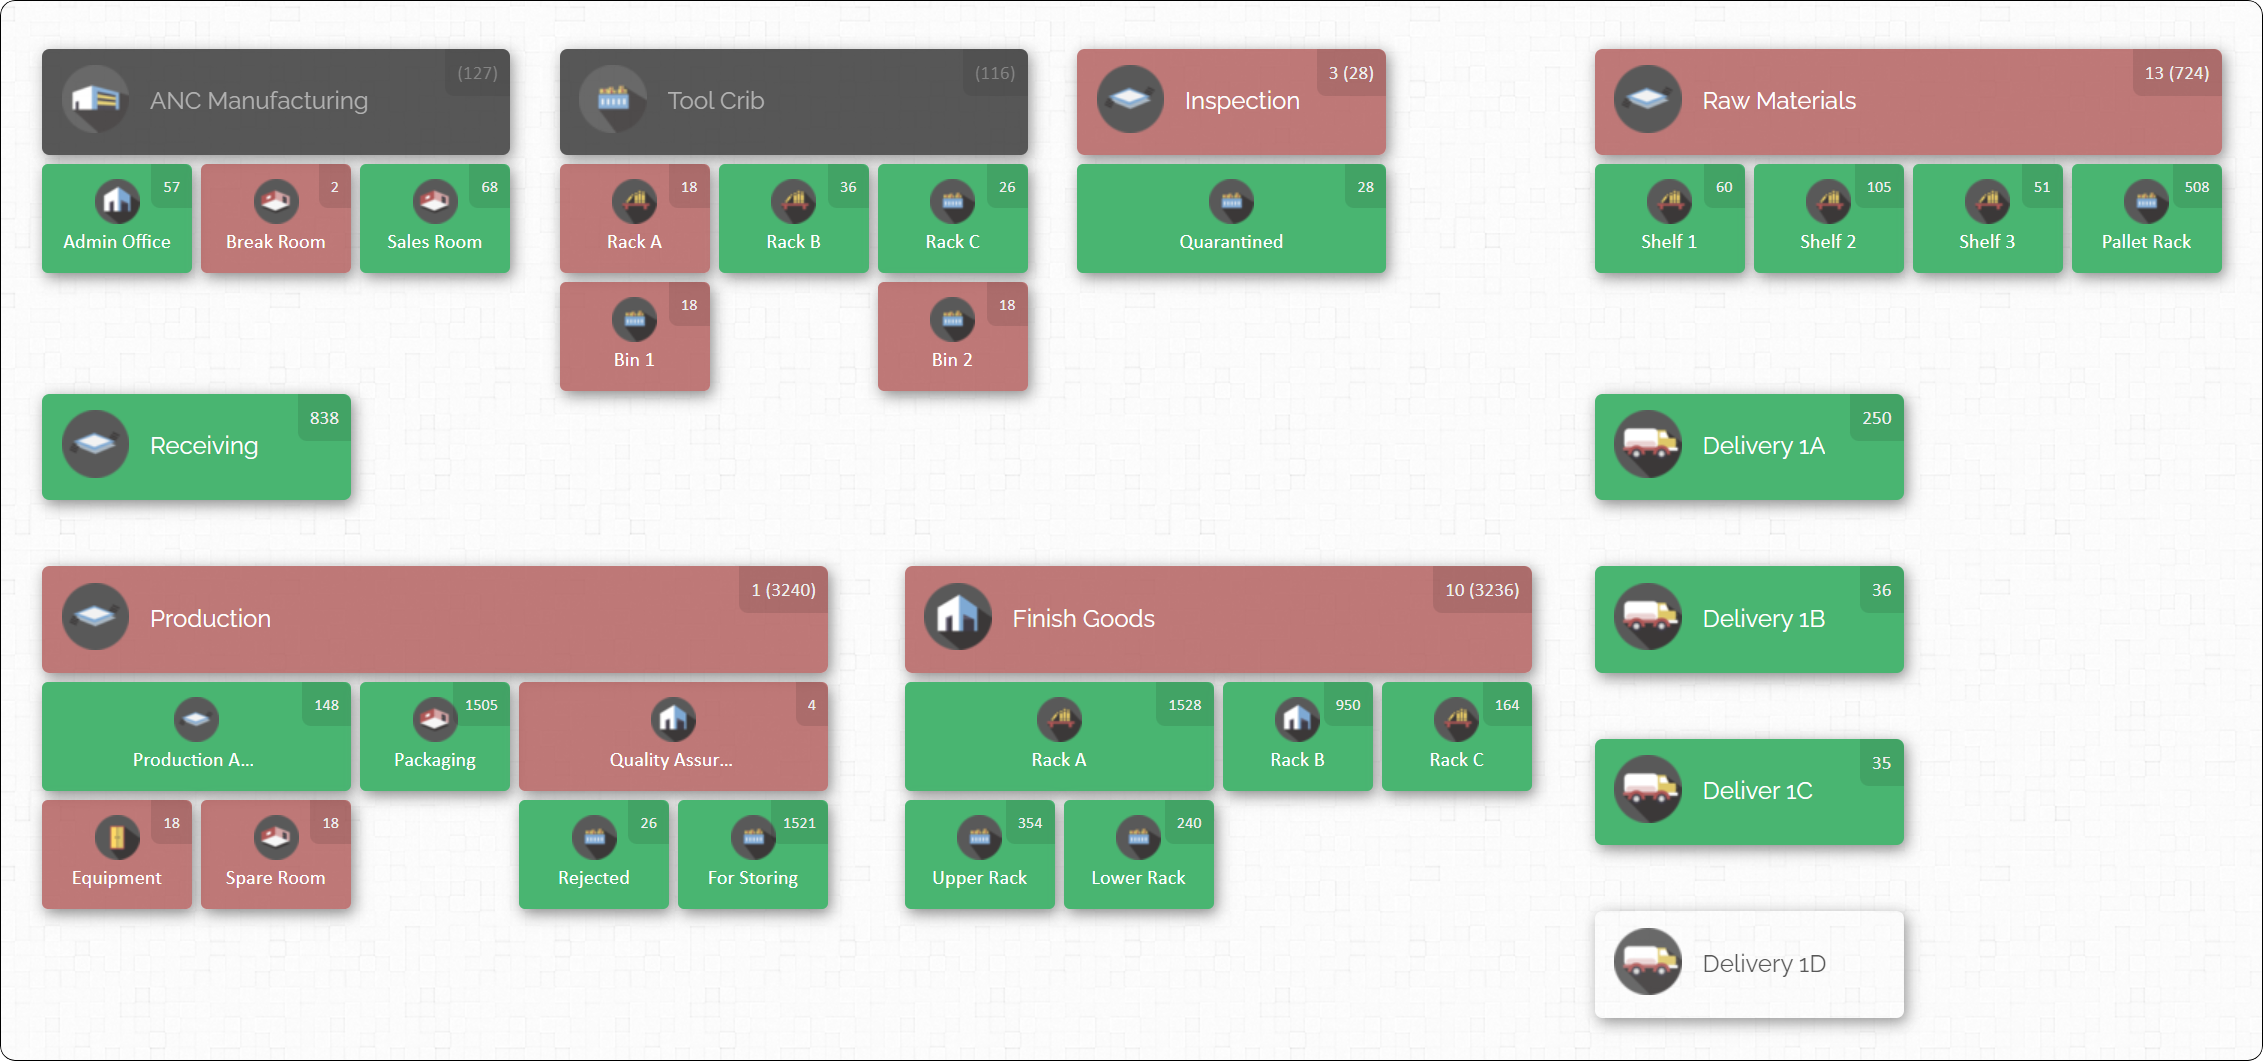
The best practices above are straightforward in principle but difficult to sustain in a spreadsheet, which is where CyberStockroom fits. CyberStockroom is built around the idea that inventory should be seen in the physical places where it actually sits. Teams place their parts, materials, and equipment on an interactive map of their facilities, yards, and storage areas, so that every item has a visible, specific location. This directly addresses the shortcomings of text-based location codes and gives every department a common visual reference.
For the single source of truth, CyberStockroom enables teams to maintain one shared inventory record that everyone can view, rather than a collection of separate files. When purchasing, maintenance, operations, and warehouse staff are looking at the same map and the same stock information, the duplicate files and private copies that spreadsheets encourage lose their purpose. Disagreements about whether a part exists or where it is can be settled by looking at the shared view. In practice, this removes much of the verification traffic that consumes time in spreadsheet-driven organizations.

CyberStockroom also supports the practice of organizing stock by physical location. With CyberStockroom, you can arrange inventory across multiple storage areas and keep items grouped in ways that reflect how your teams actually work. Because location is part of the record itself, a new hire or a crew member from another department can find a part without learning an unwritten coding system. This reduces the single-person dependency that so often plagues spreadsheets, since the knowledge of where things are lives in the system instead of in someone’s head.
The labor costs described earlier are also affected. When a technician can see exactly where a part sits, the search that once took twenty minutes of filtering and walking can be reduced to a quick look and a direct trip. Fewer failed searches mean fewer duplicate purchases, fewer rush orders, and less idle time waiting for materials. In this way, the visibility CyberStockroom provides translates into the operational efficiency and inventory accuracy that spreadsheet-based teams struggle to achieve.
Finally, CyberStockroom supports cross-team alignment by giving every department the same picture of the inventory. Maintenance planners can confirm where critical spares are stored, project teams can check what materials are on hand before requesting more, and purchasing can verify existing stock before placing an order. Because everyone is working from one visual record, conversations shift from “which file are you looking at?” to “what do we need to do next?” That change in the quality of conversation is one of the most valuable and least obvious benefits of a shared, location-based inventory view.

When a Spreadsheet Is Still the Right Choice
Despite everything discussed so far, there are situations in which a spreadsheet remains perfectly sensible. A very small operation with a limited number of items, one storage location, and a single person responsible for updates may not need dedicated software. The same is true of short-lived projects, where the inventory will exist for only a few weeks and the overhead of setting up a new system would outweigh the benefit. In these cases, a clean, well-structured workbook can serve its purpose without much friction.
The decision becomes less clear as complexity grows. Warning signs include multiple people editing the same file, more than one storage location, frequent disagreements about quantities, and a growing habit of keeping private copies. Another signal is dependence on one person who understands the file better than anyone else. When two or three of these signs appear together, the cost of continuing with a spreadsheet is likely higher than the cost of changing.
It is also worth remembering that the choice is not permanent or absolute. Many organizations keep spreadsheets for analysis and budgeting while using dedicated software for day-to-day location and stock visibility. This pairing lets each tool do what it does best, and it avoids the false choice between abandoning Excel entirely and forcing it to do everything. With that perspective, let’s look at how to make the transition smoothly when the time comes.
How to Transition from Excel to Inventory Software
A successful transition begins with cleaning the existing data, not with installing anything. Review your current spreadsheet for duplicate entries, inconsistent names, obsolete items, and missing locations, and resolve as many of these as you can before the move. This step may feel tedious, but importing messy data into a new system only relocates the mess. In practice, teams that invest a few days in cleanup find that the rest of the transition goes far more smoothly.
Next, plan the rollout in manageable stages rather than attempting to move everything at once. A common approach follows this sequence:
- Choose one storage area or one category of high-value items as a pilot
- Map the physical locations and enter the cleaned inventory for that pilot
- Have a small group from different departments use the shared view for a few weeks
- Gather feedback, adjust naming and organization, and then expand to additional areas
This staged approach limits disruption, builds confidence, and reveals problems while they are still small and easy to fix. It also gives each department a chance to see the benefits firsthand, which makes adoption more natural than a mandate would.
Throughout the process, communication matters as much as the technology. Explain to each department why the change is happening, how it will make their work easier, and what is expected of them in terms of updating information. Retire the old spreadsheet deliberately once the new system is trusted, so that nobody continues to maintain a competing file. When people understand the reasons and see early wins, the shift to a shared inventory view becomes something the organization embraces rather than tolerates.
Measuring the Return on Better Inventory Visibility

Once you move away from spreadsheets, it is important to measure whether the change is working. Begin with the same data points you gathered when estimating the cost of Excel, such as search time, duplicate purchases, expedited shipments, and downtime tied to missing parts. Tracking these numbers before and after the transition gives you an honest picture of the improvement. Without a baseline, it is easy to underestimate the gains or to overlook problems that still need attention.
Beyond financial measures, consider operational indicators that reflect how well teams are aligned. Examples include the time it takes a new employee to locate common parts, the frequency of disagreements about stock quantities, and the number of times a crew is delayed waiting for materials. These indicators capture the cross-team benefits that raw dollar figures sometimes miss. As a result, they help you tell a more complete story about the value of improved visibility.
Finally, review these measures regularly rather than treating them as a one-time exercise. Inventory visibility is an ongoing discipline, and the habits that sustain it, such as cycle counting, consistent naming, and clear ownership, need continued reinforcement. Sharing results with each department also reinforces the idea that inventory accuracy is a collective responsibility. Over time, this culture of shared accountability becomes as valuable as any single feature of the tools you use.
Common Mistakes to Avoid When Comparing Spreadsheets and Inventory Software
One common mistake is judging the cost of spreadsheets by their purchase price instead of their total cost. Because Excel is already installed, many decision-makers conclude that it is free and that any dedicated software represents a pure added expense. As this article has shown, the hidden costs of labor, errors, duplicate purchases, and downtime frequently exceed the price of a purpose-built tool. Evaluating the full cost, rather than only the visible one, leads to better decisions.
Another mistake is expecting software to fix process problems on its own. If naming is inconsistent, ownership is unclear, and nobody performs regular counts, a new system will simply reproduce the same confusion in a different format. The software works best when it supports good habits, such as consistent organization and shared accountability. In practice, the combination of sound practices and a visual, shared inventory record produces results that neither could achieve alone.
A third mistake is delaying the change until a crisis forces it. Organizations often wait until a costly stockout or a failed audit makes the problem impossible to ignore, and they then rush through a transition under pressure. A planned, staged move is far less disruptive and produces better data than an emergency one. By recognizing the warning signs early, you can choose the timing of the change instead of having it chosen for you.
Count the Real Cost Before Choosing
The debate over spreadsheets vs. inventory software is ultimately a question about what you are willing to pay for, whether that is a visible subscription or an invisible stream of wasted hours, duplicate purchases, and idle crews. Excel is a capable tool that serves small, simple operations well, but it struggles when many people across many departments must share one accurate picture of physical inventory. The costs of that struggle are real, even though they seldom appear on a budget line. Recognizing them is the first step toward a better approach.
Improving inventory visibility depends on a combination of practices: a single source of truth, standardized naming, location-based organization, clear ownership, regular counting, and shared definitions. These practices can be applied in any tool, but they are far easier to sustain when the tool itself reinforces them. CyberStockroom supports this approach by placing inventory on an interactive map, giving every department the same visual understanding of what you have and where it is. That shared view reduces searching, cuts down on duplicate purchases, and strengthens alignment between teams.
If your organization is still managing parts in a workbook, consider spending an hour estimating what that workbook truly costs you. Gather the numbers, talk with the people who search for parts every day, and compare the total against the value of a faster, clearer, shared system. Then explore the CyberStockroom inventory demo map to see how location-based visibility could work for your own facilities and storage areas. The answer may well show that the most expensive spreadsheet is the one that looks like it costs nothing.







Leave a Reply