
Why Inventory Visibility Matters Across Departments
Manufacturing and construction warehouses hold hundreds or thousands of unique parts – raw materials, replacement components, consumables and finished goods – and often serve multiple departments. Each department (production, maintenance, engineering, safety, quality, etc.) may draw from the same pool of parts. Without full visibility, teams end up working from incomplete or outdated information. For example, a production planner might see an available quantity of a critical part in the system, while a maintenance crew has already staged that part for an urgent repair. The result is confusion and delay when the assembly line or the job site unexpectedly runs out.
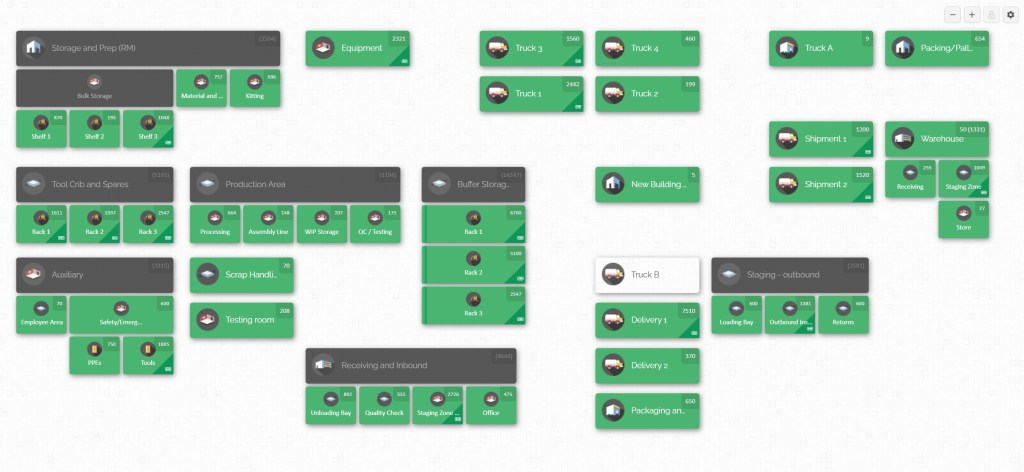
Improving visibility means being able to quickly answer: What is the part, where is it stored, and how many are on hand? A visual map helps answer these questions by tying inventory records directly to physical locations. Instead of guessing where items are or relying on last-known data, teams can open the inventory map and instantly see the status. This reduces “multiple location blindness” (not knowing all areas that hold a part) and “identity confusion” (mislabeling or mixing up similar parts).
Inventory visibility also drives accuracy and efficiency. When location information is organized and up to date, workers spend less time searching. A picker in stores can click a highlighted rack on the map and go directly to it, rather than wandering aisles or flipping through pages. Procurement buyers see all on-hand stock across the site and can avoid unnecessary emergency purchases. Maintenance and production know exactly if a part is available before halting a machine or a line. In short, full visibility lets the warehouse operate as a unified system rather than disconnected stock rooms.
Best Practices for Parts Visibility and Accuracy
Achieving full parts visibility requires both good processes and the right tools. Here are proven best practices that inventory teams can follow:
- Centralize inventory data in one system. Use a single digital inventory platform for all departments. When every team (stores, maintenance, production, procurement) records transactions in the same system, the data stays consistent. For example, as soon as warehouse staff log a delivery, that receipt is visible to engineers planning production. When maintenance withdraws parts for repairs, those items are checked out in the system so production and purchasing know the exact remaining quantity. Avoid keeping separate spreadsheets or notebooks for different teams – all stock movements should update the central database immediately. This “one source of truth” ensures nobody orders duplicates or assumes stock levels that aren’t real.
- Implement real-time tracking with barcode scanning. Assign every part and every location a unique barcode. At receiving, the warehouse team scans each item as it is unpacked; the system automatically records it to the proper location on the map. Likewise, whenever parts are moved or issued, employees scan the items and the rack location (or work order) at both the origin and destination. This ensures inventory counts remain accurate at every moment. Modern smartphones or dedicated barcode scanners can be used – the key is to make scanning routine. When crews habitually scan items in and out, human errors drop significantly. For example, a maintenance tech scanning a bearing as it leaves the storeroom instantly updates the count so production sees the correct stock next time they check.
- Standardize labels and location identifiers. Clearly label all storage areas and shelf spaces with readable codes or names. Unique identifiers (like “Aisle A – Shelf 3 – Bin B2”) should match the inventory system’s location labels. Likewise, every part should have a clear SKU or part number tag. Standardizing labels makes it easy to use the map and scanning system together. For instance, a kit assembler on the production floor scanning a part’s barcode will see both the item’s details and the exact bin where it lives. Simple, enforced procedures help: e.g., “All inbound pallets are labeled and scanned into Zone A by aisle and shelf.” By treating labeling as a discipline, you prevent mix-ups (such as one trade inadvertently storing parts in another trade’s area without logging it). With consistent naming and scanning procedures, even new staff can quickly learn the system, and mistakes drop dramatically.
- Conduct regular cycle counts and audits. Even with real-time tracking, periodic physical checks are vital. Schedule rolling cycle counts so that high-use parts are verified frequently – for example, count a different section of the warehouse each week. During a count, compare what the map shows to what’s actually on the shelves, following the map itself as a guide. If the system says 50 units of a fastener are in Rack 4 but only 45 are found, record the discrepancy immediately and investigate: was some never scanned in, or has an item wandered off? Regularly reconciling small errors prevents them from piling up into big problems. Consider auditing critical spares or expensive parts monthly, and always update the map entries right away after an audit. A disciplined audit routine means the map remains a reliable picture of reality rather than a guess.
- Treat parts issuance like a controlled checkout process. Whenever anyone (a maintenance crew, a subcontractor, or a production line) takes parts out of storerooms, require a formal checkout procedure. This could be a sign-out form, a digital issue record, or a quick scan of items against an order. Record who took which parts, for what purpose, and the expected return date if applicable. For example, if the mechanical team removes a pump from inventory, they scan it out under “Maintenance Crew A” or tag it to a job order. This creates accountability: the system shows that “Maintenance Crew A has Pump #5 checked out.”
- Maintain clear communication channels. Visibility is as much about people as it is about data. Keep teams informed of inventory status changes through shared dashboards, alerts or regular briefings. For instance, if the visual map indicates that stock of a critical component is running low, send an alert to purchasing or plan an emergency order immediately. When parts are delayed on delivery, notify both warehouse staff and production schedulers. Hold short daily meetings or use a digital message board to flag inventory issues. It often helps to appoint one inventory coordinator or small team to oversee stock updates and communications. With everyone receiving the same notifications and updates, departments don’t have to chase each other for information – the visual map already shows the latest picture.
- Optimize storage layout for your parts. Group frequently used items in easy-to-access locations, and allocate dedicated space for high-turnover stock. Use bin sizing and shelf arrangements that fit your typical parts (small fasteners vs large bulky items). A clear, systematic layout reduces picking errors. In a mapped system, you can plan this visually: for example, map out “fastener racks” and “electrical parts shelves” so pickers and stockers always know where to find related items. If necessary, create separate map zones for things like “reserved stock,” “quality hold,” or “line-side kits.”
These best practices – central data, routine scanning, standard labelling, audits, controlled check-out, communication, and organised layout – all reinforce accurate, shared inventory visibility. They lay the groundwork so that when a visual map is introduced, its information is reliable and up-to-date. A map is only as good as the data behind it; following these steps ensures your digital map reflects reality every day.
Building a Visual Inventory Map of Your Warehouse

Once you have the right practices in place, the next step is to create and refine a visual inventory map that mirrors your facility. This map is more than a diagram; it becomes the central interface for your inventory system. Here’s how to build one that works for your daily operations:
- Reflect your physical structure. Start by breaking down the warehouse (or multiple warehouses) into logical areas on the map. You might create top-level zones for separate buildings or large storage yards (e.g. “Main Warehouse,” “Production Floor,” “Maintenance Storeroom,” “Outdoor Storage”). Within each zone, define sub-locations that match your actual layout: aisles, racks, shelf levels, bins, cabinets, even service vehicles or trailers if you carry spare parts in vans. Each zone on the map should have the same labels you use on the floor. For example, map out “Aisle A – Rack 12 – Shelf 3” exactly as it exists physically. Good inventory systems allow any number of nested locations – use this to mirror what you have. In essence, draw your real warehouse on the screen. The more closely the map matches the real world, the easier it is for workers to use.
- Use clear labels. On the digital map, each location should be distinctly identified. Label areas in plain language (e.g. “Fastener Rack,” “Electrical Panel Cabinet,” “Line 2 Spare Parts”).
- Populate the map with inventory. Once the structure is ready, add your products and parts to the system and assign them to locations. Ideally, you will import an existing inventory catalog (via CSV or spreadsheet) into the software to start. Then “check in” your items to the map’s locations. Many systems let you scan barcode labels directly into the map interface or simply drag item icons onto locations. Each location icon on the map will display a count of what it holds. For example, if you put 50 safety gloves in “Zone B – Cabinet 4,” the map will show a badge with “50” on that cabinet icon. This makes stock levels visible at a glance. Include as much detail as needed: assign part numbers, descriptions, and even photos to each item record.
- Include all relevant storage areas. Don’t forget that “inventory” isn’t confined to the main warehouse. Create map areas for receiving docks, quality inspection stations, quarantine cages, assembly kitting zones, or even off-site yards. In many manufacturing operations, parts might sit temporarily in staging lanes or be en route between buildings. Each of those should have a place on your map (even if it’s just a temporary location label). If your teams use service vehicles or toolboxes as mini stores, those can be sub-locations on the map too (for example, “Van 12 – Shelf A”). The goal is to ensure there are no hidden stockrooms. Every place where inventory can reside – however briefly – should be represented. This completeness makes sure that the map truly becomes the “single inventory picture” for the whole operation.
- Enable multiple sub-maps if needed. If your operation spans a campus or has multiple warehouses, use the software’s ability to handle sub-maps or separate maps for each site. A good system lets you switch between, say, the Main Warehouse map and the Secondary Yard map, or even view them side by side. You might have one top-level site view showing each building, and clicking into a building shows its internal map. This multi-location flexibility ensures all departments – wherever they are – see the same style of map and inventory data. For example, the maintenance building might organize parts by cabinet and drawer, while production organizes by line and bin. The map can display both structures clearly by keeping them in their own area.
Building the map is often a collaborative effort. Warehouse supervisors, engineers, and shop floor leaders should help define the layout so that it matches real workflows. Update the map structure whenever you make a significant change (a new rack, a relocated storage, a new building). Once complete, the map is ready to become part of daily operations.
Integrating the Inventory Map into Daily Operations

Creating the map is just the first step – the real value comes from using it day after day. To fully integrate the visual map into daily workflows, follow these steps:
- Use the map at receiving and put-away. From the moment parts arrive, start using the map. When a delivery comes in, unpack and scan each item. In the inventory system, record the item count and select the destination location on the map – effectively “placing” those parts into that shelf or bin. For example, incoming packs of bearings are scanned and checked into “Bearing Rack 2” on the map. Warehouse staff should follow a defined receiving process: verify quantities, label pallets or bins, then immediately update the map with the receiving data. This makes sure the map reflects new stock as soon as it enters the business.
- Capture every internal movement on the map. Any time inventory moves within the facility, treat it as a transaction that updates the map. For instance, if production needs 20 screws from the main stores, the picker scans those 20 out of “Screws – Bin A5” on the map and into a “Line 3 Pick Cart” location (or directly to the job). If maintenance moves tools or parts into a staging area for a repair, they scan both the items and the destination location, so the map shifts the quantity. CyberStockroom and similar systems allow dragging items between locations with a click: simply select the part on the screen, drag it from “Central Stores” to “Line-side Bin,” and the software logs the transfer. By matching every physical move with a digital move, the map stays perfectly aligned with reality.
- Guide picking and restocking with the map. When workers need to retrieve parts, the map should be their guide. Use the map to generate pick lists or show pickers where items are located. For example, if a kit needs to be assembled, each part in the kit can be selected on the map so that the worker sees exactly which rack holds that part. The map may also show optimal picking routes if it’s integrated with your picking process. After a pick, encourage the picker to double-check on the map: confirm they are at the right location before grabbing parts. Similarly, when restocking items after a pick, update the map by scanning the returned items into their correct locations. This keeps stock levels accurate without any extra paperwork.
- Embed map usage in maintenance and production routines. Every department that takes or returns parts should do so via the map interface. For example, a maintenance technician who needs a spare pump for a machine will look on the map to see where pumps are, then “check out” that pump in the system. This might involve scanning the pump’s barcode, which automatically flags it as assigned to the technician or work order. If the technician later brings back the pump unused, they scan it back in to update the map. By making the map portal the one-stop record for all stock issues, your plant maintenance, engineering and stores teams all contribute to its accuracy.
- Perform cycle counts using the map. Rather than random counting, plan cycle count activities using the map’s layout. For instance, schedule that every day the team will verify the inventory on one aisle or category shown on the map. During the count, physically walk that zone and match each shelf’s contents to what the map shows. If there’s a discrepancy, update the map: correct the quantity or adjust the location. This visual method ensures that not only quantities but also the locations themselves are kept correct. When errors are found, analyze whether they were due to quantity mistakes, unscanned moves, or items stored incorrectly. By doing this as part of routine counting, you keep the map “healthy” and reliable.
- Leverage the map in planning and meetings. Use the visual map to inform daily planning. For example, a morning shift meeting can include a quick view of the map to highlight low-stock alerts or recent stock transfers. Production supervisors can check the map before scheduling a run to ensure all needed parts are in place. If a part is marked “available” on the system, the map lets the planner see exactly where it sits; this prevents surprises like a part actually sitting in the quality hold area instead. By making the map a shared reference, everyone’s plans are based on the same data.
By weaving the map into each step – receiving, storing, picking, issuing and auditing – it stops being a separate tool and becomes part of the daily routine. As workers grow accustomed to opening the inventory map for their tasks, the entire operation moves from manual guesswork to data-driven efficiency.
CyberStockroom: Enabling Cross-Department Parts Visibility
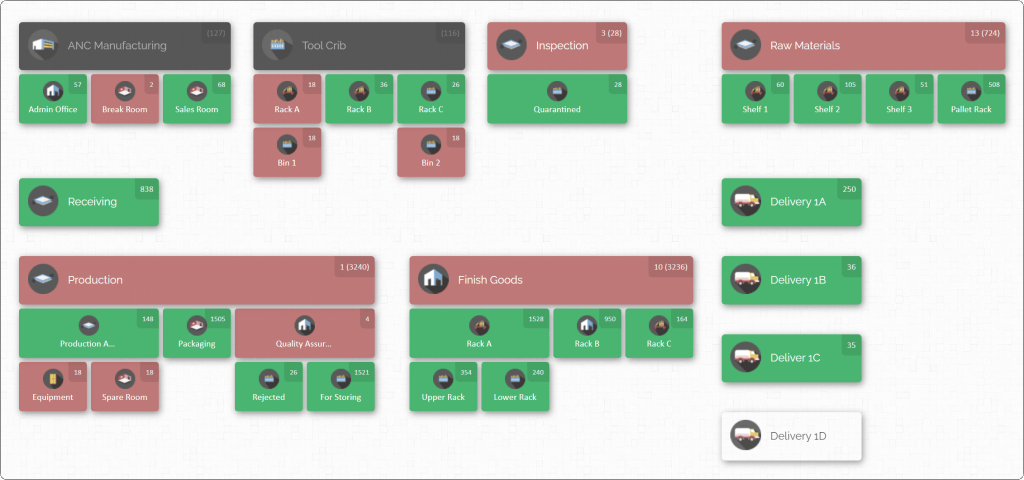
A critical enabler of all these practices is the right inventory software – one built around the visual map concept. CyberStockroom is an example of a cloud-based inventory platform designed exactly for this purpose. It integrates map-driven visibility and inventory tracking so that multiple departments can share a single, accurate picture of parts on hand. Here’s how CyberStockroom’s features align with the above best practices:
- Customizable Visual Inventory Map: CyberStockroom centers its interface on an interactive map that you design to match your warehouse or facility layout. You can create any number of locations and sub-locations (buildings, rooms, racks, bins, trays, vehicles, etc.) and arrange them on screen just as they exist physically. Once drawn, each location tile on the map shows the quantities of all parts inside. Workers can click on a bin or shelf in the map to drill down and see exactly which items and how many are there. This bird’s-eye view means everyone in any department (stores, maintenance, production, etc.) literally sees the same layout and contents. The map becomes the central dashboard – no separate spreadsheets or siloed records.

- Real-Time Updates via Scanning: In CyberStockroom, every item and location can have a barcode. When team members receive, move or issue parts, they simply scan the codes. The system instantly updates inventory counts and the map display. For example, if a storekeeper scans 10 paint cans into “Aisle 5 – Bin 2,” the map immediately shows that those cans have been placed there and adjusts the stock tally. This instant update capability supports the “one source of truth” concept. No matter which department performs the scan, the change is live for everyone else. Real-time tracking means the map is always accurate even in a busy, fast-moving environment.
- Drag-and-Drop Transfers: CyberStockroom makes inter-location moves quick and intuitive. Instead of manual entry forms, you can simply drag an item icon from one location on the map to another. This instantly tells the system that stock has moved. For example, dragging a connector from the central stores area to the production floor on the map automatically reduces the source count and adds to the destination count. The same effect happens if you scan the part and then scan the destination location code – the software logs the change. These drag-and-drop transfers mirror the actual physical movement of parts, keeping the map perfectly aligned with what happened on the warehouse floor. This tool is especially useful for multi-site or multi-building moves: move parts between buildings on the map as easily as within one warehouse.
- X-Ray View of Parts Distribution: A unique advantage of the map is being able to see everywhere a part is stored. CyberStockroom includes a product “X-ray” feature. When you select or search for a part, the map highlights all locations where that part exists and shows the quantities at each one. Instead of hunting or guessing, you immediately see, for example, that a particular valve is split between three racks and one field service van. This helps in decision-making: if production needs 20 valves, the planner sees where to pick them from; if a reorder is being considered, the buyer sees there are still usable stock in maintenance stores and can avoid unnecessary spend. The X-ray view directly supports cross-team alignment by showing multi-location inventory in a single image.

- Check-in/Checkout and Accountability: CyberStockroom supports logging who has what. You can assign items to specific employees, jobs or teams at checkout. For instance, when maintenance signs out a toolkit, the toolkit’s record can be tagged to that technician. The map and system will reflect that the toolkit is “with” that person. When it’s returned, scanning it back into the system updates the map again. Each inventory action – adding, moving or removing – is attributed to a user in the history log. This audit trail builds accountability. If a part goes missing, you can review the inventory history log (filterable by user, location or date) to see its last known movements and handlers. Clear tracking and user records deter loss and help resolve discrepancies quickly.
- Built-in Cycle Counting and Adjustments: To keep data accurate, CyberStockroom offers cycle count tools directly linked to the map. You can generate count lists and then count parts by location on the map. If you find a mismatch (for example, the map says 30 nuts in Shelf 4 but you count 28), the system lets you adjust the quantity right from that location. Because these counts update the map in real time, any correction is immediately shared with all departments. In this way, location maintenance becomes part of regular inventory work. The system can also produce audit reports, so you always know when a location was last verified or adjusted.
- Custom Fields and Product Details: Each part record in CyberStockroom can hold images, attachments and custom data fields. Barcodes on items and shelf labels complement the map’s visual cues. These product details reduce the two most common picking mistakes: “Am I at the correct location?” and “Is this the correct part?” By combining location information, barcodes, and images on one platform, CyberStockroom bridges the gap between paper systems and physical reality.
- Spare Parts and Multi-Vehicle Support: If your operation includes tracking spare parts or tools on vehicles, CyberStockroom supports that too. A van or truck can be set up as a “location” with its own sub-locations (shelves or drawers). Parts carried in field service kits can be logged and counted just like any warehouse bin. This ensures that all inventory – whether in the main store or in service trailers – is visible on the same map interface. For multi-department projects, even separate project sites or laydown yards can be represented as sub-maps.
All of these features work together to make CyberStockroom a practical embodiment of the best practices described earlier. When your inventory map is powered by this kind of software, every scan, move, or count feeds directly into the visual map. Teams in maintenance, production, procurement and warehousing immediately see changes. In effect, CyberStockroom creates a live digital twin of your actual inventory. When planned parts arrive or shift from one zone to another, the map changes in sync. This real-time, shared environment makes daily warehouse operations smoother and far more efficient.
Using the Map in Everyday Warehouse Routines

In practice, the integrated inventory map changes the flow of daily tasks:
- Morning Check and Planning: At the start of a shift, team leaders can pull up the inventory map to check stock levels of critical parts. Any low-stock alerts or unfulfilled orders from the previous night are obvious on the screen. The map informs that day’s purchasing, assembly line loading or maintenance assignments. For instance, if the map shows fewer lubricants in stores than expected, maintenance can schedule refills in advance rather than discovering the shortage mid-repair.
- Receiving and Restocking: As inbound shipments arrive throughout the day, storekeepers use the map to assign locations immediately. They might scan in parts and then tap the destination bin on the map to confirm put-away. This instant logging means floor stock is always up to date. Workers no longer have to guess whether a just-delivered item is counted on hand – the map shows it as soon as it’s received.
- Issuing to Production or Maintenance: When parts are withdrawn, the issuing process runs through the map system. A production attendant assembling kits will scan each component and mark the workplace location on the map, reducing that item’s on-shelf count. Similarly, a maintenance crew taking spare parts will scan and assign them to their work order. All these transactions are visible in real time. If a shop floor supervisor opens the map, they can see exactly which parts have gone to which job and which remain in stock.
- Cross-Team Collaboration: The same map view is available to everyone authorized – from purchasing managers to machine operators. If production staff need to see if maintenance has reserved parts for a repair, they check the map to find any items tagged to maintenance. If procurement is wondering whether to expedite a shipment, they look at the map to see if equivalent parts exist elsewhere on site. This shared platform avoids situations like one department ordering spares that another already has on standby.
- End-of-Day Audits: At shift end, a quick reconciliation can be done using the map. The software can generate an audit of high-usage locations or any anomalies. Warehouse staff might do a spot check of a few bins by referencing them on the map, ensuring counts still match. Any end-of-day inventory turns or transfers are finalized in the map system before closing the books.
By making the map a part of each of these routines – rather than an afterthought – visibility becomes ingrained. Workers come to rely on the map as they would on any other tool in their workflow. Over time, using CyberStockroom turns into second nature: scan here, click there, and trust the map. This cultural shift is what translates the technology into real operational gains.
Key Outcomes for Warehouse Operations
When a visual inventory map is fully integrated into daily workflows, the results are clear:
- Operational Efficiency: Workers spend less time hunting for parts or correcting mistakes. A picker can go straight to the correct rack via the map instead of wandering. Real-time data prevents duplicate work (like two teams ordering the same part unknowingly). Over days and weeks, these saved minutes add up to significant productivity gains.
- Improved Inventory Accuracy: With disciplined scanning and visual cues, the system reflects reality. The chances of “phantom stock” (parts counted but not actually there) drop dramatically. Regular cycle counts and instant corrections keep the database in sync with the floor. This means fewer production stoppages due to stockouts, and higher confidence in reported stock levels when making plans.
- Cross-Department Alignment: Maintenance, production, and purchasing all see one unified inventory picture. Each department trusts that the numbers and locations on the map match exactly what’s on hand. This alignment eliminates the “shoot-the-messenger” scenario where departments blame each other for miscounts. Instead, shared visibility fosters coordination – for instance, maintenance can pick from the map knowing they’re not taking inventory needed for production, and purchasing orders only what truly is missing.
- Better Space Utilisation and Planning: Because the map shows quantities in each zone, planners can identify underused or overstocked areas. For example, if one aisle is always half empty while another is packed, the team can reorganise shelving accordingly. The software’s drag-and-drop feature lets managers experiment with new layouts on screen before moving anything physically. Staging areas for upcoming work (like a maintenance shutdown or project phase) can be planned visually on the map, ensuring materials are placed optimally.
- Accountability and Loss Prevention: When every inventory transaction is logged against a user or team, responsibility increases. Workers know that lost or broken parts will be traced back to the last recorded handler. Over time this reduces careless handling and theft. If shrinkage does occur, the detailed audit trail speeds up investigations and corrections.
- Scalability and Growth: A good digital map scales as your business grows. New shelves, another warehouse or an extra shift can be added with ease – just expand the map and train staff on the update. Unlike paper-based methods that collapse under complexity, a software-backed map handles growth gracefully. This means your system of visibility remains robust even as the company takes on new projects or locations.
In summary, integrating a visual inventory map reshapes daily warehouse operations into a transparent, data-driven process. Inventory accuracy climbs, team communication improves, and operations run more smoothly. By following the best practices above and using a tool like CyberStockroom, inventory teams can achieve truly comprehensive parts visibility across all departments.
Implementing these changes may require some initial effort – mapping out the facility, tagging parts with barcodes, and training staff – but the payoff in efficiency and confidence is well worth it. In the long run, a live, interactive map of your inventory pays for itself by reducing waste, preventing delays, and empowering every team to make informed decisions based on the same, accurate data.









Leave a comment