
Manufacturers often find that parts accumulate in storerooms, maintenance cribs, and on the production floor. While a small amount of extra stock can buffer against uncertainty, too much idle inventory becomes obsolete stock – items that no team will ever use. This idle inventory locks up cash and can obscure the true status of needed parts. A core issue is visibility. Production, maintenance, procurement, and quality teams may each use different spreadsheets or systems. As a result, one department might order a part that is sitting idle in another area, just unknown to them.
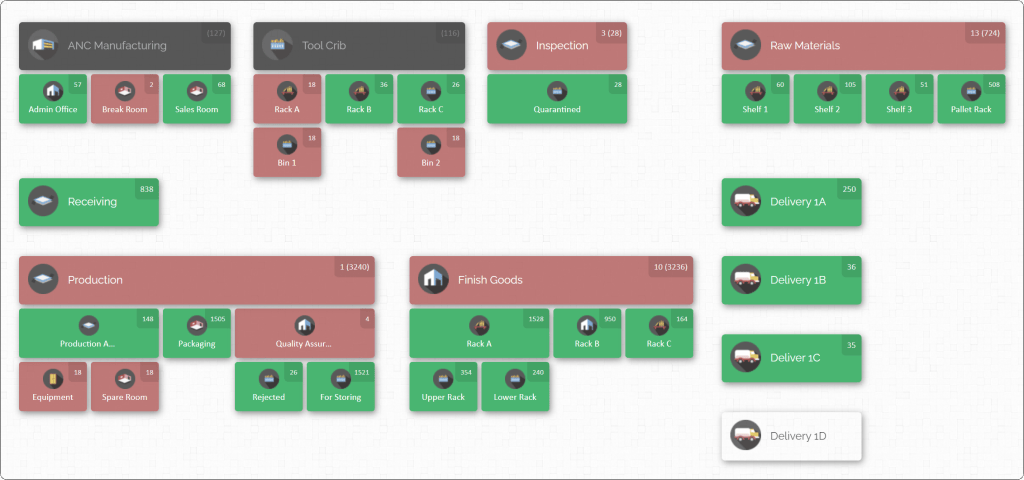
Imagine replacing paper lists with a visual map of your plant. In this map view, you see every raw materials location, rack, and bin with live quantities. A maintenance tech quickly finds the spare they need because the system shows it on the map. A planner in procurement sees the same map and realizes several units already exist in another building, so no new purchase is needed. By tying inventory records to exact locations, the whole team gains a single source of truth. This kind of system makes reducing obsolete inventory far more achievable: everyone can see what’s in stock, where, and whether it’s actually needed.
Understanding Obsolete Inventory in Manufacturing

Obsolete inventory consists of parts or materials that have little or no future demand. Common examples in a factory setting include: discontinued product parts, one-off project leftovers, components made obsolete by design changes, or spares that were never used. It is different from “excess inventory,” which might still be sold or used eventually. Obsolete items have essentially zero realistic future consumption.
Such inventory has significant costs:
- Capital Tied Up: Funds spent on unused parts could have been invested elsewhere. Obsolete stock provides no return.
- High Carrying Costs: Warehousing, insurance, handling, and depreciation costs mount over time. Industry estimates put annual carrying costs at roughly 20–25% of inventory value, which obsolete stock continually incurs.
- Value Erosion: Obsolete parts often must be written off or sold at a fraction of cost. This hurts margins and can cause sudden large losses on the books.
- Space and Complexity: Dead stock occupies valuable space. It clutters warehouses and can make picking and counting active items slower and more error-prone.
- Distorted Planning: Hidden or forgotten stock can lead planners to order unnecessarily, or conversely, false shortages if the stock isn’t visible in the system. Both scenarios disrupt production schedules and inflate lead times.
By contrast, when inventory is lean and relevant, working capital is freed up, warehouse space is efficient, and people spend time moving needed items instead of searching or debating stock levels. Avoiding obsolete inventory is therefore a strategic goal, not just an accounting detail.
Key Metrics and Indicators
To manage obsolete inventory, companies must measure it. Useful indicators include:
- Inventory Turnover Ratio: How quickly stock is used and replaced. A low turnover (slow movement) often points to excess or obsolete inventory. Improving turnover means fresher stock and lower obsolescence risk.
- Days of Inventory on Hand (DOH): (Average Inventory ÷ Cost of Sales) × 365. High DOH suggests overstock. Monitoring DOH by SKU category helps set realistic stocking levels.
- Slow-Moving Stock Percentage: The portion of SKUs with little to no usage over a period. For example, measuring how many parts had zero issues in the last 6 months. A rising percentage indicates growing idle inventory.
- Aging Reports: Breakdown of inventory value or units by age brackets (0–3 months, 4–12, 1–2 years, etc.). A long tail in the oldest bracket is a red flag for obsolescence.
- ABC Classification Distribution: The counts of A, B, and C items (by value) in inventory. An overly large C-category (low-value, many SKUs) often means clutter in slow items that need tighter control.
- Cycle Count Variance Rates: Frequency and magnitude of count discrepancies. High variances usually accompany hidden or mislocated stock.
- Obsolete Stock Value: The dollar amount classified as obsolete or written off. Tracking this over time shows if reduction efforts are working.
- Stockout vs. Overstock Frequency: If stockouts happen (running out of needed parts) at the same time excess stock piles up, this mismatch signals poor visibility or policy.
A dashboard tracking these metrics gives early warnings. For instance, if inventory aging reports show a growing number of parts with over one year of stock remaining, management can investigate before those parts become completely unsellable. These quantitative measures complement qualitative judgments like regular audits and team reviews.
Common Causes of Obsolete Inventory

Knowing what drives obsolescence helps prevent it. In manufacturing, typical causes include:
- Forecasting Errors: Overestimating demand or failing to update forecasts when market conditions change. This often leads to overproduction or over-purchasing.
- Product/Design Changes: When products are redesigned or discontinued, existing components may no longer fit new designs. Without a plan for excess stock, these parts become obsolete.
- Defensive Purchasing: “Just in case” buying to hedge against delays or price changes. Long lead times and minimum order quantities (MOQs) can force large batch orders. If demand drops, the excess lingers.
- Departmental Silos: Different teams (maintenance, production, etc.) maintain separate inventories with poor coordination. One department may over-order what another has already, simply because they can’t see each other’s stock.
- Poor Master Data: Inconsistent part numbers or descriptions (e.g. “motor assy” vs “drive motor assembly”) create duplicate records. Inventory may exist but not show up in reports, leading to redundant orders.
- Unrecorded Movements: Parts moved without updating the system (skipping scans or entries) effectively vanish from the books. They may later be assumed “obsolete” when in fact they are just missing from records.
- Aging without Review: Many organizations never periodically review inventory health. As years pass, slow-moving items quietly accumulate until a big write-off is needed.
- External Disruptions: Changes like new regulations (e.g. banned materials), supplier discontinuations, or economic shifts can suddenly render stock unusable.
Addressing these root causes involves both policy changes and cultural shifts. For example, involving supply chain and engineering together on product changes ensures both demand and spare parts are coordinated. Creating a habit of regular inventory review prevents accumulation by catching problems early.
Steps to Reduce Obsolete Inventory
Reducing obsolete stock requires a structured approach. Below is a set of action steps that can form a roadmap:
- Conduct a Full Inventory Audit:
- Count all parts across locations (warehouses, workshops, stores, and even shop floor bins).
- Reconcile counts against the system. Note items with unexplained surpluses (system deficit) or shortages (system surplus).
- Tag items that have not moved in a long time (e.g. no usage in 12 months) for review.
- Classify Inventory Strategically:
- Use ABC (value-based) and XYZ (demand variability) analysis. Identify which items are high-value but low-demand (AX, AY, etc.) and which are low-value, volatile, or critical.
- Create categories for prioritizing action (for example, “fast-moving critical,” “slow spares,” “obsolete candidates”).
- Focus first on high-value or high-risk parts in slow categories, as these tie up the most capital and risk.
- Analyze Demand and Usage Patterns:
- Review historical consumption data, trends, and forecasts. Separate one-off spikes (like maintenance overhauls) from ongoing demand.
- Identify declining demand for particular parts early. If usage is dropping, avoid ordering more until the pattern stabilizes.
- Optimize Replenishment Policies:
- Set appropriate reorder points and safety stocks per item based on its classification. Fast A-items get tighter controls and smaller buffers; slow C-items have minimal stock or periodic review.
- Consider moving some parts to a “pull” system (Kanban) where downstream lines signal when they actually need stock, rather than pushing orders based on forecasts alone.
- Implement lot-sizing that balances ordering cost with holding cost: avoid batch sizes so large that inventory accumulates.
- Standardize Part Records:
- Merge duplicate part numbers and ensure a consistent naming convention. Maintain one master record per unique item.
- Populate key data fields for each part (supplier, lead time, criticality, alternate parts, etc.). This aids analysis and reporting.
- Improve Cross-Department Coordination:
- Establish regular inventory review meetings involving procurement, planning, maintenance, and warehouse teams. Use shared reports so everyone sees the same data.
- Before placing orders for a part, check all locations for existing stock. Encourage “locate-first” culture: search the inventory system thoroughly, rather than immediately buying new.
- Implement Visual Inventory Mapping:
- Map every storage location in the system, including shelves, bins, racks, and special zones (receiving, inspection, etc.). This tight linkage means every movement has a precise “from” and “to.”
- Arrange stock physically by usage: fast movers close at hand; slow movers grouped logically. Good layout and labeling cut down on parts being placed in the wrong bin.
- Perform Regular Cleanups and Dispositions:
- On a scheduled basis (quarterly or semi-annually), review items flagged in the audit or aging report. For each such item:
- Reallocate: If another site or department can use it, transfer the stock.
- Sell or Donate: Surplus parts may have market value. Explore channels to liquidate (auctions, promotions, charitable donation).
- Scrap: As a last resort, properly dispose of the item. Write it off and learn from the root cause.
- On a scheduled basis (quarterly or semi-annually), review items flagged in the audit or aging report. For each such item:
- Continuous Monitoring and Improvement:
- Track the metrics from earlier (turnover, DOH, percentage of stale items) and watch for improvement.
- Use cycle counts not just to correct stock but to identify error patterns. If certain parts always count wrong, find the underlying issue (e.g. mispicks, system bugs).
- Adjust policies based on results (for example, increase frequency of review for items that keep reappearing as slow-moving).
These steps can be executed in phases. The table below outlines who is typically responsible and what each step achieves:
| Step | Key Players | Goal |
|---|---|---|
| Inventory Audit & Reconciliation | Warehouse & Inventory Team | Identify accuracy gaps and flag old stock |
| Classification (ABC/XYZ) | Planning, Finance | Prioritize parts by value and demand pattern |
| Demand Analysis & Forecasting | Planning, Sales/Marketing | Align inventory with true future needs |
| Replenishment Rules Setup | Planning, Procurement | Ensure order quantities fit real consumption |
| Master Data Cleanup | IT/Inventory Team | Unified part catalog to prevent duplicates |
| Shared Inventory Reviews | All Departments | Synchronize decisions and spot stock transfers |
| Physical Mapping & Layout | Warehouse, Operations | Speed up picking and reduce location errors |
| Stock Reallocation/Disposal | Stores, Planning, Finance | Remove or reuse obsolete parts |
| Ongoing Monitoring (KPIs) | Management, Finance | Track progress and maintain discipline |
Best Practices for Cross-Department Parts Visibility

The foundation of preventing obsolete stock is ensuring that every department has the same view of inventory. Best practices include:
- Single Part Master Data: Maintain one item record per part that all teams use. This “one truth” prevents one department from ordering what another already has. Include helpful data fields (supplier, part attributes) and images if possible, so parts are easily identifiable by anyone.
- Detailed Location Hierarchy: Model your facilities in the system down to the bin or shelf level. For example: Plant A > Building 1 > Storage Room > Rack 5 > Shelf C. Each department should use this same hierarchy. A “main warehouse” label is too vague; technicians need to find the exact bin. A well-structured location tree makes parts quickly findable and highlights where things are stored.
- Map Exception and Transit Zones: Besides fixed storage, map areas like receiving docks, inspection holds, repair areas, and staging lanes. These process locations often house parts temporarily. By giving them explicit names, inventory in transit is still visible. If not mapped, parts in these zones appear “missing.”
- Segment Inventory Intelligently: While ABC is valuable, it should be combined with other factors in manufacturing. For example, categorize parts into:
- Fast-moving consumables: (e.g. standard screws) – ensure frequent replenishment and counting.
- Variable-use production materials: (e.g. specific assembly parts) – keep moderate local buffers.
- Critical spares: (e.g. a $100 valve that can shut down a line) – even if slow-moving, protect with rules (like minimum stock or quick reorder).
- Slow-moving items: (excess or obsolete candidates) – these need tight review or reduced stocking.
Setting clear categories ensures each part is managed according to why it matters, not just its price tag.
- Position Stock by Network Role: Decide which items belong in a central warehouse vs. local plants or on the line. For example, a rare but expensive pump might be kept centrally, whereas a low-cost but line-critical sensor could have copies at each machine. The criterion should be service risk and supply agility, not convenience. This network-level thinking avoids the trap of each plant hoarding “just in case.”
- Tailor Replenishment Methods: Match ordering methods to how parts are used. Steady-demand parts may follow a classic reorder-point system. Parts needed for production schedules should tie into those schedules (MRP or pull signals). Irregular spares might use kanban or even vendor-managed stock. The key is that the replenishment logic fits actual usage patterns so plants don’t start keeping their own undocumented buffers.
- Enforce Transaction Discipline: Every stock movement should be entered into the system. If a bolt is moved from the storeroom to the assembly line, it should be checked out of its bin. If one is returned or found extra, it should be checked back in. Good software tools help with this by scanning barcodes or RFID tags, but human training and accountability make it stick. Visibility is built by tracking changes accurately, not by manual estimates.
- Cycle Counting as a Diagnostic: Make counting stock a regular event, not just an annual chore. Cycle counts can be done daily or weekly for high-use items. Critically, treat counting discrepancies as signals, not just errors to correct. Investigate why each mismatch happened. Did someone forget to scan? Was the part broken? Use this information to fix process gaps.
- Logical Slotting and Layout: Arrange inventory physically with common usage in mind. Store fast-moving or heavy items in locations that are easy to reach. Group related parts. A consistent, intuitive layout means someone visiting any plant can find parts without confusion. Good slotting cuts search time and reduces the chances that someone will put a part in the wrong bin “just because it fits there.”
- Cross-Functional Review Process: Establish a regular rhythm (daily huddle, weekly inventory meeting, monthly review) where all relevant functions look at the same data. Discuss urgent issues like next-day shortages or urgent transfers, and longer-term issues like aging stock or policy changes. Managing by shared numbers turns visibility into action, rather than letting each department cry wolf separately.
- User-Friendly Systems: Ensure the tools are as simple as possible. Label locations clearly, keep mobile scanning tools if possible, and minimize extra steps. A visual mapping interface, where someone sees the layout and can drag-and-drop inventory moves, makes adoption easier. When frontline workers find the system straightforward, compliance (and thus visibility) improves naturally.
These practices complement each other. For example, a detailed location map (strategy above) brings transparency to all zones – the warehouse, the shop floor, the receiving area. Standardized data and shared reviews mean departments stop looking at inventory as theirs and start seeing it as a shared resource. In combination, the steps above create the conditions where obsolete inventory is caught early and kept minimal.
CyberStockroom: Enabling Multi-Department Visibility
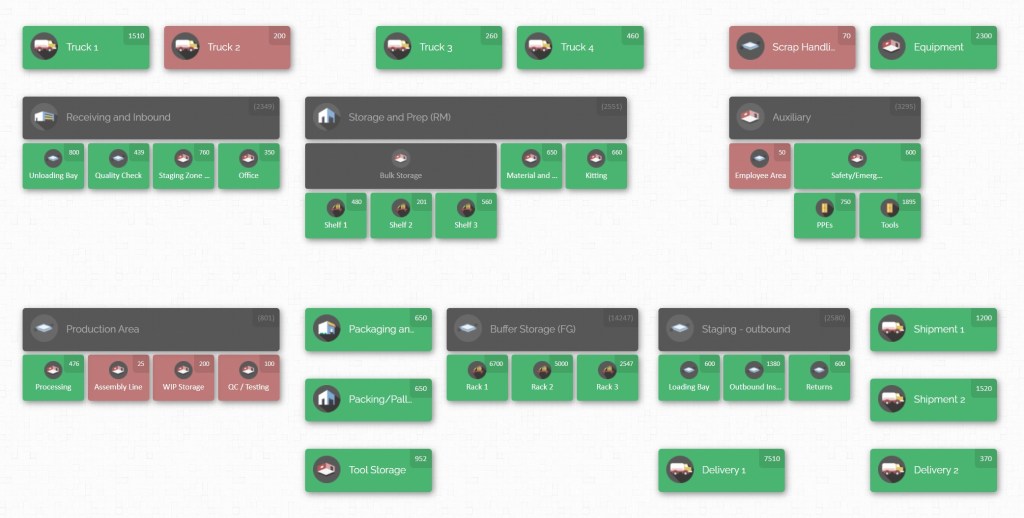
CyberStockroom is an example of a modern, map-driven inventory system that supports the above best practices:
- Interactive Visual Map: It allows building a 2d digital map of the entire operation (multiple plants, buildings, and departments) down to the bin and shelf level. Once this map reflects the real layout, teams can navigate it visually. If Maintenance needs a valve, they can click through the map to locate it. Procurement can see all locations at a glance, reducing the chance of redundant orders.
- Shared Part Database: Each part exists only once in the system. If Production scans in a batch of screws, it updates the same record that Maintenance or Stores will see. Custom attributes (manufacturer, part number, etc.) and even photos ensure that even similar-looking items are distinguished, so teams don’t waste time on guesswork.
- Instant Distribution Views: With CyberStockroom, any user can scan or select a product and instantly see its stock across all mapped locations. This answers the crucial question: “Where else do we have this item?” If one plant is low and another has extra, managers can immediately arrange a transfer instead of ordering new. This visibility closes the gap that often exists in spreadsheet systems where only total quantities are known, not where they physically are.

- Intuitive Transfer & Transactions: Day-to-day movements (receipts, issues, transfers) can be done directly in the map interface or via barcode scanners. A part moved from the receiving dock to a shelf is logged as soon as it’s scanned. Cycle counts and adjustments happen in context: the user clicks into the map’s bin location and performs the count. This reduces entry errors and ensures the record matches reality. Drag-and-drop features let teams move stock between locations with minimal clicks, reinforcing the rule that every item must have a recorded location at all times.
- Flexible Data Entry: When first setting up CyberStockroom, teams can bulk import existing inventory lists via spreadsheets. This accelerates initial cleanup – parts from various branches can be consolidated quickly. Thereafter, standard barcode scanner input is all that’s needed to operate. No specialized mobile app is required; a standard wireless scanner or even a tablet works. This reduces the barrier to getting all teams using the same system.
- Aligning with Best Practices: Importantly, CyberStockroom is not a quick fix but a visual operating layer that reinforces good practices. For example, if a company has already defined special zones (like “repair returns”), those can be mapped explicitly. The system will then insist that stock moves in and out of those zones are tracked. It makes it obvious if people are deviating from the defined workflow. In effect, the tool highlights where procedure lapses occur.

By tying together mapping, location tracking, and stock organization, CyberStockroom translates the theoretical best practices into daily routines. Each department – purchasing, production, maintenance, quality – can trust that the data on screen reflects the true location and quantity of parts. This shared visibility is what turns inventory from a confusing problem into a controlled asset.
Implementation Roadmap
- Assessment & Planning: Start by auditing existing inventory and cleaning up master data (merging duplicate items, correcting locations). Define how you will classify items (ABC/XYZ, criticality) and set target metrics (turnover rates, maximum DOH).
- System Setup & Mapping: Configure the inventory system (e.g., CyberStockroom) with your facility’s layout. Import cleaned item lists. Set up rules (reorder points, min/max levels) based on the earlier analysis.
- Training & Deployment: Train all relevant staff on the new processes and tools. Run a pilot in a single plant or department to identify issues. Then go live in full. Ensure that scanning tools and map navigation are working for everyone.
- Optimization & Control: Gather feedback and fix any workflow snags. Begin tracking KPIs and hold regular review meetings. Use cycle counts to audit the new system and keep refining location accuracy and policies.
This phased approach turns the plan into action. The Gantt chart above shows example dates over about 9 months, illustrating that thorough implementation takes time. However, visible gains (like fewer emergency orders and clearer stock reports) can start within weeks of go-live.
Workflow Example: Reducing Obsolete Inventory
An effective way to see the steps in action is via a simple workflow.
- Identify Candidate Items: Generate a list of parts flagged by aging or low-usage reports.
- Analyze Demand & Usage: Check if usage has truly stopped or if an upcoming project will consume the item. Verify if recorded demand (work orders, tickets) matches reality.
- Classify: Decide if the part is genuinely obsolete or needs redistribution. Use the classification (A/B/C, criticality) to decide how urgently it must be handled.
- Plan Action: Options include transferring stock to another site that needs it, promoting it to other plants, returning to vendor (if allowed), selling off, or scrapping.
- Execute: Carry out the action: record transfers in the system, issue items for usage, or dispose as planned.
- Update Records: Adjust inventory levels in the system to reflect the move or write-off. Ensure the change is documented against the specific locations.
- Review & Improve: Check that the resolution matched expectations (e.g., a planned transfer actually used the parts). Update forecast models or inventory policies to prevent similar obsolete accumulation in the future.
Embedding these steps into regular workflows turns reactive clean-ups into part of standard operations. Over time, following this cycle will shrink the pool of obsolete items and keep inventory aligned with real needs.
Roles and Responsibilities

Inventory visibility is a cross-functional effort. Below are key roles and typical responsibilities in this area:
- Procurement: Coordinates with other departments before ordering. Monitors supplier returns for excess purchases. Tracks costs of obsolete write-offs.
- Production Planning: Shares updated forecasts with procurement and stores. Adjusts build schedules to use existing slow-moving parts first when possible.
- Production/Operations: Reports unused materials from production runs. Avoids “borrowing” parts without logging. Notifies stores of upcoming demand changes.
- Maintenance/Engineering: Identifies critical spares and their usage rates. Communicates design changes that may obsolete certain parts. Helps decide reuse or transfer of parts from retired equipment.
- Warehouse/Stores: Manages the location map. Counts inventory regularly. Issues and receives parts in the system for every movement. Provides reports on stock ages and variances.
- Quality/Inspection: Controls quarantine or inspection locations as mapped zones. Updates status (e.g. “hold”, “release”) in the system for affected parts.
- Finance/Analytics: Tracks inventory metrics and the financial impact of obsolescence. Sets budget allowances for write-offs. Analyzes historical trends to guide policy changes.
- IT/Inventory System Admin: Configures and maintains the inventory mapping system. Ensures data integrity and security. Integrates with ERP or order systems if needed.
Each of these players must use a common platform and process. For example, stores personnel should inform planning immediately if they find unexpected surplus or shortage. Likewise, finance should flag parts with high write-offs so procurement can investigate root causes. Clear responsibility and regular communication (such as monthly inventory meetings) ensure that no department operates in isolation.
Continuous Monitoring and Improvement
Reducing obsolete inventory is not a one-time task. It requires ongoing management:
- Key Performance Indicators: Maintain a dashboard (shared across departments) with metrics like inventory turnover, slow-moving percentage, cycle count accuracy, and emergency orders. Review these monthly.
- Cycle Count Regimen: Integrate frequent cycle counts, focusing on the right classes of parts. Adjust procedures based on variance analysis. For example, if a certain aisle consistently has errors, investigate layout or scanning issues.
- Exception Handling Process: Define how to handle out-of-the-ordinary situations (e.g. a large unplanned scrap, or a rushed part request). Track these exceptions and close the loop with corrective actions.
- Governance Meetings: Establish a cadence (e.g. daily huddle for critical issues, weekly inventory team meeting, monthly strategy session) to keep all stakeholders aligned on current data.
- Training and Culture: Regularly train new team members on the inventory system and procedures. Celebrate inventory improvements (e.g. higher accuracy rates) to reinforce positive behavior.
- Audit and Feedback: Periodically audit adherence to the defined processes. Use findings to refine workflows. For instance, if items still slip into unmapped zones, adjust the system or labels accordingly.
- Technology Updates: Keep the inventory tool updated with new features or reports that can aid visibility. As your operations change (new product lines, facility expansions, etc.), update the digital map and rules to match.
The goal is to make inventory visibility a built-in capability. When teams manage parts as a shared asset using a consistent process and tools, they can prevent wasted stock from re-accumulating. Over time, this leads to a more agile operation: one can see a demand change coming and respond with the right inventory posture, rather than defaulting to simply buying more parts.
Conclusion
Obsolete inventory in manufacturing is ultimately a symptom of misalignment between supply and demand across the operation. The solution lies in disciplined processes and shared visibility. Key actions include standardizing part data, mapping out all storage locations, and recording every movement. Cross-functional communication ensures one department’s excess can become another’s resource before it goes to waste.
Tools like CyberStockroom enhance these practices by providing a visual, map-based inventory system. When everyone uses the same interactive map – with real-time stock levels, images, and location detail – it becomes easy to see what parts are where. This shared picture leads to faster decisions: a buyer sees on the map that a plant already has the needed spares, or an engineer identifies that an unused component sits idle in the stores.
By auditing stock, improving planning, and tightening visibility, manufacturers systematically reduce obsolete items. Capital is freed up, storage space is reclaimed, and workers spend less time searching. Inventory policy shifts from “just in case” hoarding to strategic stocking based on actual need. The result is sustained operational efficiency. Obsolete inventory becomes a rare exception rather than a hidden cost – and teams can focus on keeping the right parts at the right place at the right time.









Leave a Reply