
Cycle counting is a targeted audit process where teams regularly count subsets of inventory rather than performing disruptive full stocktakes. In a busy manufacturing setting, parts and materials move through many departments, making it challenging to know exactly what is on the shelves at any given time. A visual inventory map changes this by providing a clear, interactive layout of all storage locations. For example, the map below shows a CyberStockroom demo inventory layout with different work areas and parts counts. By glancing at this map, a storekeeper or supervisor can instantly see where each item is stored and what quantity is present, helping guide faster, more efficient cycle counts.
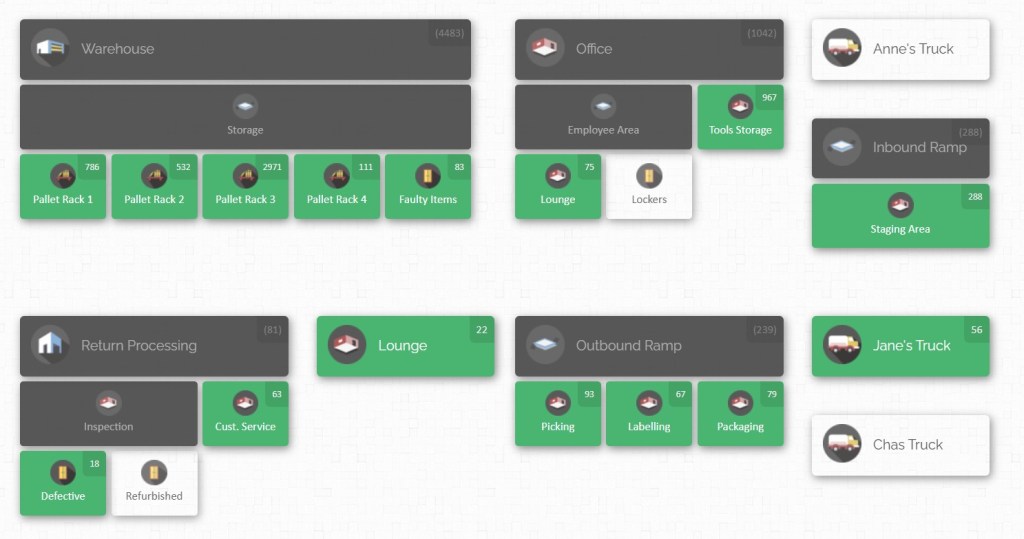
With a comprehensive visual map in place, inventory teams can pinpoint where to count, minimize walking and searching, and reconcile stock levels on the spot. This introduction explains why cycle counting is vital and how mapping can speed up the process in manufacturing environments. It will guide you through best practices for parts visibility, step-by-step cycle counting with a map, and how modern tools like CyberStockroom tie it all together.
Understanding Cycle Counting and Its Importance
Cycle counting is an inventory control technique that involves counting a subset of inventory on a regular schedule. Unlike a full annual stocktake, cycle counts are smaller, more frequent checks of certain items or locations. In manufacturing, this method helps spread the workload throughout the year and keeps inventory records continuously updated. Key advantages of cycle counting include:
- Reduced Disruption: You can count a small section of inventory while production continues, avoiding the shutdown needed for a full audit.
- Early Error Detection: Counting parts often helps catch discrepancies and fix errors promptly, before they snowball into bigger problems or stockouts.
- Improved Accuracy: By regularly reconciling physical stock with system records, your inventory data stays accurate and trustworthy.
- Operational Efficiency: Teams stay familiar with inventory locations and items, preventing the confusion that builds up over time.
A typical cycle counting process might involve these steps: first, plan out what to count and when based on factors like item value or usage rate. Then, review system records to prepare count sheets or task lists. Next, physically count the parts in designated areas, using scanners or checklists to record actual quantities. Any discrepancies between the count and the records are investigated and corrected. Finally, adjust the inventory system to match the real counts and repeat the cycle on schedule. By following a disciplined routine, inventory accuracy improves dramatically.
In manufacturing, where inventories include raw materials, work-in-progress (WIP), finished goods, and maintenance parts, keeping everything straight is critical. For example, a miscounted spare part can halt a production line if technicians can’t find a needed component. Or a production planner might order more of a component that’s actually sitting somewhere else on hold. Regular cycle counts prevent such mistakes by continuously validating the data.
Common Cycle Counting Challenges Without a Visual Map

While cycle counts bring many benefits, they can be slow and error-prone if the underlying system is disorganised. In factories with multiple departments, each team may have its own storeroom, benches, trolleys or holding areas. Without a unified approach, this leads to several problems:
- Lost Time Searching: Counters may wander through racks or ask colleagues for help, trying to locate obscure parts. Without a map or standard layout, walking the floor takes longer.
- Inconsistent Naming: If one department labels a rack “Shelf A” and another calls it “Line 2 cabinet,” the same part might appear under different names. This inconsistency means counters may count the same item twice (at different “locations”) or miss it entirely.
- Hidden Inventory: Items can be moved to staging areas, tool cribs, or workstations but not recorded immediately. A counter looking in the “main store” will not see a part that has actually been taken to the line or holding area.
- False Availability: A planner sees an item marked “in stock,” but half of it may be on a maintenance cart or in quality hold. Without mapping these states, counts will be misleading and orders may be placed incorrectly.
- Fragmented Records: Each department may track parts in its own way (even on spreadsheets), so there’s no single view. This makes scheduling a cycle count complicated – some stock might be counted, some missed, leading to incomplete audits.
- Excessive Walks and Delays: Counters may revisit areas or wait for other teams to finish tasks, extending the cycle counting time.
In short, when inventory locations and parts visibility are fragmented, cycle counts suffer. Teams can spend more time searching than counting, and discrepancies go undetected. The result is slower counts, declining accuracy, and frustrated staff. A visual inventory map remedies these issues by bringing clarity and alignment.
Benefits of a Visual Inventory Map for Cycle Counts
A visual inventory map is essentially a digital floor plan or layout of your storage areas and facilities, overlaid with live stock information. This could cover everything from the main warehouse, to departmental stores, to line-side bins and tool rooms. The map represents racks, shelves, bins, vehicles or zones as clickable areas, each showing the items and quantities held there. In practice, such a map delivers several concrete advantages that directly speed up cycle counts:
- Bird’s-eye Clarity: Managers and counters see the whole operation at a glance. Color-coded locations (for example, green for fully stocked, red for low) make it obvious where to focus. Instead of poring over spreadsheets or wandering aisles randomly, a counter starts with a clear picture of what’s where.
- Quick Part Location: With a search or “x-ray” feature, you can enter an item name or scan a barcode and instantly highlight all locations of that part on the map. This saves the guesswork of remembering where high-use parts are stored. The counter goes directly to those zones without detours.
- Zone-based Counting: You can break the map into sections or zones and schedule counts per zone. For example, one week count all items in the electrical department area, next week the mechanical section, etc. This systematic zone approach ensures full coverage without repetition.
- Reduced Walking: Since the map shows clusters of items, counters can plan logical routes. High-turnover parts might be grouped near the issuing point, so you can knock out the most important counts with minimal steps. Slower-moving items may be placed in deeper aisles. The map helps visualise an optimal layout from the counter’s point of view.
- Immediate Discrepancy Visibility: Many mapping tools update stock levels in real time. If a count reveals an error, you can adjust it right on the map interface. The new data is shared instantly, and anyone looking at the map will see the corrected figures. This avoids backlog corrections and confusion over which count is final.
- Better Coordination: When different departments (production, quality, maintenance, stores) all use the same map, they share a single source of truth. Everyone is counting from the same picture, so there’s no more shouting across the plant asking, “Where is part X really?” Synchronised data keeps each team aligned and reduces duplicate efforts.
- Visual SOP Compliance: A map-based system encourages consistency. Labels on the map match barcode labels on racks or bins, enforcing standard naming. This reduces errors and training time, since anyone can use the map like GPS to find items. It also supports lean principles: anything out of place jumps out visually, prompting immediate action.
By combining these benefits, a visual inventory map greatly compresses cycle count time and effort. Counters spend less time searching and more time counting. Errors get caught on-screen during the count rather than after the fact. Over months of routine counting, the small time savings per cycle add up to a leaner, more reliable inventory process that improves production flow.
Best Practices for Parts Visibility and Organization

Achieving faster cycle counts is not just about using a map – it’s also about how you organize and manage inventory across the plant. The map merely reflects real-world practices. Here are key best practices to ensure those maps (and your counts) stay accurate and efficient:
- Map Every Storage and Touch Point: Don’t limit the map to the main storeroom. Include every place inventory lives or passes through. That means receiving docks, quality-control holds, production line-side racking, maintenance cupboards, material staging areas, overflow zones and return bins. Essentially, every fixed location or temporary holding spot where parts might be for even a short time should be on the map. This eliminates “blind spots” – a planner or counter can see at a glance if some of the inventory is in staging or awaiting inspection, not just on the warehouse floor.
- Define a Clear Location Hierarchy: Structure your map logically from broad to specific. For example, start with buildings or major departments, then break each into rooms or zones, then into aisles, racks, shelves, drawers, and finally bins or slots. The hierarchy should correspond to real costs of misplacing an item – critical or small parts may need bin-level precision, while bulk consumables might only need shelf-level. Consistent addressing (like “Building A > Aisle 3 > Rack B > Shelf 2 > Bin A”) ensures every location is unique. When two teams refer to the same area with different names, the map’s hierarchy forces everyone to use the same terms. This clarity makes cycle counting straightforward because counters know exactly which bin or shelf to count.
- Standardize Labels and Descriptions: Every part and location should have a clear, consistent label in the system. Use unambiguous part names or part numbers that everyone recognises, and ensure units of measure match reality. Likewise, label bins and racks physically to match the map’s names. If the inventory system says “box” and the parts are handled “each,” fix that discrepancy – otherwise count errors will result. Streamline your item catalog by removing duplicates and outdated entries. The goal is that anyone can find any part by name or number with no confusion. Clean, harmonised data between the part descriptions and the map’s location names means a counter won’t waste time second-guessing entries.
- Organize by Logical Grouping: There are two common grouping strategies. One is commodity-based (group similar parts together – e.g. all electrical components in one section, all fasteners in another). This is good for inventory control and side-by-side comparison. The other is equipment-based (keep all parts for one machine or production line together). This helps a maintenance crew quickly get everything they need in one place. Many plants use a hybrid approach: critical or fast-moving items are grouped by velocity or function (to streamline picking and counting), while slow-moving specialty parts may sit with the equipment they serve. Use your map to visualize and enforce whichever grouping makes sense. For example, color-code areas or use icons on the map for different categories of parts. This way, counters know, “Ah, all pneumatic components are in this zone,” and plan their count accordingly.
- Apply Slotting by Usage: Arrange storage locations so that the fastest-moving or most critical parts are closest to their point of use. This is one of the clearest reasons to start with a map: you can literally see where production lines or assembly benches are, and then “slot” high-demand parts in nearby shelves or racks. Conversely, rarely used or bulky items can be placed deeper in the storeroom. This reduces travel time during picking and counting. When a counter hits the most active areas early on, they clear those high-priority counts while still fresh. Slotting also reduces strain or safety risk by placing heavy items in easy-to-reach spots. Remember to update the map whenever slotting changes so the map always shows current locations.
- Use a Unified Inventory System: All teams should work in the same inventory system or platform, not separate spreadsheets or local databases. A cloud-based inventory management system ensures that as soon as any department moves or consumes a part, everyone sees the change. For example, if the maintenance team takes a spare part into the shop and logs it in the system, the updated count appears on the map instantly. This real-time sharing prevents the classic scenario where one planner thinks an item is available while another team has actually requisitioned it. In practice, this means investing in software that ties all sites and departments together. When inventory data is centralised, cycle counts draw from one source of truth – your map.
- Integrate Barcoding and Scanning: Attach a barcode to each item or batch. During receiving, pick, or count operations, use a handheld scanner or device to quickly identify the item. Scanning an item’s code on the map or in the system automatically brings up its location and records movements. This eliminates manual data entry errors. In cycle counts, a counter can scan every item as it is counted; the map can be filtered to show scanned vs unscanned items. This ensures a systematic count and provides an audit trail. If possible, also label each shelf or bin with a unique barcode so that location accuracy is double-checked at scan-time.
- Establish Standard Procedures: Document how to conduct counts and follow them strictly. For example, define whether to count empty bins as zero or ignore them, how to handle damaged packaging, and what to do with obsolete parts. Consistency in process (always counting in the same manner) reinforces the map’s reliability. Train all staff on both physical procedures and the digital map interface. If counters know exactly how to update the map or inventory system on the go, there is no lag between physical counting and the data reflecting that count.
Together, these practices create an environment where a map truly reflects reality. When everything is mapped, labelled and updated promptly, cycle counting becomes faster and more accurate because you no longer have to fight poor organisation.
Using Visual Mapping to Speed Up Cycle Counts

Once your inventory is well-organized and mapped, you can leverage the map directly in your cycle counting process. Here’s a practical approach to using a visual map in each phase of your counts:
- Plan Your Counts by Zone or Category: Start by deciding which sections or categories to count each cycle. Your visual map makes this easy: you can highlight a zone, building or team area and say “this week, we count everything in that highlighted section.” For example, Monday count all items in Receiving and Inspection areas, Tuesday count Conveyor Line storage, and so on. You might also schedule high-value items more frequently, per an ABC inventory approach.
- Assign Teams and Tools: Assign specific counters or teams to zones shown on the map. Because everyone refers to the same map, there’s no confusion about who handles which area. Supply each counter with the right tools – scanners or tablets connected to the map, count sheets synced to that zone, and clear instructions. Make sure they know how to read the map symbols: for instance, a counter should easily identify shelf IDs or bin numbers on the map as matching the physical labels. A well-trained team can use the map display on a tablet to guide them through the area.
- Perform the Physical Count with Map Guidance: As counters move through a zone, they can filter the map to show only the items slated for counting. They physically count each item in the highlighted locations. Using the map, they can tick off each location once counted (many systems allow a “count mode” where counted spots turn a different color). Since the map shows expected quantities, the counter knows what the system thinks should be there before they start counting. If a scanned part’s actual quantity differs from the map, the map or inventory record is updated immediately. If the system shows 10 bolts in Bin A but the counter finds only 8, they enter 8 into the software (or adjust via drag-and-drop) and the map now reflects 8. If they find extra parts, they add them on the spot. This real-time reconciliation means the digital record is corrected as the count happens.
- Investigate and Resolve Discrepancies Instantly: Whenever the physical count does not match the map’s data, the map can help diagnose why. For example, maybe those 2 missing bolts were accidentally moved to another nearby bin. The counter can use the map’s search or “x-ray” function to see if those bolts exist in other locations. Or the system’s transaction history (visible on-screen) might show a recent transfer to Production that wasn’t picked up. Because the map integrates all location info, common causes can be spotted quickly. The key is acting on discrepancies right away, rather than letting mismatches sit until the next full audit.
- Communicate Across Teams: As each department completes its count, they update the map so everyone can see current quantities. For example, the maintenance team counts the spare parts store and adjusts the map. Meanwhile, production sees the updated parts inventory on the map and realises some critical spares are low, prompting a quick reorder before the next breakdown. The map fosters this coordination – one update is immediately visible plant-wide. This teamwork means less duplication of effort (no two teams will try to count the same bin in the same cycle) and smoother communication about stock status.
- Repeat on Schedule and Improve: Use the map to track which zones have been counted and which haven’t, ensuring nothing gets missed. Over time, evaluate if the zones, schedules or priorities should change. Perhaps you notice one area is always found accurate, so you can count it less often. Or maybe a particular section has chronic errors – the map helps highlight that too, indicating a need for process review there. The visual nature of the data makes it easier to adjust your cycle plan for continuous improvement.
By embedding the map into each cycle count, you transform counting from a paper chase into a guided process. As a result, teams can cover more ground in less time and maintain high accuracy. Cycle counts become faster not because you cut corners, but because wasted motion and confusion are removed.
CyberStockroom: Enabling Multi-Department Visibility
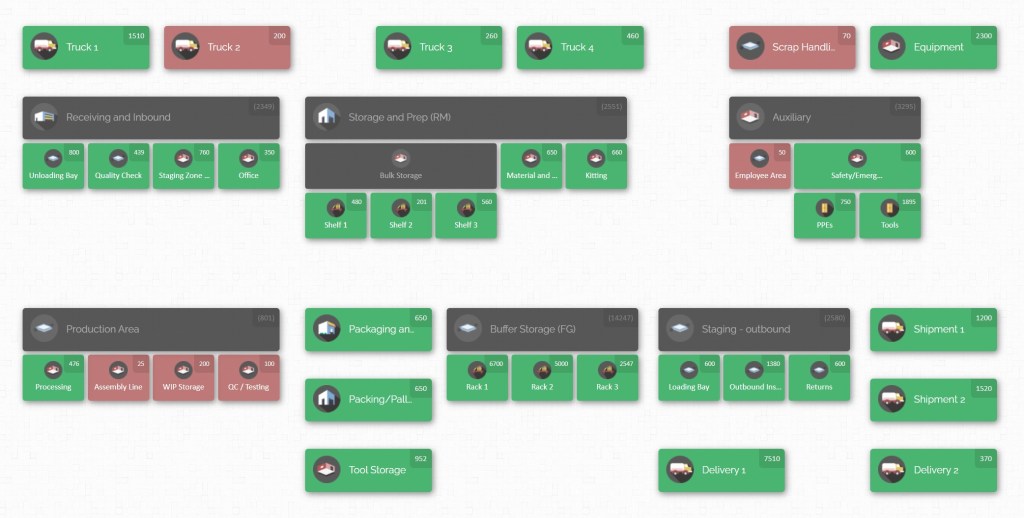
A map is only as useful as the software behind it. CyberStockroom is a cloud-based inventory management system with advanced visual mapping designed to meet manufacturing needs. It unifies all parts across departments into a single interface. Here’s how CyberStockroom’s capabilities tie into the best practices above and help you achieve faster cycle counts:
- Interactive Facility Mapping: CyberStockroom lets you build a live map of your entire plant – from building and floor to room, rack, shelf, and bin. You can mirror the actual layout of your factory. For example, you might map a maintenance storeroom, a quality hold cage, and line-side racks all on the same digital floor plan. With this, every stock location in every department is defined and addressable. When conducting a cycle count, counters navigate this map just as they would walk the floor, clicking through layers from the broad warehouse level down to the exact shelf.

- Real-Time Updates and Cloud Access: Because it’s cloud-based, all users see the current data instantly. When one team makes a change – such as consuming parts or adding new stock – the map updates for everyone. This means that at count time, you know you’re working from the latest numbers. It also means that multiple people can be mapping and counting simultaneously without conflicts. For cycle counts, you might have one user counting Warehouse Zone A while another counts Zone B, all logged into the same system.
- X-Ray Product Distribution View: CyberStockroom includes an “X-ray vision” tool: when you scan or select a part, the system highlights every location where that part exists. This is invaluable during counting. Instead of searching for a part by walking the plant, the counter selects it on-screen and immediately sees a breakdown of its distribution. If a part is scattered among four departmental stock points, the map highlights all four. The counter then physically checks each highlighted spot. This feature saves huge search time when parts may straddle multiple departments or floors.
- Drag-and-Drop Transfers and Adjustments: Moving items on the map is made simple. For instance, if you want to relocate items or correct a count, you can drag the item icon from one location to another. CyberStockroom automatically logs this move as an inventory transaction. Similarly, if a count reveals that bin quantities should be updated, you can click and adjust the numbers right on the map. These intuitive drag-and-drop and in-place edit features streamline the bookkeeping side of cycle counts. They ensure that human adjustments (whether due to a count or a physical transfer) are recorded accurately and quickly.
- Multi-Location and Multi-Department View: If your plant has separate warehouses, offices, or even job site trailers, CyberStockroom can map all of them into one system. This gives you full cross-department visibility. For example, the maintenance department might have its own storeroom building, and production has another. CyberStockroom allows you to see both simultaneously, or to filter by department. This cross-visibility is exactly what solves the “hidden inventory” problem: nothing is truly hidden if it’s mapped in the system. During cycle counts, you can toggle between locations or see summary counts for the same part across locations.
- Support for Barcoding: CyberStockroom supports scanning barcodes. You can generate labels for parts and bins directly from the system. A counter can use a handheld scanner or tablet to scan a part’s code, immediately locating the item on the map and checking its recorded quantity. After counting, scanning again can drop a “recount” mark or open an edit window to update the quantity. This integration of scanning accelerates counts and reduces input errors. It also provides an audit trail – every scan is time-stamped in the system log.
- Inventory Visibility Features: CyberStockroom’s dashboard provides a concise view of stock levels. Alerts for low stock or out-of-stock parts can be configured so that inventory teams know which critical items to count or reorder first. The map can show quick stats (such as total parts in a section). During cycle counting, this visibility ensures that high-priority parts get special attention.

By weaving these features into daily workflows, CyberStockroom embodies many of the best practices we outlined. It encourages consistent location naming (because you define map locations explicitly), it centralises data (through its cloud platform), and it gives the lean visual control that removes guesswork. When using CyberStockroom, cycle counting becomes part of the map interface: teams count on-screen as much as they count on the floor.
Step-by-Step Guide to Faster Cycle Counting with a Map
Putting it all together, here’s a practical workflow for an inventory team in manufacturing to conduct a fast, map-driven cycle count:
- Prepare the Schedule and Map: Review your inventory data and decide on a counting schedule (e.g. daily for A-items, weekly for B-items, etc.). On the inventory map, highlight or note which zones will be counted in the next cycle. If using CyberStockroom, filter the map to the chosen zone and generate a count list if needed. Ensure all team members have access to the map and know which area they are responsible for.
- Gather Tools and Brief Team: Equip counters with scanners or tablets loaded with the map software. Provide them with count sheets or direct them to the on-screen task list. Remind them of any standard procedures (e.g. always scan locations before starting). Assign each person a clear start and end point within the zone to avoid overlap.
- Conduct the Count Systematically: Counters follow the map route through the zone. For each storage location on the map (shelf, bin, cabinet), the counter scans or selects it to confirm it’s counted. Then they count the items physically and either scan each item or enter the count into the system. In CyberStockroom, this action will immediately update the on-screen inventory. If using another map tool, ensure the count gets entered. Work in a logical order (for example left to right by aisle) to avoid missing any areas. Mark locations on the map as “done” once complete, either by checking a box or changing the map view.
- Reconcile Discrepancies Immediately: If the counter’s tally does not match the on-screen quantity, pause to investigate. Use the map’s product distribution view to see if some of the items are recorded elsewhere. Check recent movements in the system for clues. Then adjust the map’s quantity to the correct number. Some software (like CyberStockroom) will also let you add a note or reason for adjustment. This immediate reconciliation keeps your counts accurate and prevents hidden mistakes.
- Collate Results and Update Records: After each zone is counted, review any major discrepancies as a team. Decide if any recount is needed (sometimes a quick double-check by a second person is warranted for high-value parts). Once satisfied, finalise the updates in the system. The advantage of doing this on a unified map is that there’s no need to merge multiple spreadsheets – the system is already updated for all to see.
- Review and Plan Next Cycle: At the end of the cycle count day, look at the bigger picture on the map. Are there any locations where items frequently drift or get adjusted? Make a note to improve processes there (for example, better labelling or relocation). Check if the areas counted were cleared accurately on the map. Finally, schedule the next cycle count of a new zone, using any insights gained (such as adjusting the order of counts to match production schedules).
By following these steps, each cycle count becomes faster and more efficient. The map serves as the guide, checklist and record all in one. Over time, you’ll notice count sessions taking less time as teams become fluent with the map and processes. Any inventory inaccuracies become smaller and easier to fix, boosting overall throughput on the shop floor.
Key Takeaways
- Visual Maps Reduce Count Time: Seeing inventory laid out on a map turns searching into sight-reading. Counters find items fast and count only what’s needed.
- Cross-Department Visibility is Crucial: Map every storeroom, staging area and stock point. Only with a unified view can different teams avoid duplicating counts or missing items.
- Standardised Setup Pays Off: Consistent labels, grouped storage and slotting by demand mean less confusion during counts. Your map reflects these standards, making counts straightforward.
- Use the Right Tools: Employ a cloud-based inventory system with mapping features. Choose one that offers product distribution views, easy scanning and direct count adjustment. This streamlines the manual work of counting.
- Integrate Maps into Routine: Make the map central to your counting process – plan by map zones, count along map routes, and update via the map. When the map is the system of record, cycle counting becomes faster and more reliable.
- Continuous Improvement: After each cycle count, use what you learned to tweak storage layouts or procedures. The goal is to reduce walking and counting effort each time. The map will clearly show where further gains can be made.
In summary, combining good inventory organisation with a visual mapping system transforms cycle counts from a slow chore into a smooth, efficient routine. Inventory teams in manufacturing can achieve full parts visibility across departments by adopting these practices. A tool like CyberStockroom embodies these principles, providing an intuitive map interface that unites your inventory data. By leveraging visual inventory maps, you unlock faster counting, higher accuracy, and stronger collaboration – enabling your operation to run at peak efficiency.









Leave a comment