
In complex industrial and manufacturing environments, inventory teams often struggle to answer fundamental questions like “How many of this part do we have, and where is it?” This challenge becomes especially acute when multiple departments – production, maintenance, procurement, quality, and engineering – each need visibility into shared stock. Without clear visibility, companies waste time searching for parts, carry excess inventory “just in case,” and suffer production delays from missing items. An advanced approach to solving these challenges is to combine strategic inventory classification with robust, map-driven inventory visibility.
This article shows how to use ABC-XYZ analysis – an advanced classification method – to prioritize and organize parts, while adopting best practices that improve parts visibility and alignment across every department. We will explain each step of ABC-XYZ categorization, how to integrate it into inventory policies, and how modern visual inventory mapping tools tie it all together. By the end, you’ll understand how an industrial inventory strategy combining data-driven classification and shared visibility can drive efficiency, accuracy, and cross-team collaboration.
Understanding ABC and XYZ Classification
ABC-XYZ analysis is a two-dimensional matrix that combines ABC classification (based on item value or usage) with XYZ analysis (based on demand variability). This creates nine categories (e.g. AX, AY, BZ, etc.), each guiding how you stock and manage parts. The goal is to focus resources and set policies that fit both the importance of the part and the predictability of its demand.
ABC Classification (Value-Based Segmentation)
ABC classification segments inventory into three groups (A, B, C) according to the item’s economic importance – usually measured by annual consumption value (for example, units sold or used multiplied by cost). The guiding principle is the Pareto rule: a small fraction of items often account for the majority of usage or cost. For example, about 20% of parts might represent 80% of total consumption value. These A-items are high-priority: stocking out of them would have the greatest impact on operations, so they deserve the most attention and tighter control.
In contrast, C-items typically make up the bulk of unique SKUs (often 50–60% of part numbers) but account for a small share of value or usage (often around 5–10%). These items move slowly or in small quantities. C-items are important to have on hand (to prevent delays for any unique part), but managers treat them with lighter controls: looser stocking levels and less frequent review. B-items fall in between (about 20–30% of SKUs and 10–20% of consumption).
A typical way to determine the categories is:
- Step 1: Calculate each part’s total annual usage value (e.g. units used × unit cost).
- Step 2: Sort all parts by descending value.
- Step 3: Compute the running total of value and find the cutoffs (commonly, the top ~70–80% of value becomes A-items, the next ~15–20% becomes B-items, and the remaining ~5–10% becomes C-items). These thresholds can be adjusted for your operation, but the idea is to define a small set of A parts that drive the majority of spending or usage, versus a large set of C parts that contribute little individually.
In practical terms, once you have an ABC list, inventory policies focus on A-items first. For example, you might ensure very high service levels on A-parts (e.g. stock enough to fill orders almost all the time) and review their stock weekly, while C-parts might be checked monthly with much looser stock targets. ABC classification alone is a good start because it identifies the parts worth the most investment. However, ABC by itself does not capture how predictable demand is – an A-item could be extremely stable or very erratic.
XYZ Classification (Demand Variability)
XYZ analysis evaluates each part’s demand stability or predictability over time. An item’s demand can be highly consistent, somewhat variable, or very irregular. The XYZ categories typically mean:
- X-items: Demand is very stable. Usage varies little from period to period, so future demand is easy to forecast with confidence.
- Y-items: Demand has some variability, but there are known patterns (such as seasonal peaks or planned events). Forecasting has moderate reliability if those factors are accounted for.
- Z-items: Demand is highly erratic or intermittent with no clear pattern. Future demand is hard to predict.
To determine XYZ classes quantitatively, a common method is to calculate the coefficient of variation (CV) of demand for each part over a relevant period (often 1–2 years of data):
CV = (standard deviation of demand) / (mean demand).
- A low CV (for example, ≤ 0.25) indicates very little variation (an X-item).
- A moderate CV (say 0.26–0.50) indicates some fluctuation (a Y-item).
- A high CV (> 0.50) indicates erratic swings (a Z-item).
Other rules of thumb work too, such as labeling the top 80% most stable as X, next 15% as Y, and bottom 5% as Z by cumulative variation. The exact cutoffs can be tuned to your business, but the concept is consistent: X is stable, Z is unpredictable.
Categorising by XYZ guides forecasting and safety stock. For stable X-items, forecasts are reliable so managers can carry lower safety stock or simply rely on planned replenishment. Y-items need more caution – known factors (like seasons) can help planning, but it’s wise to have a bit of extra buffer. Z-items, being unpredictable, typically require the most conservative approach if kept in stock at all; often companies may use different strategies (for example, smaller batch orders, higher safety stock, or even just-in-time ordering) to avoid large surprises.
The 9-Box ABC-XYZ Matrix
Combining ABC and XYZ classes creates a 3×3 matrix of nine categories (for example, AX, AY, AZ, BX, BY, BZ, CX, CY, CZ). Each combined category has distinct characteristics that suggest how the part should be managed. A concise way to visualize this is a grid:
| X (Stable) | Y (Variable) | Z (Erratic) | |
|---|---|---|---|
| A (High Value) | AX: High-value, stable demand | AY: High-value, seasonal | AZ: High-value, erratic |
| B (Mid Value) | BX: Mid-value, stable demand | BY: Mid-value, variable | BZ: Mid-value, erratic |
| C (Low Value) | CX: Low-value, stable demand | CY: Low-value, variable | CZ: Low-value, erratic |
- AX (A-item, X-demand): These are the “gold” of your inventory – top revenue or usage parts with very reliable demand. They deserve the highest focus because they drive your operation, but their stability means you can plan tightly. Typically companies set very high service levels for AX items (e.g. fill 98–99% of orders), manage them closely (e.g. daily or weekly review), but can hold relatively lower safety stock since demand is predictable.
- AZ (A-item, Z-demand): High-value items, but with highly erratic consumption. These pose the biggest risk: if an AZ item is out of stock, it hurts a lot, and you also can’t easily forecast when you’ll need it. The typical response is to keep more buffer stock for AZ parts or implement advanced forecasting methods (such as intermittent demand models). They may be reviewed frequently (monthly) and replenished proactively.
- BX (B-item, X-demand): Medium-value parts with stable usage. Service level targets and planning frequency can be moderate (for example, 95% fill, monthly reviews). Safety stock might still be based on statistical methods but can be smaller since demand is steady.
- BZ (B-item, Z-demand): Medium-value, unpredictable parts. Service can be lower (e.g. 90% fill) and review less frequent (e.g. quarterly), since neither value nor predictability is strong. Many companies treat BZ items with leaner controls – perhaps ordering to a minimum or leaving them on special order if needed.
- CX (C-item, X-demand): Low-value but steady parts. Demand is easy to forecast but the cost is low, so it makes sense to order larger quantities for economy (bulk buys) and lower the service target (maybe 90% fill). These might be reviewed infrequently (quarterly).
- CZ (C-item, Z-demand): Low-value, erratic parts. These are the least critical: they seldom move, and when they do it’s random. Often companies hold minimal stock (possibly even none, or just one unit), and use simple reorder rules when they do sell. If space or effort is tight, CZ items might be delegated to vendor-managed inventory or “drop ship” rather than stocking at all.
In practice, inventory and planning teams will map every part to one of these nine cells, then apply a policy matrix. For example:
- High priority for AX/AY: Ensure ample stock, fast replenishment, highest service levels.
- Buffer for AZ: Add extra safety stock or frequent orders to avoid shortages of critical volatile parts.
- Standard controls for BX/BY: Regular reorder points and periodic review.
- Lean for CZ/CY: Order only when needed, accept occasional stockouts to avoid overstock on low-value parts.
This combined approach is more sophisticated than ABC alone. ABC alone might allocate a lot of stock to all A-items, but ABC-XYZ might reveal that some A-items (the AZ category) actually deserve even more buffer, while A-items with X-demand can be managed leaner. Likewise, for low-value parts, CZ items might not need much space if they move so rarely. Overall, the 9-box helps you tailor inventory strategy for each part type.
Implementing ABC-XYZ Analysis: Step-by-Step

Putting ABC-XYZ into practice involves data analysis and systematic updates to inventory parameters. Below is a step-by-step how-to guide:
- Gather Historical Data: Collect at least 12 months (ideally 24+) of usage history for each part (units used and associated costs). Include both on-hand inventory and turnover records. Ensure data is clean: correct part codes, updated costs, no duplicate SKUs.
- Calculate ABC Categories:
- Compute each part’s annual consumption value (units × cost or revenue).
- Sort parts in descending order by consumption value.
- Calculate the cumulative percentage of total value.
- Determine cut-off thresholds. For example, designate the top ~70–80% of cumulative value as ‘A’ items, the next ~15–20% as ‘B’, and the remaining ~5–10% as ‘C’. (Exact percentages can be tuned; the goal is clearly separating top-tier items from the rest.)
- Label each part as A, B, or C accordingly.
- Calculate XYZ Categories:
- For each part, compute the coefficient of variation (CV) of its demand. This is done by taking the standard deviation of monthly (or weekly) usage and dividing by the average usage.
- Sort parts by CV. Determine logical breakpoints for X, Y, Z. A common approach: CV ≤ 0.25 as X (stable), 0.26–0.50 as Y (moderately variable), and >0.50 as Z (highly variable). You can adjust these ranges based on your industry norms (for example, construction parts may tolerate higher CVs).
- Label each part X, Y, or Z accordingly.
- Combine into Composite Codes: For each part, append the two labels. For example, if Part #123 was an A in value and has a CV of 0.10 (X), its composite code is AX. If Part #456 is B in value with CV 0.60, it’s BZ. Maintain this in your inventory database or ERP so planners can easily filter by code.
- Assign Stock Policies: Using the ABC-XYZ matrix, define inventory policies for each composite category. Typical parameters to set include:
- Service level or fill rate targets (e.g. 98% for AX, 90% for CZ).
- Reorder frequency (how often the part is reviewed or ordered; e.g. weekly for A items, quarterly for C).
- Safety stock formulas or buffers (AX might use statistical safety stock; AZ might add an extra buffer; CZ might use fixed minimal stock).
- Reorder point or order quantity (based on lead time and demand rate for stable items; based on a multiplier for variable items).
These parameters ensure that inventory control reflects the item’s importance and predictability.
- Update Inventory System: Enter the ABC-XYZ codes and associated policies into your inventory or ERP system. This might involve adding custom fields (e.g. “ABC Class” and “XYZ Class”) and using them in reorder point calculations or reports. Automate where possible: for instance, some systems let you define safety stock formulas by category.
- Communicate Changes: Share the new classifications and policies with cross-functional teams – purchasing, production planning, warehouse, maintenance, etc. Make sure everyone understands why policies differ by category. Document the system: for example, “AX parts are reviewed monthly with a 98% service target, while CZ parts are reviewed yearly with a 75% target.”
- Monitor and Refine: After implementing, track the results. Typical steps include:
- Compare planned service levels to actual fill rates for each category (are we meeting our targets?).
- Review inventory turns and investment by category (are A items being managed tightly?).
- Audit a sample of parts to verify they’re correctly coded.
- After a replenishment cycle or two, adjust if needed (for instance, if many AX stockouts occur, maybe safety stock should be higher).
- Refresh the analysis periodically. Demand patterns and values change over time, so re-run ABC-XYZ (especially for A-items) on a monthly or quarterly basis to catch changes.
By following these steps, you systematically classify inventory and tie each part to an appropriate level of control. This ensures that high-impact parts get special attention and that unpredictable parts are treated with extra caution.
Setting Inventory Policies by ABC-XYZ Category

Once parts are classified, the next step is to apply policies. Here are guidelines for each category:
- AX (High-value, Stable demand): Target extremely high availability (e.g. 97–99% fill rate). Review frequently (weekly or even continuous monitoring). Order in smaller, frequent lots. Because demand is predictable, you can set tight reorder points and calculate safety stock with statistical methods. Aim to minimise excess stock, since stability means you won’t be caught off-guard.
- AY (High-value, Moderate variability): Also critical to have on hand (perhaps a 95–98% service rate). Review monthly. Demand has some seasonality or trends, so use forecast buffers (e.g. add a lead-time cushion or seasonal adjustment). These may carry moderate safety stock or planned pre-orders around expected peaks. Still treat them as A-level priorities, but acknowledge the extra variability.
- AZ (High-value, Erratic demand): These are the trickiest. Maintain high service targets (90–95%) but accept that frequent stockouts can occur if you under-stock. To mitigate risk, either hold significant safety stock (costly, but prevents downtime) or use specialized forecasting (e.g. Croston’s method for intermittent demand). Review them often (monthly). Communication is key: let planning and procurement know in advance when usage happens unexpectedly, and perhaps trigger emergency orders if possible. The goal is to avoid backorders on these valuable parts, but budget allowances must recognize their volatility.
- BX (Mid-value, Stable demand): These have regular usage but aren’t business drivers. A typical strategy is moderate stock levels with service goals around 95%. Review at medium frequency (monthly or quarterly). Order larger lots (if volume discounts apply) and rely on reorder points based on steady demand. Safety stock can be smaller than A-items because even if a BX stockout occurs occasionally, it’s less critical.
- BY (Mid-value, Moderate variability): Service targets can be slightly lower (90–95%), with quarterly reviews. Keep enough stock to cover normal usage and some buffer for seasonal peaks. Some companies treat BY items much like BX, but perhaps hold a bit more safety to accommodate known fluctuations.
- BZ (Mid-value, Erratic demand): These are lower priority. Service levels might drop to ~90% or even lower. Reviews can be quarterly or biannual. Often a min-max system is appropriate: when stock falls to a predetermined minimum, order up to a fixed maximum. Alternatively, these may be made “special order” where stock isn’t carried regularly but is procured on demand. The key is to avoid tying up working capital on unpredictable parts that aren’t worth an emergency stockout cost.
- CX (Low-value, Stable demand): These parts seldom break the bank, so companies often focus on order cost efficiency. A service level around 90% can be fine. Because demand is regular, you might consolidate purchases (order in bulk to save cost) and keep simple safety stock. Reviews can be quarterly or semi-annually.
- CY (Low-value, Moderate variability): Service targets are low (85–90%). These parts are ordered infrequently; manage with min-max or Kanban. Safety stock is minimal, just enough to cover typical usage swings. Some companies may place these on less frequent review cycles (every 6–12 months), or incorporate them into bulk orders of similar parts.
- CZ (Low-value, Erratic demand): These often have minimal or no stock. Service level targets can be quite low (e.g. 75–85%). Many organizations choose not to stock most CZ items at all; instead, they order them only when needed (which risks a delay but the cost impact is small). If a few CZ parts are nonetheless kept on shelf, expect very little safety stock and long order intervals.
In summary, service level and safety stock decrease as you move from A to C or from X to Z. The highest priority (AX) items get nearly full attention, whereas the lowest (CZ) get the bare minimum. Implementing ABC-XYZ means each part’s reorder frequency, order size, and safety stock formula is tuned to its position in the matrix.
Best Practices for Multi-Department Inventory Visibility

Achieving the potential of ABC-XYZ classification requires good data and collaboration across departments. The following best practices ensure that parts and inventory are visible and managed consistently throughout the organization.
- Use a Centralized, Unified Inventory System: Adopt a single inventory management platform or database that all departments share. When procurement, stores, production, and maintenance log inventory movements and counts into the same system, everyone has a unified single source of truth. This avoids “shadow inventories” in departmental spreadsheets. For example, if the production team uses one database and maintenance uses a different spreadsheet, parts might be lost or double-ordered. Centralization ensures everyone sees up-to-date stock levels. Modern cloud-based systems excel at this: inventory entries made on the shop floor (via barcode scanning) immediately update stock quantities for all. A centralized system spans warehouses, production plants, tool cribs, and laydown yards, aggregating all parts data in one platform.
- Implement Real-Time Tracking: The faster inventory transactions update the system, the more accurate visibility is. Deploy barcode scanning at every touchpoint: receiving, put-away, picks, production usage, and shipping. Ideally, a worker scans a part’s barcode or enters a transaction at the moment it moves. This instant update prevents old information. For critical or high-volume environments, RFID tagging can further automate tracking (bulk-reading many tags as material passes checkpoints). By contrast, manual counting or batch updates (once a day) invite errors and blind spots. Real-time tracking means that at any moment, a planner can pull up a report or dashboard and see current stock levels by location, rather than relying on outdated reports. This practice vastly reduces discrepancies and increases trust in the data.
- Standardize Part Numbers and Labelling: Consistency in identifiers is crucial. Ensure every part has a unique, standardized code or SKU across all departments (including vendor parts, spares, and raw materials). All locations (racks, bins, vehicles, yard areas) should also have unique IDs and labels. For instance, label each aisle and bin clearly and use those labels in the system. This way, when parts are received or moved, staff can scan “from bin A5 to bin B3” and the software knows exactly where inventory resides. Standard labelling avoids confusion that arises when two teams use different names or abbreviations for the same part. In addition, standardize processes: every receiving shipment is checked against purchase orders and entered via barcode; every production usage is scanned out of inventory. When everyone follows the same steps, items don’t “fall off the radar.” Document these procedures in an SOP manual so that whether a technician is in Maintenance or a clerk is in Shipping, they all follow the same routine.
- Conduct Regular Cycle Counts and Audits: Even with good processes, real life drifts. People misplace items, data entry errors happen, and theft can occur. To catch and correct errors before they compound, perform routine cycle counts. Instead of one massive annual count, cycle counts target subsets of inventory on a schedule (for example, each week count 5–10% of items in different zones). Use the ABC principle here: count A-items more frequently (perhaps weekly or monthly) and C-items less frequently. When doing a cycle count, compare the physical count to the system count. Any discrepancy should be investigated immediately. Perhaps a part was mis-scanned or a location mis-entry occurred. Correct the system to match reality. Over time, cycle counting helps maintain the underlying accuracy of inventory data. A system with a map makes cycle counting easier: you can pick a bin on the visual map and count everything in it, then verify on screen. Scheduling counts regularly ensures that the digital record remains reliable – and inventory accuracy itself is a key performance metric (target e.g. 98% or higher accuracy).
- Visualise Inventory with Maps and Dashboards: A powerful best practice is to go beyond lists and use visual dashboards. Imagine logging into a floor plan or map view of your warehouse or yard and seeing colour-coded indicators showing where stock is low, or how many pieces of each part are in a given zone. This visual approach makes it easy for any department to grasp inventory status at a glance. For example, an interactive map might highlight parts below their reorder point in red, or flag that one aisle is overstocked while another is empty. Modern inventory platforms allow building custom dashboards: you might have a map of your shop floor divided by department or function (e.g. Machine Shop, Assembly, Maintenance stores), with each showing live quantities. This bridges the gap between the digital data and the physical world. Instead of reading long spreadsheets, teams see the warehouse “as a picture.” For planning meetings, such visuals ensure everyone – from engineers to storekeepers – is on the same page about what’s available where.
- Integrate Lean Practices and Cross-Functional Routines: Improving parts visibility often aligns with lean principles. Apply visual management and 5S in storage areas (for example, use shadow boards for tools, mark zones with signs, use kanban signal cards for replenishment). If each department uses kanban cards tied to actual mapped locations, inventory flow becomes self-regulating: a kanban at a machine pulls exactly the needed part from a known location. Lean also emphasizes cross-functional communication. For example, include maintenance, production, and stores in joint inventory review meetings. Use value stream mapping (VSM) exercises to highlight where inventory information flow is breaking down between departments (e.g. Production may think a part is on-hand, but Maintenance actually took it). Strive to create “one version of the truth” – if that means setting up shared scans or alerts that inform all teams, do it. Ultimately, when every team trusts the same inventory data, decisions (when to order, when to schedule maintenance, what production is possible) are made faster and waste is reduced.
- Train and Empower Your Team: Visibility is also about people. Ensure all employees are trained on the inventory system and processes. Make sure they understand the why: for example, explain to floor staff that scanning every received part into the system (even in a rush) prevents an urgent stockout later. Encourage staff to take ownership – empower a line supervisor or storekeeper to suggest process improvements if they see repeated problems. Knowledge sharing is important: maintenance should know how production planners classify parts (and vice versa), so that reorder triggers are set appropriately. In short, foster an inventory-conscious culture: when maintenance techs, purchasers, and shop floor leads all value accurate inventory data, they will follow best practices by default.
- Use Data Analytics for Continuous Improvement: Finally, track metrics and use them to refine both classification and processes. Key metrics include inventory accuracy (how often system records match physical counts) and order fill rate (the percentage of orders filled from stock). If accuracy dips, investigate root causes (perhaps a process lapse in recording). If fill rates for AX items fall, revisit safety stocks or lead times. You can also track inventory turn (annual usage divided by average inventory). ABC-XYZ helps here: monitor turns by category to ensure you’re not overstocking low-priority parts or understocking critical ones. Many inventory systems have built-in reports; schedule regular reviews of these KPIs with your cross-functional team. Use the insights to tweak reorder points, change suppliers, or even reclassify parts if demand patterns shift. Treat multi-department inventory management as an ongoing optimization: always look for opportunities to balance inventory cost against service level, and involve all stakeholders in those discussions.
By combining these best practices – unified systems, real-time tracking, visual management, lean coordination, and continuous data review – you can achieve full parts visibility across departments. Every team will have quick access to the same inventory information, so nobody wastes time “looking for” parts that are actually in another building, and duplicative orders or firefighting are minimised. Above all, operations become more efficient and agile, because inventory flows smoothly as one integrated process rather than fragmented pockets.
Enhancing Visibility with CyberStockroom
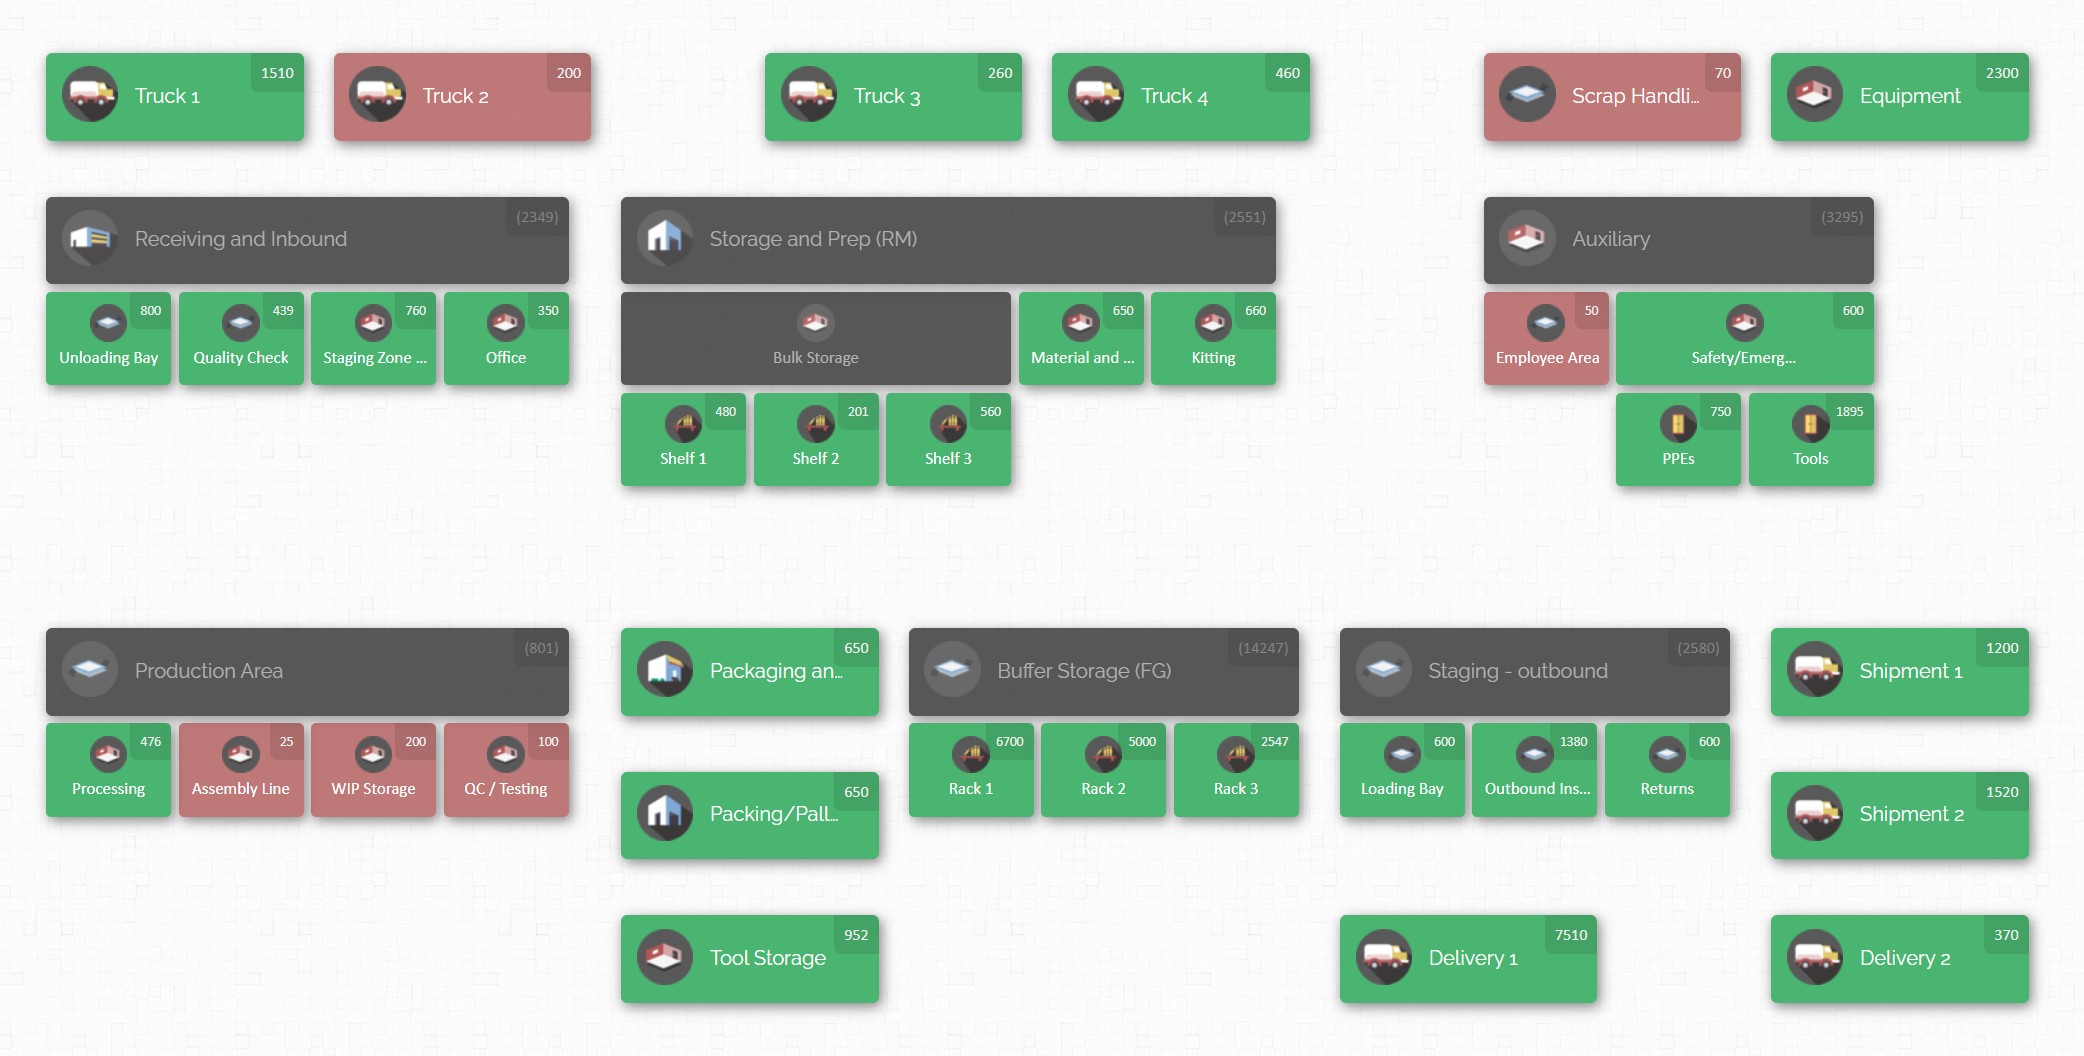
Modern software can make all the above practices concrete. For example, CyberStockroom (a cloud-based inventory mapping platform) is designed precisely to give teams a shared, visual picture of inventory across multiple departments and locations. Its features illustrate how technology supports the principles we’ve discussed:
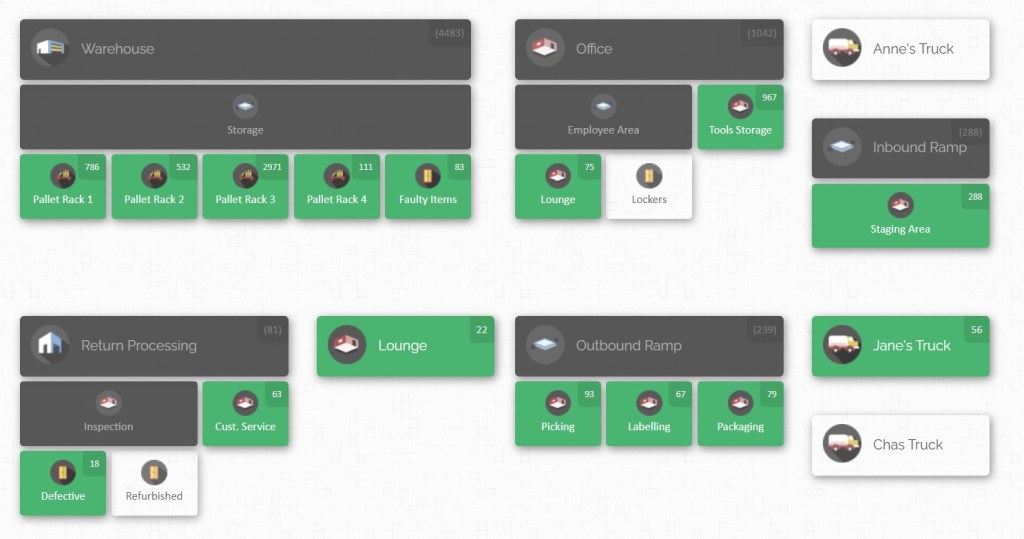
- Interactive Map-Based Layout: CyberStockroom lets you create a digital replica of your physical space – drawing out buildings, storage zones, aisles, racks, bins, yard zones, tool rooms, etc. Each location on this map can be defined to match your actual layout. When every inventory location is mapped, the system becomes intuitive: you click on “Racking A – Bin 5” and immediately see what’s stored there. This mapping approach means that all parts have fixed places on the map, so nothing is “lost.” For multi-department use, the same map can span the whole plant (or even multiple plants), so every department sees the exact same layout. This visual interface directly supports standardisation: if each storepoint is clearly labelled on the map, everyone records inventory movements with those exact location names.
- Cloud-Based Central Dashboard: Because CyberStockroom is cloud-hosted, all users in different departments or locations log into the same live dashboard. A planner in Purchasing, a technician in Maintenance, and a foreman on the floor all see the same real-time map and stock counts. This centralisation eliminates data silos. For example, if Production issues components out of one warehouse, Stores and Maintenance instantly see the reduced quantity on their screens. This ensures cross-functional alignment: teams aren’t relying on last week’s spreadsheet or secondhand emails – they’re all working from one up-to-the-minute system.
- Real-Time Inventory Updates via Scanning: CyberStockroom supports barcode scanning to update inventory at the moment of movement. When a part is received, the clerk scans it and drops it on the map in the new location. When a technician picks parts for a job, scanning or “dragging” them from the bin on the map to the work order deducts them instantly. These real-time updates feed everyone the latest data. In practice, this means that if Maintenance updates the software when using a part, Production planning immediately sees the new on-hand level. By minimizing manual lag, scanning keeps the database in sync with the factory floor.

- Drag-and-Drop Transfers: Instead of paperwork or menus, CyberStockroom’s interface lets users simply drag items from one map location to another. For example, if a batch of bolts needs to move from the Main Store to the Maintenance closet, a user could click on those bolts on the map and drag them to the closet location. This action is logged as a transfer. The simplicity of drag-and-drop helps enforce standard processes: it’s the digital equivalent of physically moving a box from one bin to another – except the system updates the counts immediately and records who moved it and why. This visual transfer feature accelerates intra-plant logistics and keeps cross-team transfers transparent (everyone can see those items moved on the shared map and note the comments attached).
- Multi-Level Location Hierarchies: The software supports nested locations. You can define structures like Warehouse → Aisle → Rack → Shelf → Bin. This means inventory can be tracked as precisely as needed. In a manufacturing setup, you might have floor, cabinet, and rack levels. Everyone uses the same hierarchy, so there is no confusion (e.g., one department won’t call something “Spare Shelf 3” while another calls it “Tool Room Bin 7”). Clear location hierarchy makes reports and counts straightforward.
- Attach Images and Notes: To improve clarity, items or locations can have documents attached. For example, if a bin contains critical spares, you might attach the safety data sheet or maintenance procedures. This way, any user clicking on that bin in the map has helpful info at their fingertips. For cross-department use, this means a quality inspector or maintenance lead sees the same supporting details as the stores clerk – ensuring everyone interprets location contents the same way.
- Audit Support and Reporting: Built-in reports and logs help with audits. Every inventory movement entered is timestamped and user-attributed. If production planners run a cycle count, the system’s map and history make it easy to verify counts by location. Automatic reports can list items by ABC-XYZ class, by department usage, or highlight discrepancies found in audits. For leadership, a report might show overall inventory accuracy or on-hand value per department. These tools support continuous improvement: teams can track how well practices are being followed and where gaps remain.

In summary, CyberStockroom embodies the principles of full inventory visibility. It provides a single, shared view of the physical inventory. If one department needs to know whether a component is available, they literally look at the same map as everyone else and see the answer. By linking inventory data to the physical layout, it enforces location discipline: every part is tied to a spot on the map, so misplacement is visible. The outcome is that cross-functional teams stay coordinated: Purchasing knows if Production is running low on parts, Maintenance knows what stores are in case of emergency, and Management has the bird’s-eye view.
Continuous Improvement and Metrics
An advanced inventory classification and visibility strategy is not a one-time project but an ongoing cycle of improvement. Keep the momentum by regularly reviewing performance metrics and refining your approach:
- Inventory Accuracy: Continuously track how often your system quantities match physical counts. High accuracy (95–99%) is the foundation of visibility. If accuracy slips, use root-cause analysis: was it a missed scan, a data entry error, or a process gap? Apply corrective action (like refresher training) before the error propagates.
- Service Levels and Fill Rates: Monitor the fill rate for each ABC-XYZ category. If AX items miss orders, adjust safety stock or lead times. If CZ items are constantly ordered but infrequently used, consider moving them to non-stock status. Metrics should confirm that critical items have the promised availability.
- Inventory Turns: Calculate turns (cost of goods used / average inventory on hand). Target higher turns for B/C items (since they cost less to stock) while A-items may turn slower by necessity. If turns are low for a category, examine if there is excess stock on hand or lower-than-expected usage (perhaps demand patterns changed).
- Carrying Cost vs Stockout Cost: Evaluate the trade-off made by the classification. Use the data to adjust if policies are too conservative (too much capital tied up) or too lax (frequent rush orders). In practice, this means checking actual carrying costs (capital, space, obsolescence) against the cost of not having stock.
- Cross-Department KPIs: Involve all teams in reviewing metrics. For example, in a monthly operations meeting, review a shared inventory dashboard: on-hand levels, days of supply for critical parts, number of emergency orders, and departmental stock status. Seeing these KPIs together reinforces alignment.
- Feedback and Reclassification: Allow each department to flag anomalies. For instance, if Maintenance sees that an AX-part’s demand is shifting (maybe due to design change), they should communicate so the part’s category can be updated. As products and processes evolve, some items will shift categories. Schedule periodic reclassification sessions (such as quarterly for A-items, semi-annually for all others) to keep the ABC-XYZ analysis current.
In short, the combination of careful ABC-XYZ analysis and full visibility creates a virtuous cycle. Visibility tells you if your plans worked (did items really end up where you thought they would?), and classification tells you what should change if they didn’t. By routinely measuring and refining, inventory becomes tighter, more accurate, and better aligned with the business’s true priorities.
Conclusion
Advanced inventory classification with ABC-XYZ analysis helps manufacturers get laser-focused on the parts that matter most, while allocating resources efficiently across the rest. When paired with strong visibility practices – like a unified system, real-time tracking, and shared maps – it transforms inventory from a dark, scattered problem into a clear, manageable operation. Every department speaks the same inventory language: if production needs stock, warehouse knows immediately; if maintenance requires a rare part, everyone can check the central dashboard for its status.
The end result is an inventory management approach that is proactive, transparent, and precise. Critical A-items stay in stock when needed, volatile Z-items are handled carefully, and every team knows exactly what’s on the floor and what’s on order. By using data (the “ABC” and “XYZ” metrics) and technology (interactive maps and scans), you achieve full parts visibility and cross-functional alignment. This drives operational efficiency (no more wasted searches or emergency orders), inventory accuracy (fewer surprises in stock count), and ultimately helps manufacturing run smoother with lower costs.
Implementing ABC-XYZ is an investment in control. It encourages teams to categorise and organise parts intelligently, so the right items are prioritized. Embedding this within a platform like CyberStockroom then brings it to life: the inventory map and dashboards put the information right at everyone’s fingertips. The combination – disciplined classification and discipline in practices – ensures that what you see in the system reflects reality, and every department can make decisions with confidence. Following this guide, your organisation can master its inventory landscape: where parts are always visible, flows remain uninterrupted, and every part is in the right place at the right time.









Leave a Reply