
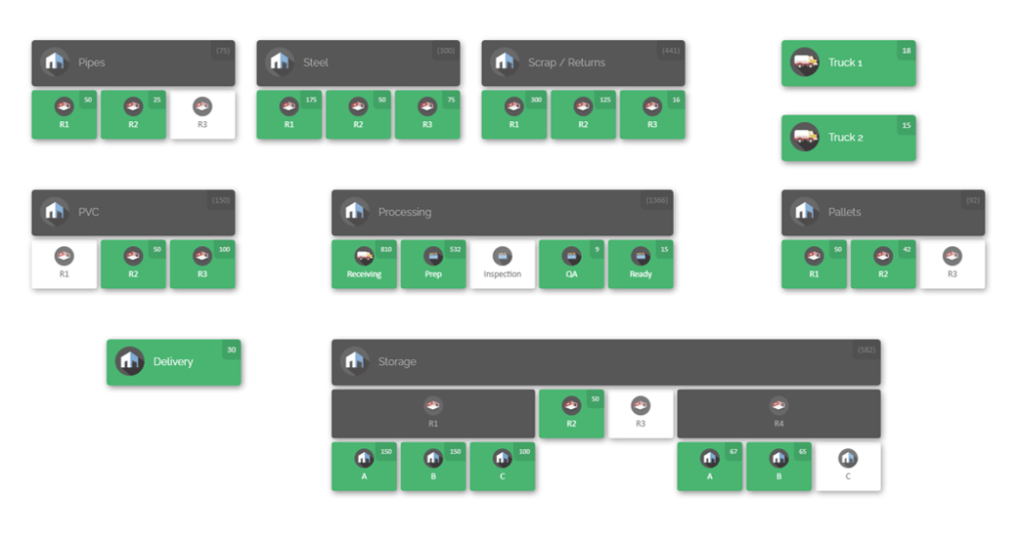
A clear, visual site inventory map can turn a chaotic construction project into a well-organized operation. Imagine walking onto a large industrial job site and instantly seeing where every major component, tool and material is stored – rather than endlessly searching through spreadsheets or calling around. A visual inventory map does just that. It shows the layout of your site (warehouses, laydown yards, trucks and more) and places icons or labels for each part or category.
With this bird’s-eye view, you and your team know exactly what’s on hand and where it is. The result is fewer delays, more efficient use of stock, and smooth coordination between departments. In this guide, we will explain step by step how to build a site inventory map and keep it accurate over the life of an industrial construction project. We’ll also show how modern tools (like CyberStockroom’s map-driven system) put these best practices into action.
Why a Visual Inventory Map Matters
Construction and manufacturing projects involve hundreds or thousands of parts moving across multiple sites, warehouses and teams. Without a unified map, inventory often lives in departmental silos – one crew might have extra steel beams in a laydown yard while another crew urgently needs those same beams. In practice, this causes wasted time (workers searching for parts), overstocking in one area and shortages in another, and scrambling when materials don’t arrive as expected. A visual map tackles these issues by making inventory transparent to everyone involved. Each department (procurement, warehouse, field crews, maintenance, etc.) sees the same live picture of all stock. For example, if the maintenance team needs a particular valve, they can glance at the map and instantly know which storage area or another site has it on hand, instead of guessing or ordering new. This real-time visibility aligns all teams on one truth. It prevents redundant orders, cuts down on emergency transfers, and reduces time lost to miscommunication.
In lean manufacturing terms, a map-based inventory system supports practices like 5S and Kanban. When inventory locations and stock levels are visible, abnormal conditions stand out early. For instance, if a spare part bin in a workshop is empty while one in storage is overflowing, the discrepancy is obvious on the map. Teams can then rebalance stock or adjust reorder policies before production stops. In short, a visual site inventory map bridges information gaps, cuts lead times, and keeps every department coordinated around one shared plan.
Planning Your Site Inventory Map

Before sketching out a map, gather key information about your project’s inventory needs and storage locations. Start by identifying all the places where inventory lives: central warehouses, laydown yards, storage containers, site huts, vehicle toolboxes, material racks, and so on. Make a list of each location and sub-location. For example, you might note “Site A — Main Laydown Yard”, “Warehouse B — Section 1 & 2”, “Truck #3 — Tool Crib” and “Maintenance Shop — Spare Parts Cabinet”. This becomes the list of “nodes” that will go on your map.
Next, catalogue your inventory. Pull together a spreadsheet or database of all the key parts, tools and materials you use on the project. Include item names or SKUs, descriptions, and current quantities at each location. Group items into categories (like mechanical parts, fasteners, safety gear, etc.) so they are easier to label on the map. Mark which items are critical or high-value, as these will benefit most from careful tracking.
While planning, establish standard naming conventions for locations and parts. For instance, decide on a consistent format for site and zone names (e.g. Yard-A, Yard-B; Mezzanine Level 1; Container-3). Give every storage area and container a unique label. Do the same for parts (unique part numbers or codes) if you haven’t already. Consistent names ensure that when one department reports “Shelf 5 – Section C”, everyone else knows exactly where that is. This common language is essential: without it, one part might be “Tool Crib A” in one report and “Tool Room 1” in another, causing confusion. Writing down these conventions in a map “key” or legend is a good idea.
Finally, decide the scale and detail of your map. Will it cover the whole project site and all supporting facilities (yards, satellite offices, trucks), or focus on one big warehouse? Often you’ll want both a high-level map (showing multiple sites or buildings) and detailed sub-maps for each location. For example, the site map might show Warehouse, Laydown Yard and Office Trailer. Then you could have a sub-map of the Warehouse floor plan and another of the laydown yard zones. Planning this hierarchy now helps later when you draw out the map and assign inventory to the correct level.
Designing the Map Layout
With planning done, it’s time to create the actual map. Start by sketching the layout of each location. You can do this on paper, in drawing software, or using a mapping tool. The goal is to represent the physical space in a clear way. For a warehouse, draw the outline of the building, label doors and loading docks, and mark major racks or aisles. For an outdoor laydown yard, sketch the fenced area and draw approximate zones for pipes, lumber, steel, scrap, etc. If you have facility blueprints, those can be a useful base layer.
Divide each area into logical zones or bins. For example, divide a warehouse into Aisle 1, Aisle 2, etc., and label sections A, B, C. In a yard, you might divide space into fenced-in sub-yards (like “Concrete Pipe Yard”, “Steel Beam Yard”, “Equipment Yard”). In a complex site, consider using sub-locations: e.g. Laydown Yard → Container #2 → Bin A. The idea is that each segment on the map corresponds to a real physical spot where inventory is stored. Keep zones consistent in size and shape if possible (equal squares or rectangles on the paper), so it’s easy to count and compare.
Once your zones are drawn, label each one clearly on the map. Write a concise name inside or above each area. Using colors or icons can help too (for instance, blue for water-related items, orange for electrical). Make sure the map has a key or legend explaining any symbols you use. This labelling becomes a guide for anyone using the map to find parts.
Now prepare to populate the map with your inventory data. For each item in your catalogue, decide which zone it belongs to. On the map, you will place that item’s icon or label in the correct area. If you have many individual parts, you might group them by type or bin. For example, place a “Box of Bolts (qty 500)” icon in the Fasteners Rack zone, or a “Generator” icon in the Equipment Yard. In a digital system, you would upload the part data and drag each item onto the map at the desired location. If working by hand, you could write the part codes and quantities in each map zone or use sticky notes to represent stock.
Example Zone Map: In a generic assembly plant, the map might have zones like “Raw Materials Storage”, “Production Line 1”, “Finished Goods Warehouse”, and “Maintenance Tool Crib”. A specific part (say “Hydraulic Pump Model X”) would be placed under the Maintenance zone, perhaps with a note “12 units”. As inventory moves (for example, when 2 pumps are taken to the production area for replacement), the map entry would be updated (the icon or count would move or change).
For very large projects, your map might cover multiple sites. In that case, create a master map of the overall site area showing buildings or yards as separate blocks. Each block could be labelled “Site Office”, “Warehouse A”, “Jobsite B”. Then, if needed, clicking or zooming into one of these blocks would open a more detailed map of that building or yard. Many modern map tools allow nested maps or “floorplans within a plan,” which is handy for multi-level complexity.
Keeping the Map Updated in Real Time

An inventory map is only useful if it stays accurate. That means building a routine to update the map whenever items move. The most effective way to do this is with a real-time tracking process: use barcodes on all items and locations, and scan them whenever there is a transfer, check-out or delivery. For example, when a pallet of rebar arrives at the site, the receiving clerk scans its barcode and assigns it to the “Rebar Zone” on the map. Instantly, the system updates, and all team members see “Rebar +50” at that location. When a crew takes 10 of those bars for use, they scan them out and the map count at the Rebar Zone drops by 10.
To support this, label every storage location with a unique code (rack number, container ID, etc.) and equip parts (or their bins) with barcodes. Make scanning part of standard operating procedure: anyone moving materials must scan the item and the destination. This simple discipline ensures the map always reflects reality. If your team carries smartphones or rugged tablets, a barcode scanner app can update the map on the spot; no need for paper tickets that get entered later.
In addition to scanning, consider assigning custodianship of certain inventory. For instance, a specific tool kit or piece of equipment can be “checked out” to a worker or crew via the system. On the map, that item would then be marked as “with Crew B” or similar. If it gets forgotten at the end of the day, the map still shows it in the crew’s assignment, providing a clue to its location. This accountability reduces losses and confusion: when someone picks up a critical component, they know they have to scan it, and others know who currently has it.
Finally, establish a quick validation step: at the end of each day or shift, have a supervisor review the map against physical reality. Walk through a few key zones, check counts of important items, and correct any discrepancies. This might catch a missed scan or misplaced box before it causes trouble. The effort pays off, because a few minutes of verification keeps the entire system trustworthy. Over time, this fosters confidence that the map can be relied upon, which in turn means crews will trust and use the map more actively.
Ensuring Visibility Across Teams
A major benefit of a site inventory map is breaking down information silos between departments. In practice, this means making sure everyone can see and use the same map. Use a cloud-based or networked system so that stockroom clerks, on-site supervisors, and office managers all access the map from their devices. For example, the procurement officer back at HQ, the warehouse foreman, and the field team should all have the current view. With common access, no department is left guessing.
Communicate new entries and changes broadly. If a delivery arrives, have the receiving team update the map immediately so that a notification or a quick verbal note can alert others. If a zone runs low on something, the map might display a warning symbol (for example, if quantity falls below a safety threshold). A project manager might check the map before sending out crews to see if any requested part is available on-site or needs to be ordered. In essence, the map becomes a shared inventory scoreboard: it shows who has what, where, and if anything is running out.
Improve coordination by tying processes to the map. For instance, if Site A frequently runs low on scaffolding, set up a schedule in your operations plan (or within the system, if supported) to check the map at week’s end and arrange a transfer from Warehouse B before stockouts occur. You could also use the map to plan internal stock transfers: crews loading up items for the next day’s work could mark on the map which stock they’ll take, so the warehouse team knows to prepare those items. These practices ensure that the map is not just a static picture, but an active tool woven into daily workflows.
Another key is standardisation of processes. Ensure all teams use the map the same way. If one team labels items and locations in a consistent format and another does not, the map will have gaps. Provide simple training for all departments on how to read the map and update their transactions. For example, show field crews how to scan in a crane or a delivery, how to locate items by department on the map, and how to flag low stock. The more the map is ingrained in daily routines (like 5S visual workplace practices), the more reliable it becomes. When every department truly adopts the map as their daily guide, parts visibility improves dramatically.
Best Practices for Inventory Visibility

Building and using an inventory map goes hand in hand with other best practices in inventory management. Here are some guidelines and tips:
- Centralise inventory data. Even if your company is large, track everything in one unified system. This could be a purpose-built map-driven platform or a module of an ERP. The point is that every part count or movement is recorded in a single database. When one department updates stock, all others see it immediately. This eliminates “shadow stock” where one shop’s count disagrees with another’s.
- Standardise labels and naming. Use unique identifiers for every item (SKUs or part numbers) and for every location (site, yard, rack, bin, etc.). Label bins, racks and shelves with barcodes or clear text. A shared naming convention (for example, “WH-Aisle5-Rack2-ShelfB”) means anyone looking at the map or a list knows exactly where and what that refers to. Avoid local nicknames or abbreviations that only one team understands. Consistent labelling prevents mistakes and speeds up searches.
- Classify and prioritise parts. Recognise that not all items are equal. Identify critical parts (like expensive spares or long-lead materials) and high-turnover parts (consumables used daily). You might handle these differently: keep tight inventory levels and frequent counts on critical parts, while allowing larger stock for faster-moving items. Use map visuals to mark high-priority inventory. For example, mark essential spares in red so everyone sees they need close monitoring.
- Employ 5S and lean methods. Organise physical spaces in line with your map. Use 5S (Sort, Set in order, Shine, Standardise, Sustain) to keep sites tidy and ensure items are returned to their mapped spots. A map is only as good as the physical order on the ground. If zones on the map are labelled “Rebar Storage” and workers consistently stack rebar only in that zone, the map stays accurate. Similarly, Kanban (pull-based restocking) can tie into the map: when a Kanban card is triggered, a warehouse team can see on the map where the part ran low and deliver just what’s needed.
- Conduct regular audits and cycle counts. Even with scanning, discrepancies can happen. Schedule frequent checks (cycle counts) in different zones. For example, count one or two high-use bins every week on a rotating basis. Reconcile these counts with the map’s records immediately. This catches small errors before they grow into big mistakes. Mark the map if you find any missing items so everyone knows the last verified count. Periodic full audits (especially at project milestones) also keep data trustworthy.
- Set reorder points and use alerts. For parts you frequently use, establish minimum stock levels or reorder points. The map system can then alert you when counts fall below these thresholds. This way, inventory managers get notified to replenish before the crew faces a stockout. Combining reorder logic with the visual map means you won’t have to guess who needs more; the need will be obvious from the map view and triggers.
- Optimise layout with the map in mind. When placing new inventory, think of how it will appear on the map. For large sites, group like items together on both the ground and in the map design. For example, keep all plumbing supplies in one zone, all electrical parts in another. On the map these zones stand out, making it easier to locate an item by category. Also use the map to spot underused space: if a certain rack or area is empty on the map, maybe you can consolidate stock there to free up other zones.
- Coordinate inbound and outbound. Use the map to streamline flows. For instance, clearly label a “Receiving Dock” zone on the map. New shipments can be scanned and entered there first, then moved to their long-term location on the map. Similarly, mark “Shipping/Dispatch” areas for outgoing loads. This reduces confusion about where new stock is and keeps records straight. When materials move from Receiving to a storage zone, update the map (ideally by scan or quick transfer entry) so the inventory never “flies under the radar.”
Below is a quick Inventory Map Setup Checklist to guide your process:
- Survey the entire site. Identify all buildings, yards, containers, vehicles, and storage fixtures that hold inventory.
- Choose a mapping tool or software. Pick a system that can draw interactive maps (this could be specialised inventory software or a flexible digital whiteboard).
- Create base maps. Sketch the outlines of each location. Label major areas and sections.
- Define zones and sub-zones. Break down each map into logical sections (shelves, aisles, bins, yard segments). Assign each a unique name or code.
- Categorise your items. List parts and group them by type or use. Decide where each group will reside on the map.
- Populate the map. Place initial inventory counts or icons in their zones on the map. Verify that counts match the physical stock.
- Set up scanning and barcoding. Label all storage zones and important items with barcodes. Ensure scanning tools are in place and linked to your system.
- Train your team. Make sure everyone knows how to use the map: how to look up items, how to scan or transfer inventory, and how to interpret map warnings.
- Schedule regular reviews. Plan routine counts and meetings around the map data to keep it accurate and top of mind.
By following these practices—clear zones, accurate labels, disciplined scanning, and shared access—you create a living inventory system. Every time one department updates the map, every other department instantly benefits from that information. That is the essence of full parts visibility.
How CyberStockroom Supports Multi-Department Visibility
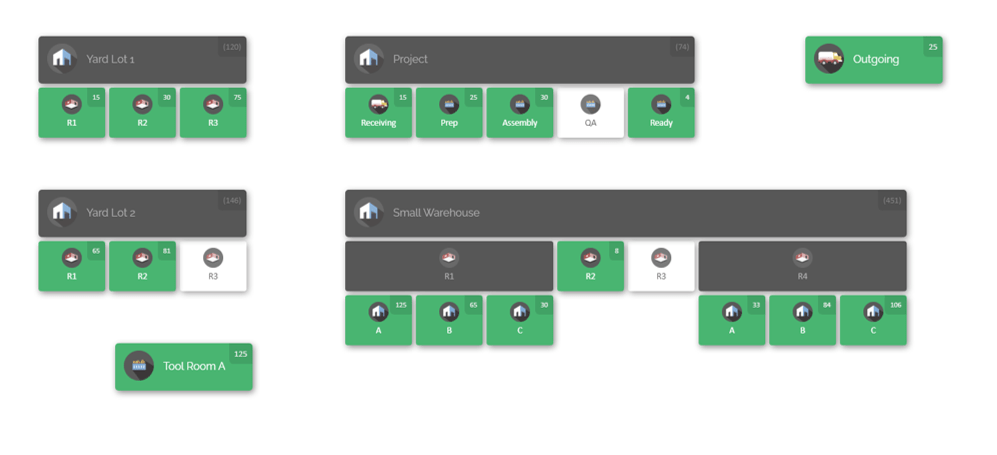
To implement a visual inventory map at scale, many teams turn to dedicated software. CyberStockroom is one example of a map-driven inventory system designed for industrial and construction environments. Its features directly address the best practices above:
- Interactive Map Dashboard: With CyberStockroom, you can draw custom floor plans and yard layouts of every location (warehouses, job sites, containers, even trucks) and place all your items on that map. The result is a live map-based dashboard where every part, tool or material appears in its real-world spot. Teams see at a glance where each item is stored, and quantities pop up with each icon. This creates that bird’s-eye view of inventory across all departments and sites.
- Real-Time Tracking via Scanning: The system is cloud-based, so updates happen instantly for everyone. When someone scans a barcode to check an item in or out, CyberStockroom moves that item’s icon on the map and updates its count in real time. For example, if a pallet of conduit is scanned from the warehouse to Jobsite C, its marker jumps from the warehouse zone to the jobsite zone immediately. No waiting for end-of-day reports. This scanning workflow means the map and data never lag behind the physical movements.
- Assign Parts to Teams or Vehicles: You can assign specific inventory to a crew or person. On the map, those items show as “with” that team or in a vehicle’s inventory. For instance, if Tool Truck #7 is a location on the map, you can see exactly which tools or parts are loaded onto Truck #7 at any moment. This way, even mobile stock isn’t lost – the map treats the truck as a location node.

- Drag-and-Drop Transfers: Moving stock on the map is as simple as dragging icons from one location to another. If you decide to move a batch of cables from Warehouse to Site A, an operator can just drag the cable icon from Warehouse A to Site A on the screen. CyberStockroom automatically records the transfer and adjusts counts. It’s a visual way to perform internal transfers, reflecting physical moves without reams of paperwork.
- Nested and Multi-Level Maps: CyberStockroom supports maps within maps. You could have a top-level map showing buildings and yards, then click into a building to see its floor plan and racks, then into a rack to see bins. This flexibility lets you mirror your real layout exactly. For example, a laydown yard map might have zones for “Pipe Yard” and “Steel Yard”; clicking the Pipe Yard could reveal labeled stacks of PVC and metal pipes.
- Cloud Access Anywhere: Because it’s web-based, everyone from the site foreman to the warehouse manager can open the same system in a browser on any device (desktop, tablet or phone). There is no separate app to install. As long as you have internet, the live inventory map and data are accessible. This ensures even remote crews or travelling managers are always looking at the latest stock situation.
- Easy Onboarding and Setup: You can import your existing inventory lists (from spreadsheets or CSV files) to get started quickly. The system is designed to be intuitive – the map interface uses drag-and-drop and visual cues that ground staff find familiar. Non-technical users can learn it fast. This means you can implement CyberStockroom on a new project with minimal downtime.
- Built-In Accountability: Every scan or movement is logged with a user and timestamp. If something goes missing, you can trace which user last recorded the part or which map location it was in. Knowing this discourages casual “borrowing” of parts, since the history shows who had it last. Audit trails are automatic, supporting loss prevention.

By tying these capabilities together, CyberStockroom brings all departments onto one page (literally, one map). Procurement sees live stock levels when ordering, warehouse staff know what to ship, maintenance crew can confirm spare availability on site, and project managers can monitor stock from afar. In practice, teams have used such mapping to eliminate duplicate orders and drastically cut search times. The inventory map becomes a central hub for coordination: if someone needs an item, they check the map first; if one area has excess, the map helps transfer it to a spot running low.
Inventory Map Checklist
To summarize, here is a concise checklist you can follow when building your map-driven inventory system:
- Survey and list all locations: Record every storage area (warehouses, yards, trucks, cabinets, etc.).
- Define naming conventions: Assign unique, standardized codes/names for all locations and item categories.
- Draft base maps: Sketch layouts (hand-drawn or software) for each site, dividing into logical zones. Label each zone clearly.
- Categorise inventory: Group items by type/usage. Decide where each group will be located on the map.
- Populate initial data: Add current inventory counts or items to each map zone. Verify these against physical counts.
- Implement scanning process: Label zones and items with barcodes. Equip teams with scanners or mobile devices for in/out tracking.
- Train teams: Show each department how to use the map interface (viewing, scanning, transferring). Emphasise consistency in data entry.
- Set up alerts and rules: Define reorder points or low-stock warnings in the system. Establish who gets notified on the map.
- Plan audits: Schedule cycle counts and reviews to reconcile map data with reality regularly.
- Review and refine: After initial setup, gather feedback from users. Tweak the map layout or processes as needed to match actual workflows.
Using this template as a guide, your inventory map will evolve into a reliable “single source of truth.” Teams can always answer questions like “Is that part still in stock?” or “Where exactly did we park that forklift?” by simply checking the map.
Conclusion
For any industrial construction project, achieving full visibility of parts and materials is a game-changer. A visual site inventory map provides that visibility. It turns abstract stock counts into a clear, navigable layout of your real site. Crews waste less time searching, managers eliminate guesswork, and every department pulls in the same direction. In practice, organisations that build and maintain such maps report smoother operations, fewer urgent rush orders, and better use of their capital.
By following the steps outlined above — from planning your map structure to keeping data current — you’ll create a foundation for leaner, more responsive project logistics. And with a tool like CyberStockroom (or any good visual inventory system), you bring this foundation to life: a live dashboard that everyone on your team can trust. In the end, the goal is simple: know what you have, where it is, and who needs to see it. A well-built visual site inventory map delivers exactly that, helping your next project stay on schedule and under budget.









Leave a comment