
Managing inventory on one construction site is already difficult. Managing it across several projects, warehouses, laydown yards, storage containers, workshops, vehicles and departments turns the problem into something much larger than stock counting. The central challenge becomes visibility: knowing what inventory exists, how much is available, exactly where it is located and which team is relying on it.
A multi site construction inventory visual dashboard addresses this challenge by replacing fragmented location records with a shared visual representation of inventory across the organization. Instead of forcing warehouse staff, project managers, site supervisors, procurement teams and operations leaders to compare different spreadsheets, messages and local stock lists, the organization works from a common inventory picture.
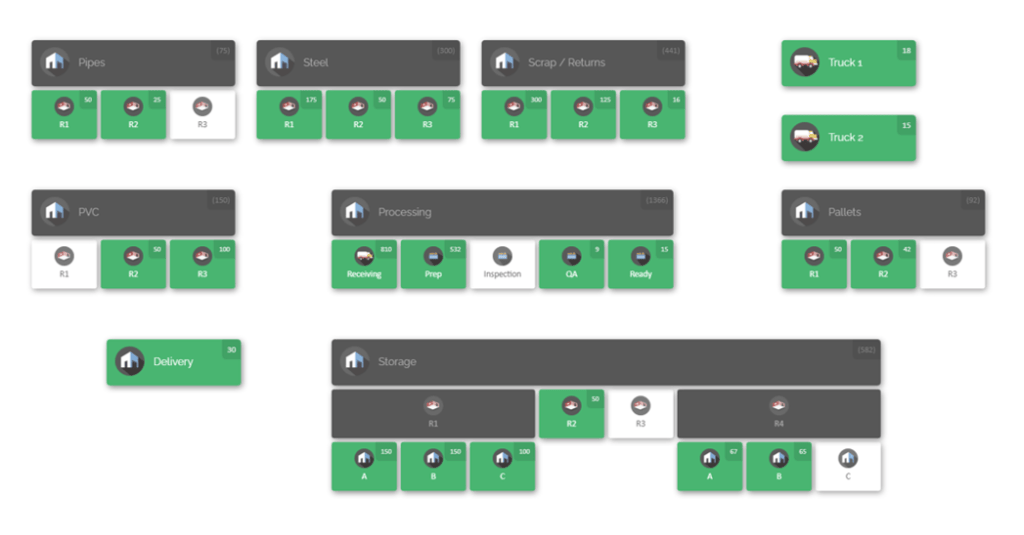
That common picture matters because construction inventory is constantly moving. Materials arrive at central stores, transfer to projects, move into laydown areas, shift between work zones and may later return to storage. Tools can move from workshops to site containers or between crews. Spare parts may be stored at a central facility while another project independently orders the same item because nobody knows that usable stock already exists elsewhere. Construction materials management therefore involves not only purchasing and storage, but also tracking, allocation and movement throughout the project lifecycle.
The objective of visual inventory management is not simply to create a more attractive stock list. It is to make operational questions easier to answer. A useful dashboard should allow teams to determine, without launching a lengthy investigation:
Do we already have this item? Where is it? How much is there? Is another project holding excess stock? Which storage area contains it? Has it moved since the last count?
The answer requires a structured location model. The hierarchy should mirror how people physically find inventory. That principle is particularly important in construction because one organization may simultaneously manage formal warehouses, temporary jobsite storage, project trailers, containers, yards and mobile stock locations.
This guide explains how to build that visibility model, what a visual construction inventory dashboard should show, how to establish accurate location and item data, how different departments should work together, which key performance indicators matter and how to pilot the approach without turning inventory improvement into an oversized transformation program.
It also examines how CyberStockroom can support this operating model. CyberStockroom uses a visual inventory map that can represent buildings, job sites, rooms, storage areas, vehicles, containers and sub-locations. Teams can view quantities by location, see a product’s distribution across locations and visually move stock between mapped locations. Its map structure can therefore support the central requirement discussed throughout this guide: giving different departments a shared picture of where inventory sits across an operation.
This article assumes no specific constraint on budget, technology stack, team size or implementation timeline. The recommendations are therefore designed as a scalable operating model rather than a prescription for one company size. A contractor with three active projects can apply the same principles as an organization managing dozens of sites, although the required governance and location hierarchy will differ.
The fundamental idea is simple: Multi-site inventory visibility improves when the digital inventory structure mirrors the physical operation closely enough that every department can find the same item, quantity and location without creating its own version of the truth.
Why Multi-Site Construction Inventory Visibility Breaks Down

Multi-site construction creates an inventory problem that traditional stock lists handle poorly. The issue is not simply volume. It is the combination of distribution, movement, ownership and timing.
A central warehouse may supply five projects. Each project may have a receiving area, laydown yard, locked tool container, mechanical storage area and temporary workface staging locations. The maintenance department may operate a separate parts store. Electrical teams may maintain their own consumables. A fabrication workshop may hold items that could be used by field projects, while procurement sees only the demand requests arriving from individual sites.
The organization can therefore own enough stock overall while still experiencing shortages locally.
That distinction is central to multi-site construction inventory management. An enterprise-level quantity of 300 units means very little if the team needing 30 units tomorrow cannot determine whether those 300 units are available at the correct project, inside a different warehouse or committed somewhere else. Good construction resource management requires organizations to monitor available resources, allocate or reallocate them according to project requirements and track how they are being used.
Visibility is consequently a location problem as much as a quantity problem.
A spreadsheet can tell a planner that the business owns 150 pipe fittings. A useful operational inventory system should tell the planner that 60 are in the central warehouse, 40 are at Project North, 30 are in Project South’s mechanical container and 20 are in a staging zone at Project West.
The second version changes the decision.
Instead of raising a new purchase request, the planner can first determine whether stock should be transferred. Instead of asking several supervisors to perform manual checks, procurement can investigate existing inventory. Instead of holding excessive safety stock independently at every site, operations can begin making replenishment decisions with a broader understanding of availability.
The fragmentation problem
Most inventory visibility failures begin gradually. A new project launches and creates a spreadsheet because the corporate stock list does not provide enough site detail. The warehouse keeps its own file because that is faster for stores staff. A superintendent maintains another list for high-value tools. Maintenance tracks critical spares separately. Procurement works from purchase orders and requests rather than physical location data.
None of these decisions appears unreasonable on its own. Together, however, they create an information architecture in which every department can be locally organized while the business remains globally blind.
The consequences become visible through everyday behaviours:
- Site teams ask other projects whether they have spare material.
- Warehouse personnel receive urgent requests for items that exist elsewhere.
- Procurement reorders products already held by the organisation.
- Supervisors spend time checking containers and storage areas before confirming availability.
- Project managers struggle to distinguish a genuine shortage from a location-record problem.
- Inventory counts disagree because different departments update different files.
- Transfers occur physically before they are reflected administratively.
The result is often described as an inventory accuracy problem, but the root cause may be broader. The company has not defined where inventory truth lives.
The physical environment makes construction harder
Construction inventory also behaves differently from stock inside a stable warehouse. A warehouse has relatively permanent aisles, racks and bins. A construction project changes shape as work progresses. The receiving area used during foundations may become unavailable later. Containers may be repositioned. Material initially staged in the laydown yard may move closer to installation. Different floors become active as a building rises. Temporary workshops appear and disappear.
Material storage strategy must also follow the construction programme. Project teams need to coordinate deliveries, available storage and installation timing because material arriving too early can occupy valuable laydown space, while material arriving too late can interrupt the work sequence.
A visual inventory structure must therefore be flexible enough to change with the physical site.
Consider a high-rise project.
During early construction, the site might contain:
Receiving → Main Laydown Yard → Structural Steel Zone → Formwork Zone → Plant Storage
Several months later, the useful inventory model might be:
Receiving → Ground-Floor Stores → Level 5 Staging → Level 8 MEP Store → Level 10 Finishes Store
The dashboard should not treat these arrangements as exceptions. Construction inventory locations are expected to evolve.
The departmental visibility problem
Multi-site inventory becomes especially difficult when each department views stock through a different operational lens.
- The warehouse team asks: Where is the item stored, and how many units are present?
- The site team asks: Can I get it to the workface when the crew needs it?
- The project manager asks: Could material availability affect the programme?
- The procurement team asks: Do we actually need to buy more?
- The maintenance team asks: Where is the spare part required to restore equipment?
- The operations manager asks: Are we carrying duplicate stock across projects?
- The finance team asks: How much capital is tied up in material that is sitting unused?
A single inventory system does not mean every department needs the same view of every field. It means the underlying inventory record should be common enough that departments are discussing the same physical reality.
That is the important distinction between data centralization and operational alignment.
Centralizing data without defining location standards simply produces one large database full of inconsistent information. Alignment requires agreeing on how locations are named, when movements are recorded, who owns accuracy and what each inventory status means.
The hidden cost of searching
One of the most overlooked consequences of poor inventory visibility is the time spent searching. A missing part does not create only a material problem. It creates a chain of extra work as supervisors, storekeepers, project teams, and procurement staff try to determine whether the item is misplaced, stored elsewhere, already used, or never received.
Even when the part is eventually found, the organization has still consumed labor without creating construction progress. Employees may walk between storage areas, make calls to other sites, check previous orders, or search containers while productive work slows down.
This is why visual inventory is an operational-efficiency tool. When teams can quickly see where materials are stored and how inventory is distributed across locations, routine questions require less investigation.
The goal is not to eliminate every inventory discrepancy. It is to make inventory information clear enough that everyday decisions do not depend on detective work.
The difference between inventory presence and inventory usability
Another common inventory mistake is treating physical stock as automatically available stock. A project may technically have access to a component somewhere in the organization, but that does not always mean the item can support the current requirement.
The part may belong to another project, be awaiting inspection, be reserved for upcoming work, or simply be stored too far away to meet the required date. This is why multi-site inventory visibility needs to go beyond a simple yes-or-no answer.
Instead of asking “Do we have it?”, teams should ask:
“Where do we have it, how much is available, and can we use it for this requirement?”
That shift helps separate enterprise-wide ownership from actual project-level availability. It also gives planners, procurement teams, and site personnel a clearer basis for deciding whether stock can be transferred, reserved, or needs to be purchased.
One dashboard does not mean one giant screen
The phrase one dashboard for all locations can sound like every warehouse, site, bin, part, and quantity needs to appear on one screen. In practice, that would only replace spreadsheet clutter with visual clutter.
A strong multi site construction inventory visual dashboard uses hierarchy so users can move from a broad operational view into the level of detail they actually need.
At the highest level, the dashboard might show:
Central Warehouse | Project Alpha | Project Bravo | Project Charlie | Maintenance Depot
Selecting Project Bravo could then reveal:
Receiving | Laydown Yard | Tool Crib | Electrical Container | Mechanical Container
From there, selecting Mechanical Container could show:
Rack A | Rack B | Cabinet 1 | Cabinet 2
The value comes from being able to move from an enterprise-wide overview to a specific physical storage location without switching to a separate inventory record or disconnected tracking system.
Designing a Multi Site Construction Inventory Visual Dashboard
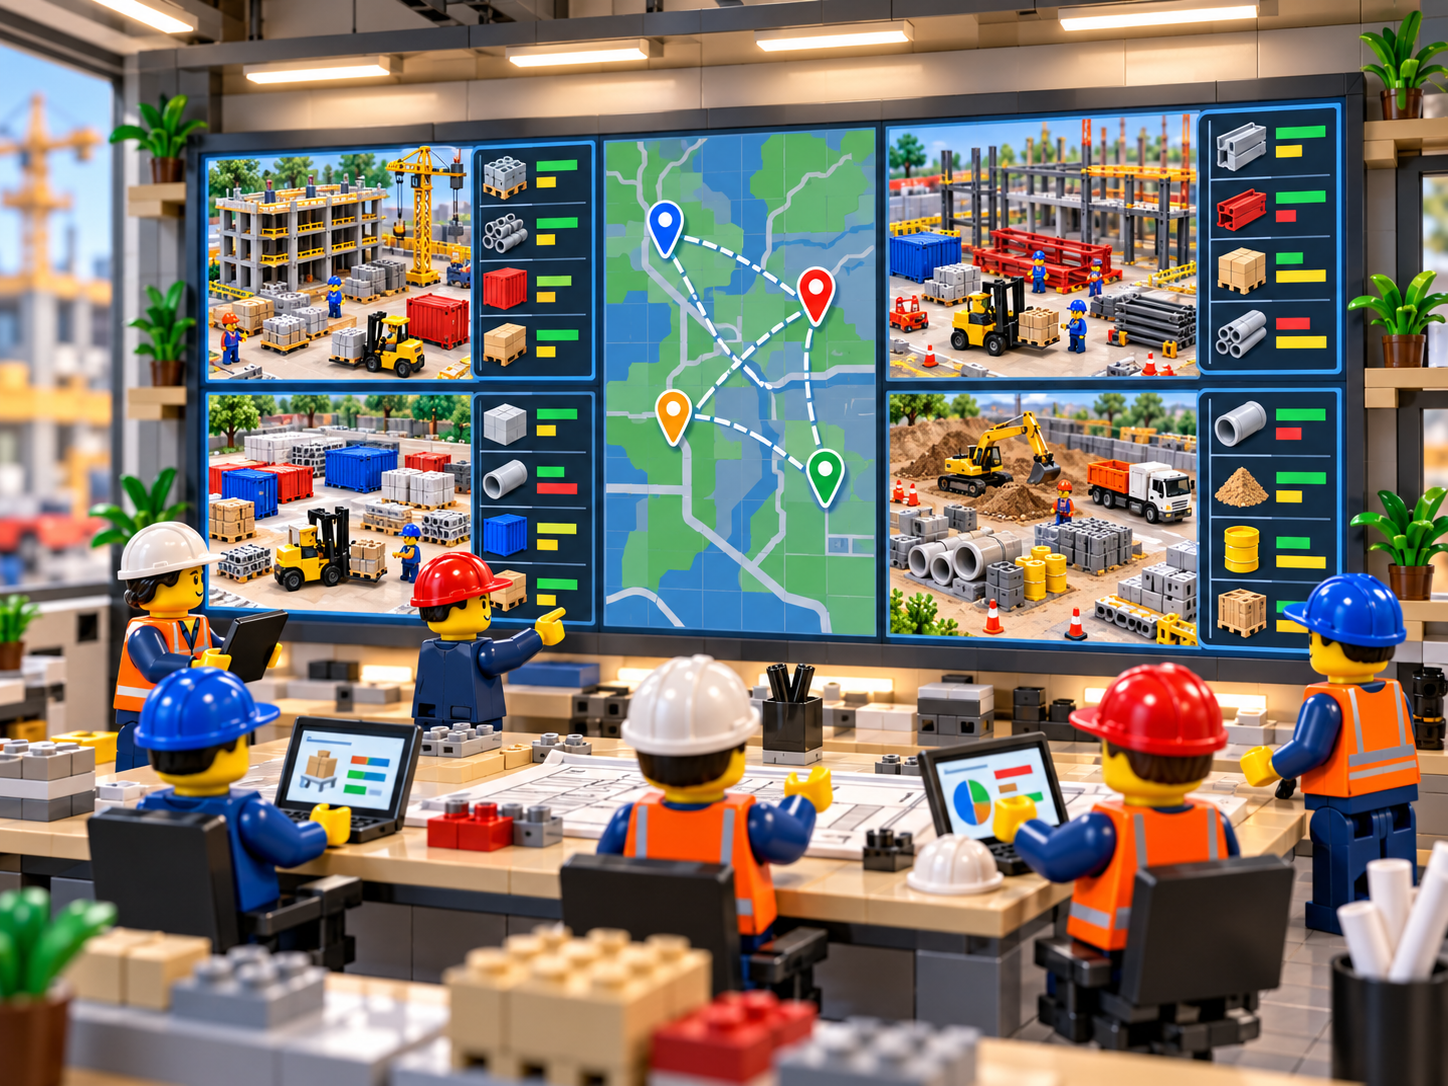
Before choosing software or building a dashboard, an organization first needs to define what its inventory model is supposed to represent.
That step matters because visualization cannot fix a weak inventory structure. If project names are inconsistent, locations are vague, or duplicate item records exist, a dashboard will only make those problems easier to see.
A useful starting point is a simple question:
How many of what do we have, and where is it?
A practical dashboard should make that answer progressively more precise, moving from a high-level view of all locations down to the exact project, storage area, rack, container, or other physical location where inventory is held.
Build the physical hierarchy before the digital dashboard
The first design principle is to structure inventory the way people physically navigate the operation. A useful construction hierarchy usually starts with the broadest organizational level and becomes more specific as users move deeper into the map.
For example:
Organization → Project or Facility → Inventory Area → Storage Location → Sub-location
A material location might look like:
ABC Construction → Airport Expansion → North Laydown Yard → Container 4 → Rack B → Shelf 3
Another part might be stored at:
ABC Construction → Central Warehouse → Mechanical Stores → Pump Spares → Cabinet 7
These location paths do more than provide a code. They tell users where inventory actually is.
CyberStockroom supports this type of structure through locations and sub-locations that can represent buildings, rooms, racks, shelves, bins, yard areas, and other physical storage spaces within a visual inventory map.
The goal should be the minimum useful precision. Too little detail creates vague records such as “Project A,” while too much detail can create unnecessary administrative work.
A useful test is: Would knowing this additional location level change what someone does?
If recording the rack or shelf saves significant search time, include it. If separating two nearby floor areas provides no practical value, that extra level may not be necessary.
Establish a standard location vocabulary
Location names should follow a consistent format across projects, warehouses, yards, and temporary storage areas. Without a standard, the same type of location can appear under several different names, such as Elec Store, Electrical Storage, Electrical Container, E-Store, or Container E.
That inconsistency makes inventory harder to search, filter, compare, and report on. It also forces employees to rely on local knowledge instead of the system itself.
A construction inventory location standard might look like this:
| Location type | Naming approach | Example |
|---|---|---|
| Project | Project name or approved project code | Airport Expansion |
| Laydown area | Project + yard + zone | Airport / North Yard / Zone C |
| Container | Site + container number + trade | Project Alpha / Container 04 / Electrical |
| Warehouse | Facility + department | Central Warehouse / Mechanical |
| Rack | Standard rack identifier | Rack B |
| Shelf or bin | Parent location + code | Rack B / Shelf 03 |
| Vehicle or mobile stock | Fleet identifier or operating group | Service Vehicle 18 |
| Temporary staging | Phase or work-area description | Level 7 / MEP Staging |
Naming standards may sound administrative, but they have a direct operational purpose. A clear vocabulary helps ensure that the same physical location is described the same way across teams, projects, audits, and inventory records.
A new employee should not need to know that “Blue Box” actually means the electrical container behind the site office. The location name should explain itself.
Define what the dashboard must answer
A useful inventory dashboard should be built around operational decisions, not around every piece of data the system can display. The goal is to help users answer the questions that affect purchasing, movement, retrieval, replenishment, and project execution.
The following table provides a practical starting point:
| Dashboard element | Operational question | Primary users | Desired outcome |
|---|---|---|---|
| Site-level stock view | What inventory is held at this project? | Project team, stores | Faster availability checks |
| Cross-site item view | Where else do we hold this item? | Procurement, operations | Avoid unnecessary purchasing |
| Exact location | Where should someone physically go? | Storekeeper, supervisor | Less search time |
| Quantity by location | How much is at each storage point? | Stores, planning | Better replenishment decisions |
| Location hierarchy | Which site, zone, container, rack or bin contains it? | Field teams | Faster retrieval |
| Stock movement visibility | Has the item changed location? | Stores, project teams | Better record accuracy |
| Item classification | What type of material or part is this? | All departments | Consistent searching |
| Critical-stock view | Which essential items need attention? | Maintenance, operations | Earlier intervention |
| Excess-stock view | Does one site hold stock another site needs? | Procurement, operations | Better internal reallocation |
This highlights an important principle: not every useful inventory metric belongs on the main dashboard. Too much information can make the interface harder to use and distract from the decisions that matter most.
The main dashboard should prioritize questions that require quick action, while more detailed information can sit deeper in the system for users who need it.
Separate the enterprise view from the operational view
A corporate inventory manager and a site storekeeper do not need the same level of detail, even when they are working from the same inventory system.
At the enterprise level, the dashboard should help answer questions such as:
- Which sites currently hold inventory?
- Which materials are spread across multiple projects?
- Where are shortages or excess concentrations developing?
- Can existing stock be reallocated before another purchase is made?
At the site level, the questions become more specific:
- Which container holds the item?
- Which rack or shelf contains it?
- What quantity is physically present?
- Where should the material move next?
The important point is that both views should rely on the same underlying inventory structure. Management may need a broader picture, while field teams need exact physical detail, but the data should still come from the same source.
This avoids a common problem where leadership sees a polished summary dashboard while site teams continue maintaining separate spreadsheets to manage the actual day-to-day inventory.
Make location visible before adding more analytics
Organizations often try to solve inventory problems by adding more reports, metrics, and performance indicators. That can be useful, but only after the underlying inventory information is reliable.
If a team cannot confidently answer where the inventory is, advanced analytics will be built on unstable data. Before measuring performance, the organization needs a clear foundation.
A practical sequence is:
Identity → Location → Quantity → Movement discipline → Accuracy → Performance measurement
This sequence explains why visual inventory mapping can be so useful. Location gives inventory data the physical context needed to support real decisions.
“40 units available” tells a team how much stock exists.
“40 units in Project Delta → South Laydown Yard → Container 2 → Rack A” tells them where to go, what is available there, and how that inventory can support the work.
That is the difference between inventory data and operationally useful inventory visibility.
Design for shared inventory, not departmental ownership silos
Some inventory is dedicated to a specific project or department, while other stock can be shared across the organization. A useful multi-site dashboard should make that distinction visible without creating duplicate records or separate versions of the same inventory.
Consider a common consumable held across several locations:
| Location | Quantity |
|---|---|
| Central Warehouse | 400 |
| Project North | 85 |
| Project South | 220 |
| Project East | 40 |
| Project West | 170 |
If Project East only sees its local quantity, the team may decide to order another 100 units. A cross-site view creates another option:
Could those 100 units be transferred from Project South or Project West instead?
The answer will depend on project commitments, transfer cost, timing, and expected local demand. The value of the dashboard is that the organization can evaluate those factors before automatically raising another purchase.
Without cross-site visibility, excess stock can remain locked inside project or departmental silos while another location buys the same material again.
Represent movement as part of inventory truth
Inventory is not just a set of balances. In construction environments, stock changes through repeated physical events such as:
Receive → Store → Stage → Transfer → Issue → Return → Relocate
For that reason, the dashboard should be supported by one simple operating rule: When physical location changes in a way that matters operationally, the inventory record should change with it.
That rule is more important than the appearance of the dashboard itself. A well-designed visual map quickly loses value if materials are moved between containers, yards, warehouses, or work areas without updating their recorded location.
The process should therefore make movement updates part of normal inventory handling. Recording a transfer should happen as close as possible to the physical move, rather than becoming an administrative task completed hours later.
When movement discipline is built into daily operations, the dashboard remains a reflection of the real construction site instead of becoming another record that gradually falls behind.
Use visualization to reduce translation effort
Traditional inventory lists often require workers to translate location codes into physical space. An experienced storekeeper may immediately understand a code such as PRJ-04-YD-N-C03-R02, while a project engineer or new team member may need additional context before knowing where to go.
A visual inventory structure makes that location easier to interpret:
Project 04 → North Yard → Container 03 → Rack 02
The goal is not to eliminate standardized location codes. Codes remain useful for consistency, searching, labeling, and inventory control. The goal is to connect those codes to a visual structure that reflects how the site is physically organized.
When users can understand a location without relying on local knowledge or memorized codes, inventory becomes easier to find and the system becomes more useful across departments.
Best Practices for Inventory Visibility Across Departments

Multi-site inventory visibility should not be treated as an inventory-department project. The warehouse may manage the stock structure, but construction inventory is influenced by procurement, receiving, project operations, maintenance, planning, and management.
If those teams move, receive, issue, or stage materials without updating the inventory record, accuracy will decline regardless of how good the software is.
A stronger approach combines shared data, clear ownership, and simple operating rules so every department understands its role in keeping inventory information current.
Establish one shared inventory language
The first requirement for cross-department inventory visibility is consistent item identification. Construction companies often find that the same material is described differently by procurement, warehouse teams, maintenance, and site supervisors.
Procurement may use the supplier description, the warehouse may rely on an abbreviated stock name, maintenance may search by manufacturer part number, and field teams may use a trade nickname. When those terms become separate inventory records, duplicate items and weak search results follow.
A better approach is to give each item one standard identity with enough descriptive information for different departments to recognize it.
For example:
Item: Stainless Steel Pipe Coupling
Size: 50 mm
Specification: Project-approved specification
Category: Mechanical Consumable
Primary Storage Class: Mechanical
Internal Item ID: MC-00542
Teams can still use familiar terminology in conversation, but the inventory record itself should not depend on department-specific naming. A shared inventory language makes searching, reporting, and cross-site visibility much more reliable.
Treat locations as master data
Organizations often put significant effort into item master data while treating location names much more casually. For multi-site inventory visibility, locations need the same level of consistency and control.
A single physical area should not appear in the system under several names such as “Yard,” “Main Yard,” “Site Yard,” and “Laydown.” That creates confusion, weakens reporting, and makes it harder for teams to understand where inventory is actually stored.
Location governance should define who can create or rename locations, how temporary areas are closed, how relocated containers are handled, and when a staging area should become its own inventory location.
The objective is not to add bureaucracy. It is to maintain a location structure that stays clear, consistent, and understandable across projects, departments, and sites.
Align the digital map with the physical layout
The strongest inventory systems make the physical environment and the digital map reinforce each other. If the dashboard shows:
North Yard → Container 3 → Rack B → Shelf 2
the physical site should use comparable labels so users can follow the same path in the real environment.
This creates a direct connection between screen and site. A user can identify Container 3 on the dashboard, find the same label in the yard, and then locate Rack B and Shelf 2 without relying on memory or local knowledge.
When digital naming and physical labeling do not match, users are forced to translate between two systems. That weakens the value of visual inventory and increases the chance of search delays and location errors.
Record inventory where operational responsibility changes
Not every physical movement needs to become an inventory transaction. Moving a box a few inches on the same shelf usually has no operational impact, while moving inventory from the central warehouse to a project site clearly does.
The same principle applies when stock moves from a shared laydown yard into a trade-specific container, or when a critical spare leaves stores and enters the maintenance workshop. These movements matter because they change where the item is expected to be found or who is responsible for it.
A practical rule is to record a movement when one of three things changes:
Location ownership, physical retrieval point, or operational responsibility.
This keeps the system detailed enough to support accurate visibility without creating unnecessary transaction fatigue for field and warehouse teams.
Create clear departmental responsibilities
Cross-team inventory visibility works best when every department understands which part of inventory accuracy it owns. Different teams may use the same inventory information for different decisions, but responsibility for keeping that information current should be clear.
| Role or department | Core responsibility | Visibility requirement | Typical decision |
|---|---|---|---|
| Inventory or stores team | Maintain location discipline and stock accuracy | Detailed location and quantity | Store, issue, transfer |
| Site supervisors | Ensure material movements are reflected operationally | Work-area and site stock | Stage or request material |
| Procurement | Review existing stock before purchasing | Cross-site quantity view | Buy, defer or transfer |
| Project planning | Compare material readiness with upcoming work | Project and staging visibility | Escalate shortages |
| Maintenance | Locate and control critical spares | Spare-part location and quantity | Issue or replenish |
| Operations management | Balance inventory across projects | Enterprise multi-site view | Reallocate stock |
| Project management | Protect program and cost outcomes | Site availability and exceptions | Prioritize action |
The important distinction is between responsibility and visibility. Procurement does not need to manage the physical rack layout, but it benefits from knowing whether stock already exists at another site. Project planners may not control warehouse transactions, but they need enough visibility to determine whether materials are ready for upcoming work.
The goal is to give each department access to the inventory information it needs while keeping accountability for updates clearly defined. When responsibility and visibility are aligned, fewer inventory decisions depend on chasing another team for answers.
Make procurement check the network before buying
One of the clearest benefits of cross-site inventory visibility is the ability to check existing stock before raising another purchase order.
That does not mean every shortage should automatically trigger a transfer. Moving a small quantity of low-value material over a long distance may cost more than buying locally, while transferring stock reserved for another project could create a new shortage elsewhere.
A practical decision process is:
Site requirement → Local availability check → Enterprise availability check → Transfer feasibility → Purchase decision
This adds one important question between identifying a shortage and placing an order:
Does the organization already own stock that can economically and operationally satisfy the requirement?
When inventory is visible across multiple projects and locations, procurement can answer that question more quickly and make better-informed decisions about whether to buy, transfer, or defer.
Use exception management rather than constant checking
Inventory teams should not have to spend the day manually reviewing every quantity and location. A stronger process directs attention toward the conditions that actually require action.
Useful exceptions might include:
- A critical item falling below an agreed minimum
- Material expected at the workface but still recorded in central storage
- An item shown at a site but not found during verification
- Excess stock remaining on a project nearing completion
- Duplicate holdings spread across several projects
- Inventory items that require frequent adjustments
The purpose of the dashboard is therefore not just to display inventory. It should help teams spot unusual conditions quickly so they can investigate the cause and take action where it matters most.
When exception management is built into the inventory process, teams spend less time checking what is normal and more time resolving what is not.
Match counting effort to inventory risk
Not all inventory needs the same level of control. A low-cost, readily available consumable does not necessarily require the same verification frequency as an expensive, reusable, or schedule-critical item.
A practical approach is to segment inventory according to the operational impact of an error:
| Inventory class | Example | Typical risk | Control approach |
|---|---|---|---|
| Critical project material | Specialist valve, switchgear component | Program delay | High visibility and frequent verification |
| High-value reusable equipment | Survey instrument, specialist tool | Loss or unavailable asset | Precise location control |
| Maintenance critical spare | Pump component, electrical module | Equipment downtime | Minimum-stock discipline |
| Standard consumable | Fasteners, fittings | Stockout inconvenience | Routine cycle checking |
| Bulk commodity | Common pipe, timber, or standard material | Overstock and space use | Zone-level quantity control |
The goal is to match inventory-management effort to operational risk. Items that could delay work, create downtime, or represent significant value deserve tighter location and verification controls, while lower-risk stock can follow a simpler routine.
This helps teams focus counting effort where an inventory error would have the greatest impact.
Use cycle counting as an accuracy process, not an annual event
Inventory accuracy is difficult to maintain through a single annual stocktake. Regular cycle counting gives teams more opportunities to verify selected locations, catch discrepancies earlier, and understand why inventory records drift away from physical reality.
This is especially important in environments where materials move frequently between warehouses, project sites, containers, laydown areas, and work zones. The more often inventory changes location, the more important routine verification becomes.
The objective should not be simply to correct the quantity. A meaningful discrepancy should trigger questions such as:
Was the material moved without recording the transfer?
Was it assigned to the wrong location?
Is another department using a duplicate item record?
Is the physical label unclear?
Is the location hierarchy too complicated?
Repeated discrepancies often point to a process problem rather than an isolated counting error. Cycle counting therefore becomes more valuable when teams use the results to improve movement discipline, location design, labeling, and inventory ownership.
Make Accuracy Measurable
“Improve inventory accuracy” is too vague to manage effectively. The organization should define exactly what accuracy means and how it will be measured.
A useful starting formula is:
Location Accuracy = Correct item-location records ÷ Item-location records checked × 100
Quantity accuracy can be measured separately:
Quantity Accuracy = Records matching physical quantity ÷ Records checked × 100
Separating these two measures matters. An organization may have the correct total quantity in the system while repeatedly recording that stock in the wrong physical location.
That is still a serious operational problem. The financial total may be correct, but field teams can lose time searching, planners can make decisions using the wrong site-level information, and procurement may assume stock is unavailable when it is simply misplaced.
Connect Inventory Visibility with the Construction Program
Construction materials create value only when they are available at the right stage of work. Project planning should therefore use inventory visibility before scheduled activities begin rather than waiting until crews are ready to install material.
Before an upcoming mechanical installation, for example, the team should confirm:
- Required material identity
- Required quantity
- Current inventory location
- Quantity already on site
- Quantity still in central storage
- Material requiring transfer
- Material requiring purchase
The earlier this check takes place, the more options the project has. A shortage identified several weeks before installation may be addressed through a transfer, revised purchasing plan, or schedule adjustment. The same shortage discovered when the crew is already waiting becomes an immediate disruption.
Inventory visibility and construction scheduling should therefore support each other. Material readiness is part of work readiness.
Manage the Project Close-Out Inventory Problem
Multi-site visibility becomes especially valuable as projects approach completion. Construction sites often accumulate residual material such as unopened consumables, spare fittings, tools, temporary equipment, and project-specific items that may still have value elsewhere in the organization.
Without a cross-site inventory process, that stock can remain stranded or disappear from the shared inventory view during demobilization.
A close-out process should determine whether remaining inventory should be:
- Transferred to another active project
- Returned to the central warehouse
- Retained for warranty or maintenance
- Disposed of or written off under company policy
The multi-site dashboard can help teams identify where reusable stock may be needed before the project closes. This turns project close-out into a stock-recovery process rather than a last-minute cleanup exercise.
Use Visual Inventory for Department Alignment Meetings
Inventory information becomes more valuable when different departments can use it to make decisions together. Instead of arriving at coordination meetings with separate spreadsheets and reports, teams can work from the same visual inventory view.
A discussion might look like this:
Planning: “Project East needs these fittings next week.”
Stores: “Project East has 20, but Project West holds another 80.”
Project West: “We only require 30 for the remaining work.”
Procurement: “Then transfer 40 and purchase more only if the forecast changes.”
The dashboard is not making the decision for the team. It is providing enough shared context for planning, stores, procurement, and project personnel to evaluate the same inventory situation together.
That is the practical value of cross-team inventory alignment.
Keep the Dashboard Visually Disciplined
A visual inventory dashboard can become just as difficult to use as a spreadsheet if every available metric is placed on the main screen. The primary view should focus on the information users need most often, particularly location, quantity, inventory identity, and operational exceptions.
More detailed reporting can sit elsewhere in the system. The main visual structure should follow the physical hierarchy of the operation so users can move naturally from company to project, then to storage area, location, and item.
Visual signals can support interpretation, but they should remain simple. The dashboard should not depend on a complicated visual language that users need to memorize before they can understand the inventory structure.
Do Not Confuse Visualization with Accuracy
A dashboard can display inaccurate information beautifully. Strong inventory visibility therefore requires both visibility technology and transaction discipline.
The second is often harder to maintain because inventory accuracy depends on everyday behavior across multiple departments. When a site crew moves stock without updating the record, procurement may purchase material the organization already owns. When a warehouse places inventory into a generic location, site teams may waste time trying to find it. When a project fails to return excess stock to the shared inventory view, another project may experience an artificial shortage.
Every unrecorded movement weakens the information used by the next department.
Inventory accuracy should therefore be treated as a shared operating responsibility rather than a warehouse housekeeping task. The dashboard provides visibility, but disciplined receiving, transfers, issues, returns, relocations, and verification are what keep that visibility trustworthy.
CyberStockroom: Enabling Multi-Department Inventory Visibility
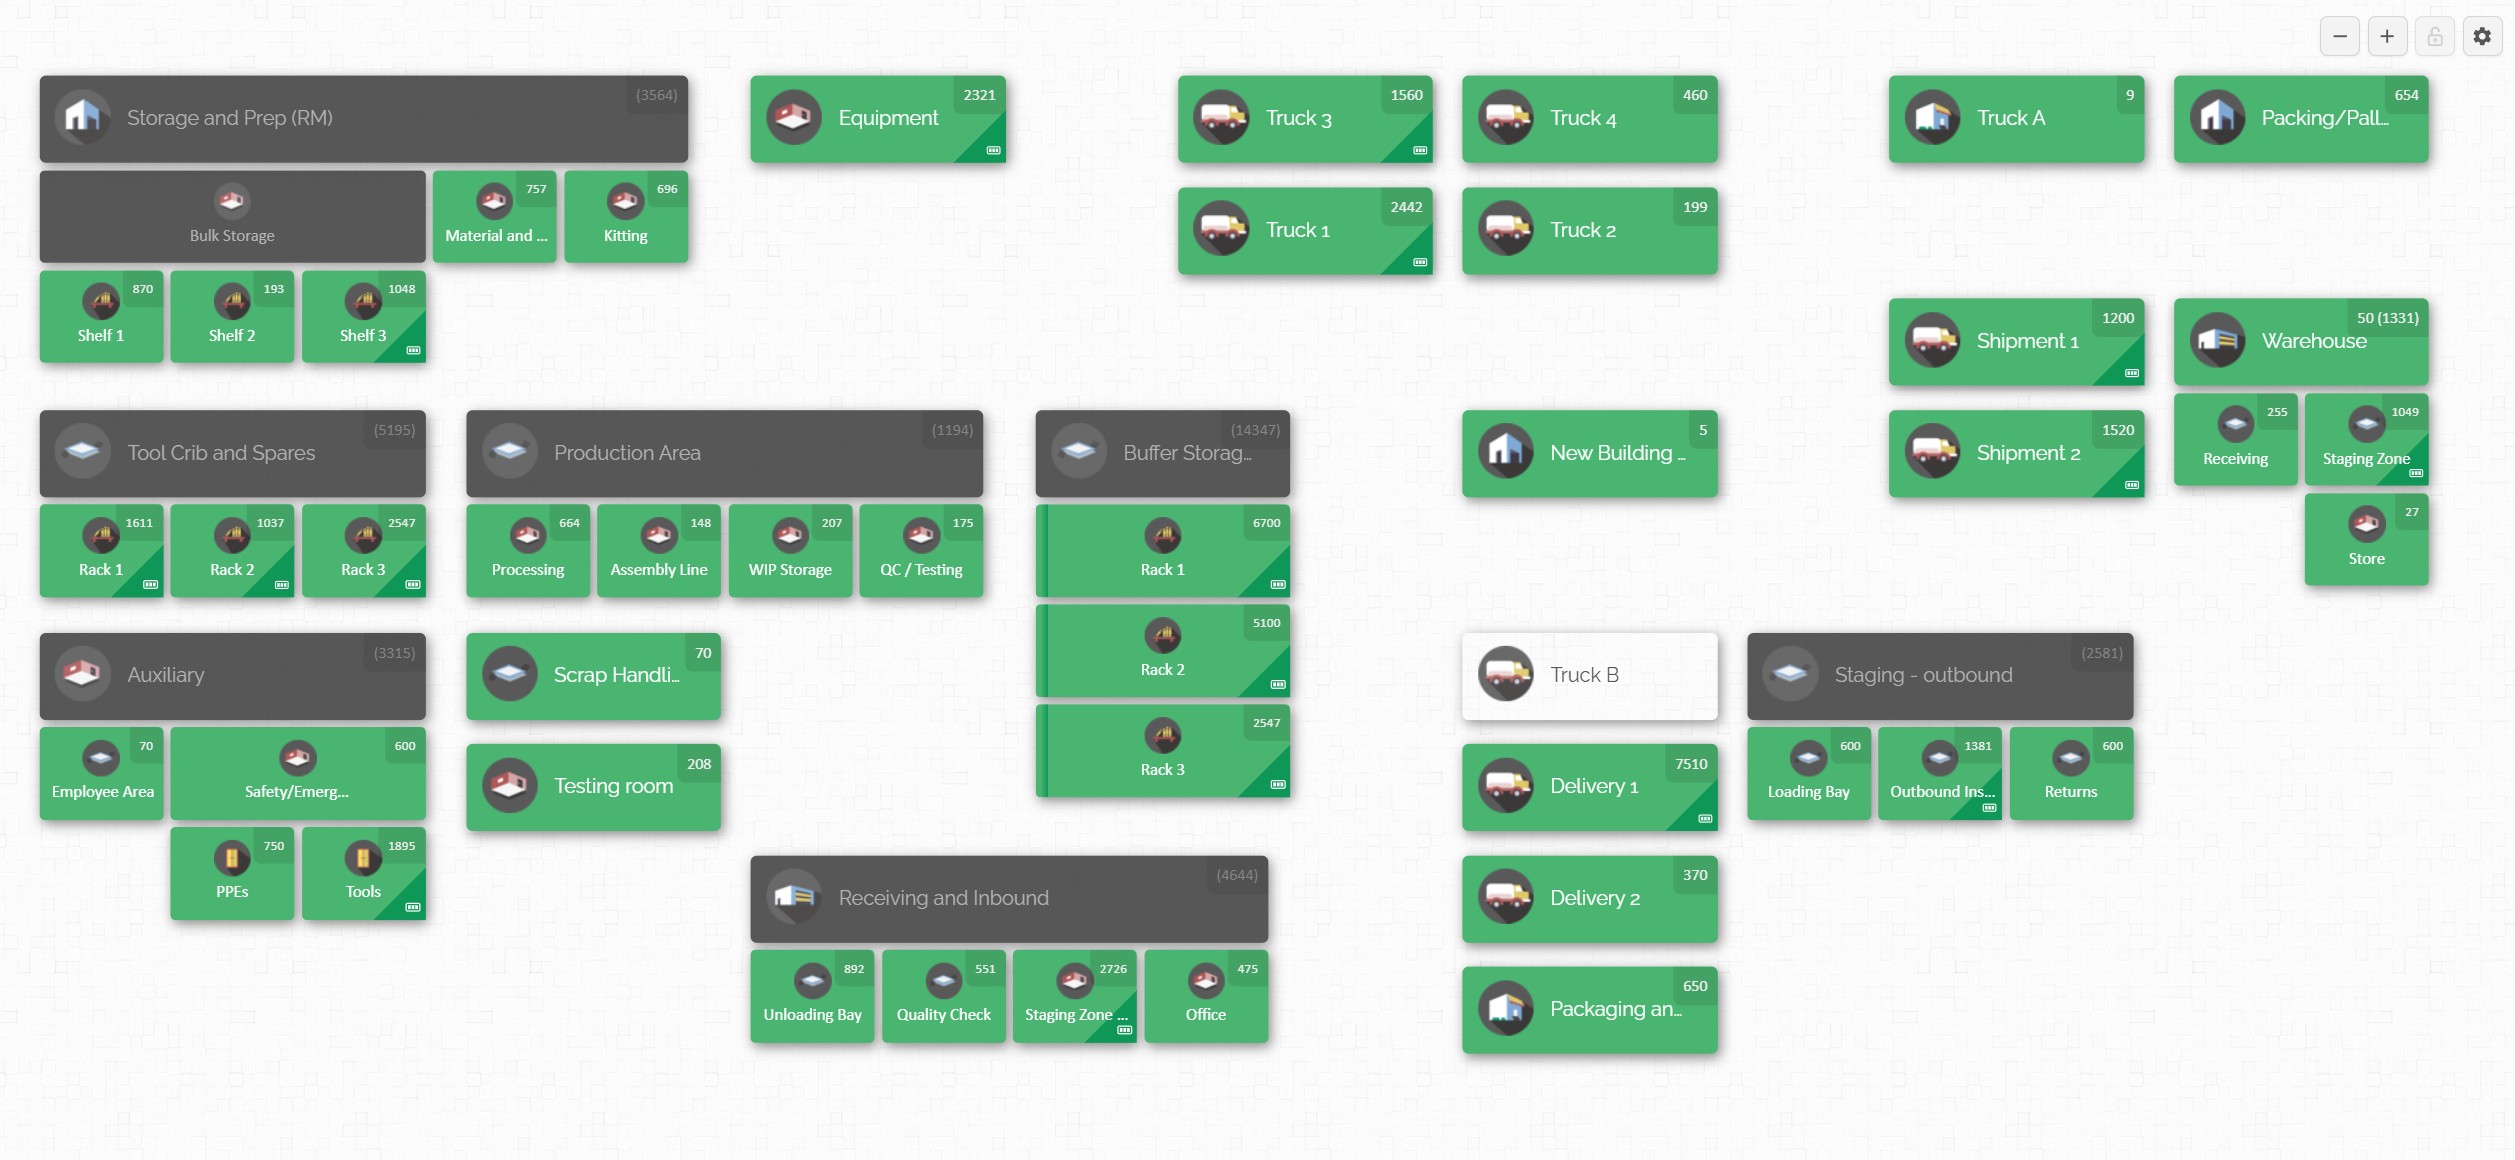
CyberStockroom is an example of a modern, visual inventory platform built around exactly the capabilities described above. It lets construction teams create an interactive, map-based dashboard of their entire inventory system — spanning every warehouse, yard, truck, or storage room. Below, we outline key features of CyberStockroom’s solution and explain how each one directly addresses the problems and best practices we discussed.
| Feature | What It Does | Benefits for Multi-Site Visibility |
|---|---|---|
| Inventory Maps (Visual Layout) | Users can build a custom map or tree of all storage locations (warehouses, buildings, shelves, vehicles, etc.). The layout can mirror the physical layout of your operation. | Provides a centralized map view of all inventory at once. Teams see exactly where each item is stored. This eliminates guesswork and aligns everyone on the same visual representation of sites. It addresses data silos by unifying locations into one dashboard. |
| Real-Time Dashboard | A live dashboard shows current quantities of every item across all mapped locations. Inventory moves or usage are reflected immediately. | Ensures all departments see up-to-date stock levels. If Site A consumes items, procurement and other sites see the change instantly. This real-time visibility prevents double-orders and enables quick decisions, boosting operational efficiency. |
| Drag-and-Drop Transfers | Staff can move items between locations right on the map interface by dragging them, or through quick transfer workflows in the system. Adjustments and cycle counts can also be performed with drag actions. | Simplifies inter-site transfers and on-site adjustments. Instead of paper forms, moving material is just a drag click. This streamlines the transfer process and records the change automatically. It eliminates “informal, unrecorded” transfers and keeps transaction ledgers accurate. |
| Product Distribution (X-Ray View) | Selecting any product (by name or barcode) instantly highlights all locations where that item is stocked, showing quantities and status in each. | Gives an “X-ray” view of where any part or material is distributed across sites. Managers can quickly identify surpluses or shortages of that item. This feature directly addresses stock visibility gaps: instead of searching each site, the dashboard shows it at a glance, so teams can reallocate parts efficiently. |
| Barcoding & Custom Fields | Items can have barcodes, images and custom attribute fields (e.g. part number, category, cost, etc.). The system supports scanning to speed data entry. | Improves accuracy and speed in tracking parts. Barcodes let site crews scan items to check in/out, ensuring the correct stock is logged each time. Custom fields and images aid identification (no more guessing which “bolt” is which), reducing picking errors. All of this increases inventory accuracy and makes the data richer for analysis. |
| Check-In/Check-Out Tracking | The platform logs when items are checked out of stock (for a project or person) and when they are returned. Each transaction is timestamped and user-assigned. | Enhances accountability across teams. For example, when a foreman signs out a generator on site, the system records it. This prevents unlogged removals and losses. Check-in/out logging means every department sees who has each item. It enforces the standardised workflow practice by requiring transactions to be recorded. |
| Loss and Theft Prevention Tools | The system can flag missing items and alert managers if expected inventory doesn’t return. Audit logs are complete for tracking discrepancies. | Helps implement regular audits and shrinkage controls. If a stock audit (say quarterly) shows a mismatch, the platform can show the history of that part’s movements for investigation. By making audits easier and providing clear records, teams can quickly identify where losses occur. This underpins inventory accuracy by catching errors or theft early. |
| Cloud-Based Access and Multi-User | CyberStockroom is hosted in the cloud. All authorized users (managers, warehouse staff, field teams) can log in to the same system from anywhere. | Eliminates information silos. With everyone using the same platform, cross-team alignment is natural. Whether on site or in the office, all users contribute to and see the unified inventory data. It also means settings or map changes propagate for all, so no department falls out of sync. |
| Batch Processing and Importing | The software allows bulk importing of data (e.g. from existing spreadsheets) and batch updates to inventory (such as counting adjustments for many items at once). | Simplifies the implementation steps. When first setting up, teams can upload all existing stock records in one go. Bulk operations also make processes like year-end cycle counts or re-categorization faster. This supports efficient initial rollout and periodic maintenance of data, keeping the system aligned with reality. |
CyberStockroom’s capabilities create a living inventory model of the business. Instead of static lists that quickly become outdated, teams interact with a dynamic map and dashboard that evolves with every transaction. The result is that all stakeholders are literally on the same page (or map), greatly improving communication and planning.

The table below sums up how key capabilities map to benefits:
| Inventory Visibility Need | CyberStockroom Capability | Benefit |
|---|---|---|
| View all sites’ stock simultaneously | Bird’s-eye Inventory Map & Dashboard – whole-enterprise layout display. | Centralized overview prevents unnoticed surpluses/shortages. Aligns department decisions (no hidden stock). |
| Quickly locate any item | X-ray Product View & Search – highlights item across locations. | Saves time finding parts; aids rapid fulfilment and inventory re-balancing. |
| Update stock movements in real time | Barcoding & Drag-and-Drop Transfers – instant transaction logging. | Keeps counts accurate; supports just-in-time stock management. Eliminates data lag and errors from manual logs. |
| Ensure accountable usage | Check-In/Check-Out Logging – ties items to users/locations per movement. | Establishes responsibility for tools and parts. Reduces losses by tracking who had an item and when it returned. |
| Maintain audit trails | Activity Logs & Batch Counts – detailed history of all actions. | Simplifies regular audits; discrepancies can be quickly traced. Increases data integrity and trust in system. |
| Accommodate growth/complexity | Custom Maps and Fields – supports any number of sites and item details. | Scales with business (add new sites easily). Custom data fields ensure every team’s information needs are met. |
(Implementation Tip: Before rolling out, plan your location hierarchy and test mapping the most critical sites first. Then iteratively add others, using batch imports for initial stock levels.)

Implementation Steps for a Unified Inventory Dashboard
Achieving improved visibility is not just about software — it requires structured implementation. The following table outlines key steps to take when deploying a multi-site visual inventory system:
| Step | Action |
|---|---|
| 1. Audit Existing Inventory | Physically count all stock at each site, warehouse, truck, etc. Reconcile these counts with your records. Correct any discrepancies before importing data. This establishes a reliable baseline. |
| 2. Centralise Data into One System | Choose and set up a cloud-based inventory management platform. Configure it with your company’s structure (teams, departments, projects) so that all data flows into a single database. |
| 3. Map All Locations Visually | Define every storage location in the system: warehouses, buildings, floors, containers, vehicles, etc. Organise these locations into a hierarchy or map that reflects your actual business layout. |
| 4. Import Initial Stock Levels | Load inventory quantities into the system. Use the platform’s CSV import or API to bring in item details (SKUs, descriptions) and on-hand counts per location. Verify imports for accuracy. |
| 5. Set Up Processes and Rules | Establish standard workflows (e.g. how to record material transfer between sites, how to check items in/out). Configure alerts and reorder thresholds for key materials within the system. |
| 6. Train Users and Assign Roles | Teach staff (warehouse, field, procurement) how to use the dashboard and input data. Assign access levels: who can adjust stock, who approves transfers, who views which reports. |
| 7. Go Live with Real-Time Tracking | Begin using the system for all transactions. Encourage staff to update usage immediately (e.g. scanning parts out). Ensure all departments refer to the dashboard for decision-making. |
| 8. Monitor Metrics and Audit Regularly | Use built-in reports to monitor inventory accuracy, stockouts, and usage patterns by site/department. Continue periodic physical audits to verify data. Refine processes based on findings. |
| 9. Iterate and Optimise | Review how the system supports efficiency. Adjust location mappings (add new sites), refine categories (adjust ABC thresholds), and incorporate feedback to continually improve the dashboard’s utility. |
Following these steps ensures a smooth transition from fragmented practices to a fully integrated inventory system. The visualisation and tracking tools are most effective when built on solid data and clear processes.
Conclusion
Multi-site construction projects demand that inventory teams overcome visibility challenges to keep work progressing smoothly. By centralising inventory data, enforcing standardised workflows, and using a real-time visual dashboard, companies can achieve high operational efficiency, strong inventory accuracy, and tight cross-team alignment. A single consolidated view — in effect, “one dashboard for all locations” — means that material decisions are made on reliable information and that idle time due to missing stock is minimised.
Solutions like CyberStockroom deliver on these goals by letting teams map their entire operation and see all stock at a glance. Interactive maps, drag-and-drop transfers and live dashboards put powerful visibility in every user’s hands. When properly implemented with disciplined processes (audits, categorisation, KPIs), such a platform keeps every department up to date. The result is a transparent supply chain across job sites and departments, where resource allocation is optimised and unexpected shortages are caught early.
In summary, a visual multi-site inventory dashboard turns complex, dispersed data into actionable insight. Construction inventory teams can then focus on delivering projects on time and on budget, rather than firefighting lost parts. By adopting these best practices and leveraging inventory mapping tools, organisations build an infrastructure that supports growth and collaboration. The payoff is significant: fewer delays, lower costs, and the confidence that everyone is literally on the same page when it comes to stock.








Leave a comment