
Managing inventory across multiple warehouses and work sites can feel overwhelming without the right tools. A unified visual inventory dashboard brings clarity to complex operations by showing stock levels and part locations at a glance.
This comprehensive guide will explore how to consolidate data, map your storage space, and empower teams across departments. We’ll cover best practices for real-time inventory visibility, standardized processes, and cross-team alignment. In particular, we’ll discuss how a map-based solution can transform multiple warehouse locations into one intuitive interface, ensuring every team sees the same information.
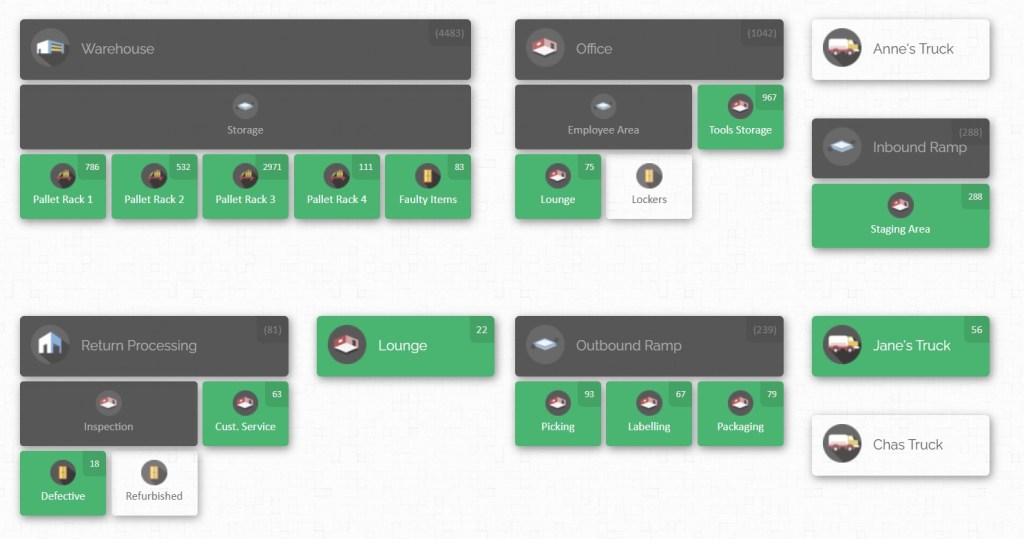
Centralize Inventory Data in One System
The first step in managing multiple warehouses is to centralize your data. Instead of each location maintaining separate spreadsheets or software, use a single system to track stock. This means every part number, quantity, and location from each warehouse feeds into one database. A unified inventory system eliminates discrepancies and lets you query all locations together. When data is centralized, you can roll up reporting across sites to see total stock, identify shortages or surpluses, and make smarter reordering decisions.
A single visual dashboard or platform should display real-time inventory across all your warehouses and yards. Every department – production, maintenance, procurement, and finance – works from the same dataset. For example, if the purchasing team sees low levels of a safety part in one plant, the system can alert them to replenish before it runs out. Likewise, a maintenance crew in another building can immediately see that spare parts exist in a different location. Centralization breaks down silos, ensuring that each team has the full picture of inventory status.
Build an Interactive Inventory Map

A text-based list of parts can’t match the clarity of a visual inventory map. Mapping out your warehouse layouts and linking them to your inventory database turns each location, aisle, rack, and bin into an interactive element on the dashboard. In practice, you draw your warehouses and work areas on a diagram, then assign inventory items to the correct spots.
- Draw Your Space: Sketch the floor plans of every warehouse and yard. Include areas like receiving docks, storage aisles, racks, shelves, open yards, and mobile containers. Layout the map to match the real-world flow so it’s easy for users to intuitively navigate. For multi-story or multi-building sites, draw separate maps or layers.
- Assign Locations: Label each zone with real-world names (for example, “Warehouse A – Aisle 3” or “Storage Yard – Zone B”). When you set up the map, give each shelf, bin, or yard spot its own identifier. Good labeling is critical – crews should recognize the names from their day-to-day usage. Once locations are defined on the map, you can assign items directly to them.
- Visual Stock Counts: The dashboard will show inventory counts at each location on the map. For instance, if you’re looking at the view of Warehouse B, you might see that “Bin C5 – Blue Screws” has 120 pieces. This immediately tells a supervisor where stock is located and how much is there. Color coding or icons can highlight low-stock areas.
With an interactive map, finding an item is as simple as clicking its location. Instead of wandering through shelves or calling colleagues, a technician can point at the screen and know exactly where the needed part resides. A connected dashboard even allows “drag-and-drop” transfers between bins: if part of a lot moves from one building to another, you can adjust its location by moving the icon on the map. This makes tracking inventory movement effortless, reducing errors from manual paperwork.
Real-Time Stock Tracking and Updates
Maintaining accuracy across sites demands real-time tracking. Batch updates or end-of-day logging can leave gaps where the dashboard shows outdated information. Instead, use tools that instantly update stock levels as changes occur. For example, when a part is received or issued, the inventory count should refresh on the dashboard in seconds. This might involve barcode scanning at the point of use.
- Barcode: Equip teams with scanners or tablets at each location. When an item arrives or is used, scanning it updates the central system immediately. The dashboard then reflects the new quantities and location. This avoids double-handling and ensures data accuracy across all sites.
- Scheduled Syncs: If real-time scanning isn’t available, at minimum schedule frequent syncs (for instance, every hour) between warehouse systems and the master dashboard. That way, the risk of missing stock transfers or unlogged usage is minimized.
- User Permissions and Roles: Control who can adjust stock on the dashboard. Ideally, only authorized staff (like warehouse managers or inventory clerks) can make permanent changes. Others might have view-only or request permissions. This oversight prevents accidental data changes and keeps accountability clear.
When your single visual dashboard pulls live data from every warehouse, anyone in the company can answer “How much do we have of part X?” by clicking one button. If Production asks about widgets in Warehouse C and Warehouse D, the dashboard can sum up stock across both instantly. This multi-warehouse snapshot saves time, reduces over- or under-ordering, and improves service to the shop floor.
Standardize Labeling and Processes
To make multi-location tracking work smoothly, standardization is key. Each warehouse should follow the same system for naming parts and locations. This ensures consistency when data is aggregated on the dashboard. For instance:
- Uniform Part Numbers: If one site calls a component “10mm bolt” and another calls it “Bolt 10”, the system might treat them as separate items. Adopt a single naming convention or part numbering scheme across the company. Use part masters or a catalog that each warehouse references.
- Consistent Location Codes: Agree on a labeling structure for your layouts. For example, “WH2-A2-B3” could mean Warehouse 2, Aisle 2, Bin 3. Teams must apply these labels exactly as drawn on the map. This way, when an item is recorded at “Bin 3”, everyone knows which bin that is.
- Unified Barcodes: If using barcodes, encode the same information. A barcode on a box could include the part number, location code, and batch. When scanned, it auto-populates all fields in the dashboard system. This reduces manual entry and error.
Standardized processes extend to how inventory events are handled: receiving, picking, transferring, and counting. Document step-by-step procedures and train all teams to follow them. For example, establish that any time stock moves out of a warehouse it must be recorded on the dashboard before the next shift. When transfers happen between locations (even two sections within the same facility), update the visual map immediately. Having everyone do inventory checks (cycle counting) in a planned schedule also supports accuracy. By aligning all departments on the same rules and codes, your dashboard becomes a single source of truth, not a messy patchwork.
Enable Cross-Team Communication and Alignment
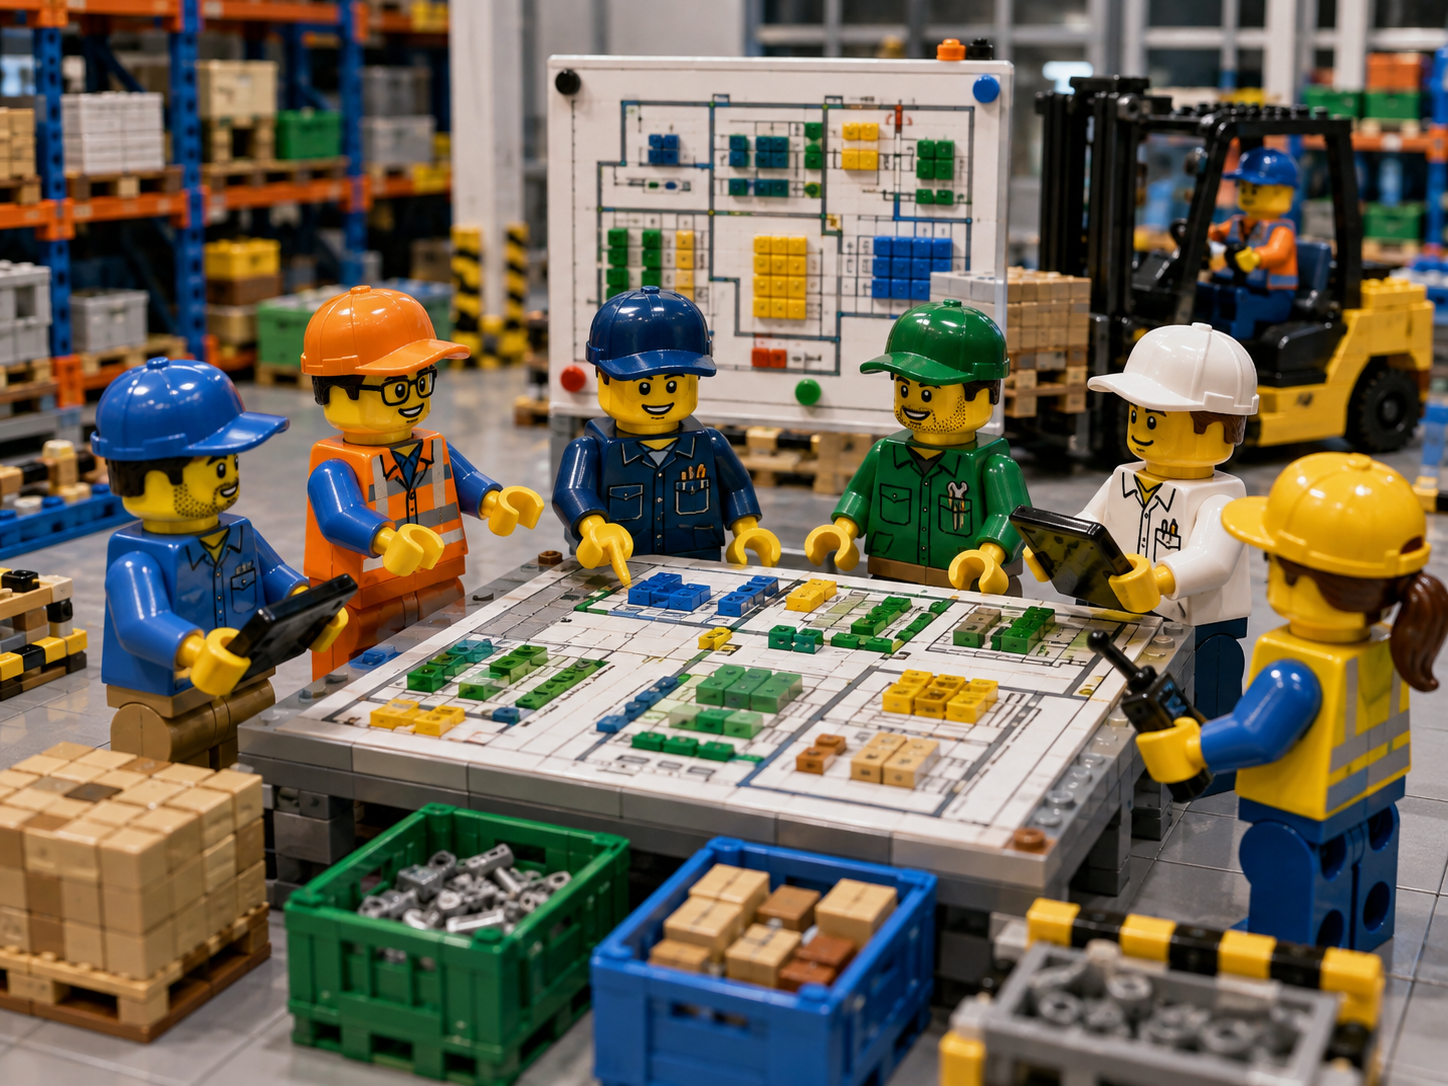
Inventory visibility isn’t just an operations issue – it’s a business imperative that involves many teams. The dashboard should be a shared tool, uniting maintenance, engineering, purchasing, production, and warehouse staff. Here’s how to foster alignment:
- Shared Access: Make the dashboard accessible to all relevant stakeholders. Maintenance supervisors can check for available spares before raising a requisition; production planners can see part lead times and stock levels; and procurement can see burn rates to predict orders. When one team updates a part count, others see it immediately.
- Role-Specific Views: Tailor views for different teams. For example, a maintenance team might want a view filtered to “critical spares” and “current project stock across all sites”, while the warehouse manager wants to see overall occupancy. A good dashboard lets you set up custom filters or dashboards for each role.
- Reports and Meetings: Include inventory metrics in regular cross-functional meetings. For instance, a weekly review of stock-outs or slow-moving items across all warehouses helps different departments coordinate. The visual dashboard can project the data on screen during these reviews. Seeing the same map and figures, teams make aligned decisions.
By ensuring everyone “speaks” the same inventory language on the dashboard, you eliminate finger-pointing over stock issues. If production runs out of parts, they’ll have visibility on the system that the items were still in another warehouse, and they can either transfer them or escalate procurement. When finance reviews asset value, they can simply pull a single inventory report. In short, a single visual dashboard builds one version of the truth, so teams work together toward company goals rather than dealing with conflicting numbers.
Optimize Warehouse and Yard Layouts

A visual dashboard not only shows stock levels but also highlights how well you use space. With mapping, you can optimize layouts based on real usage:
- Space Utilization: Identify underused or overcrowded areas. On the map, you might notice some racks are nearly empty and others overfilled. Reorganize stock so that fast-moving parts are easy to reach and rarely-used parts are stored in less prime spots. This improves picking efficiency and frees up valuable space.
- Zone Planning: Visual mapping lets you carve your warehouse into logical zones (e.g. raw materials, work-in-progress, finished goods). Teams can then apply different handling procedures or safety measures per zone. For example, heavy items could live near loading docks, while fragile items go to protected areas.
- Staging and Transfers: Use the dashboard to designate staging areas for inbound and outbound stock. When shipments arrive, you might first put them into a “Receiving Zone” on the map before moving them into storage. The system can track how long items stay staged and ensure they are promptly moved into shelves. Similarly, when items are transferred out for projects or jobs, track them as they move through “Staging” and “In Transit” areas.
- Seasonal or Project Areas: If your warehouses handle seasonal inventory or specific projects, create temporary zones on the map. For example, a construction project might allocate a yard section for pipes and lumber. As demand changes, the map can be adjusted to add, resize, or remove zones. This flexibility keeps the visual dashboard reflecting reality, even as layouts evolve.
Optimizing layouts in this way, guided by the dashboard, cuts search time and congestion. When a worker needs parts, they can go directly to the mapped location instead of wandering a maze of aisles. Less forklift traffic and fewer double-handling steps means tasks finish faster. Over time, teams can tweak the layout on the dashboard and see immediate impact – a data-driven approach to space planning.
Leverage the Dashboard for Audits and Compliance
Audits, whether internal or external, become easier with a visual inventory system. Because every item has a recorded “home” on the dashboard map, you can quickly verify stock. Best practices include:
- Cycle Counting: Instead of full inventory shutdowns, perform regular cycle counts by area or product category. Use the map to schedule and record these counts. For example, label zones in a sequence and count one zone per day. The dashboard shows expected vs. counted quantities for quick reconciliation.
- Variance Reporting: After counts, the system flags any discrepancies. Perhaps you discover that location “Shelf A2-Bin 4” is off by ten screws. With the interactive map, you can double-check that spot on the floor and correct the data immediately. Keeping the map up-to-date means the dashboard is always trustworthy.
- Audit Trails: A good inventory dashboard logs who changed what and when. In a multi-location setup, this is crucial for accountability. If stock counts shift, managers can see whether it was due to a registered transfer, a count update, or another event. This audit trail supports compliance with standards like ISO or company policies.
Using the dashboard as the source of truth for audits speeds up the process and minimizes errors. Instead of spreadsheets littered with notes, auditors see live data. Moreover, teams get in the habit of using the dashboard daily, so at audit time there are no surprises.
CyberStockroom: Mapping Your Inventory for Full Visibility
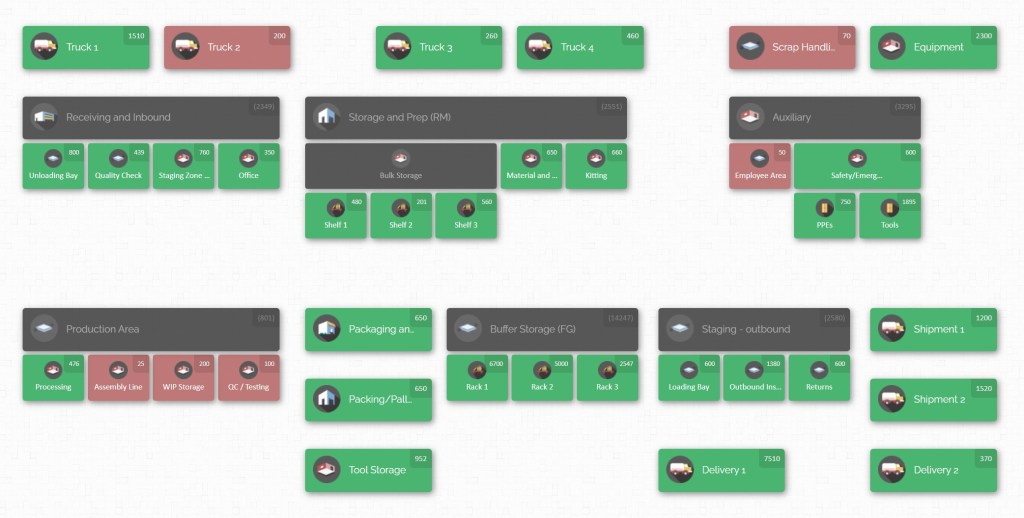
To tie these concepts together, consider how a visual inventory platform can support them. For example, CyberStockroom (an inventory mapping software) exemplifies many of the best practices we’ve discussed. It helps teams track parts and tools across warehouses, yards, and projects — all on one map.
- Interactive Maps Across Locations: You can build digital layouts of each warehouse and yard. Each map can connect to others, allowing you to zoom out and see multiple facilities simultaneously. If your company has warehouses in different cities, the dashboard still shows them side by side. Everything from a building’s address to the smallest bin is clickable on the screen.

- Real-Time Stock Visibility: As items move, the dashboard reflects changes instantly. Scan or select a product and see a distribution view of where that part exists across all sites (sometimes called “x-ray vision” in mapping software). This means you can spot a low-stock condition at any branch immediately and reorder or reallocate stock before it becomes a problem.
- Drag-and-Drop Transfers: The system treats locations like objects on the map. To move inventory, authorized users literally drag the part icon from one location to another. No forms or separate transfer tickets are needed — the action updates both the origin and destination in one step. This visual transfer tool helps teams coordinate hand-offs between facilities or departments with zero confusion.
- Nested Locations for Detail: Complex sites can be broken down in layers. For instance, CyberStockroom lets you define “Yard > Area > Container > Pallet > Box.” You might have a yard for each project, and inside that, many containers. On the dashboard, you can click into a pallet to see the boxes it contains and the items inside each box. This level of detail ensures nothing slips through the cracks, whether it’s bolts in a cabinet or pipes on an outdoor rack.
- Team and Department Views: The map can also represent departments or teams. You could color-code areas or assign labels like “Electrical Crew Tools” or “Mechanical Spares.” This helps crews know exactly which parts they’re responsible for. When maintenance techs open the dashboard, they see their team’s assigned inventory highlighted, helping enforce accountability.

All these features mean teams across departments gain a shared, visual understanding of inventory. A procurement manager planning bulk orders can look at the dashboard and see that one warehouse has plenty of fasteners, so shipping there first makes sense. A project leader on site can confirm that the needed materials are coming from the main warehouse and even see which truck it’s on. By tying data to map locations, CyberStockroom (and tools like it) turn abstract inventory numbers into actionable, visual information.
Tips for Implementing a Map-Based Dashboard
If you decide to adopt a map-driven inventory system, here are some detailed tips to ensure success:
- Start Broad, Then Refine. Begin mapping major zones first (receiving, general storage, shipping). Don’t try to place every single shelf on the first pass. Get the big picture correct so teams see the overall flow. You can then drill down into detail over time.
- Use Familiar Labels. Name locations exactly as your team would speak them. If operators already know a space as “North Yard A” or “Bin C4,” use those names on the map. It reduces confusion and speeds up adoption. Avoid cryptic codes that require cross-referencing a key.
- Respect Physical Layout. The map should mirror reality. If your warehouse has two main entry doors on the west wall, place the map’s west side accordingly. Consistent orientation helps new staff orient themselves. Also, spatially separate indoor areas from outdoor yards on the map, just as they are in real life.
- Leverage Nested Structure. Use multi-level mapping. A warehouse might be broken into aisles, then racks, then shelves. This keeps the main view uncluttered while allowing deep detail when needed. For example, staff could click on “Rack 5” to expand and see all shelf levels.
- Include Mobile or Temporary Areas. If you often use movable containers or trailers for storage, add them to the map as dynamic zones. For example, map a trailer by license plate and update its location as it moves between yards. This ensures your dashboard never loses track of stock on the move.
- Plan for Growth. Leave space on the map for new equipment or storage. If you know more racks or shelves will be added in the coming months, allocate blank areas or placeholder zones. That way, you can simply add to the map without redrawing the whole layout.
- Train and Onboard Visually. Use the map as a training tool for new hires. It’s much easier to teach warehouse protocols when you can point at the map. Encourage teams to start each day by checking the dashboard so it becomes second nature.
- Keep It Clean. Don’t clutter the map with unnecessary detail. Only map permanent or long-term features; short-lived changes can be handled in the system without updating the drawing. The map should stay lean so it’s easy to read and quickly loaded on any device.
By following these steps, you’ll create a map that actually gets used. A clear, intuitive layout empowers teams to manage the system rather than struggle with it.

Maintaining Inventory Accuracy
All the technology in the world can’t help if the data isn’t maintained. To keep your multi-location dashboard accurate:
- Enforce Data Entry Rules: Make sure every transaction (receipts, issues, transfers) goes through the dashboard. No exceptions. This often means tying access to scanning tools or a sign-off process.
- Regular Reconciliation: Use the dashboard reports to spot inconsistencies. If the system shows negative stock or duplicate entries, investigate and correct them immediately. Ideally, errant entries get caught in daily or weekly spot checks.
- Clear Ownership: Assign an inventory coordinator or team at each location responsible for updates. Even though data is shared, having local accountability speeds up fixes.
- Frequent Training Refreshers: As systems evolve, periodically retrain staff on best practices. Reward accuracy. When employees see that the dashboard helps their job (for instance, finding parts faster), they’ll naturally maintain it better.
- Integrate Physical Checks: Whenever possible, align physical audits with the system. If a physical count shows discrepancies, use that as a learning moment to refine processes. Sometimes a gap reveals an untracked way stock was moved, which can then be addressed.
Maintaining data hygiene ensures that when leaders “take a snapshot” of inventory on the dashboard, it truly reflects the ground reality.
Measuring Success with Your Dashboard
To quantify the benefits of your dashboard, consider tracking some key indicators over time:
- Inventory Turnover and Days on Hand: As visibility improves, you should see turnover rates optimize. The dashboard can calculate these automatically, even across multiple warehouses.
- Stockout Incidents: Record how often a needed part was unavailable. A drop in stockouts shows the system helps teams anticipate shortages.
- Search Time: A practical measure is time spent locating items. This often drops dramatically when workers use a map. Survey your staff or time trials to compare “before and after” scenarios.
- Audit Variances: Track discrepancies found in cycle counts. Ideally, variance percentages will fall as the dashboard system takes hold.
- User Adoption: Monitor how often teams log in and update data. High adoption rates generally correlate with higher accuracy and efficiency.
By reviewing these metrics on the dashboard itself, you can prove ROI in continuous improvement cycles. Over time, the goal is for data-driven insights from the dashboard to guide ordering, layout changes, and process adjustments.
Conclusion
Managing parts and materials across multiple warehouses doesn’t have to be a headache of separate spreadsheets and guesswork. A single, visual inventory dashboard ties everything together – all locations, all departments, all data – in one clear interface. When best practices like standardized labeling, real-time tracking, and shared processes are in place, the entire organization gains better control. Teams work from the same “map” of inventory, which leads to fewer errors, faster operations, and smarter decisions.
For busy inventory and operations managers in manufacturing or construction, the payoff is huge. You’ll reduce stockouts and excess inventory, streamline audits, and align every team around a common source of truth. In the long run, the unified dashboard becomes more than just a tool – it’s the backbone of an efficient, agile warehouse operation. Embrace the power of visual inventory mapping and watch productivity soar across all your sites.







 CyberStockroom
Leave a comment