
Effective inventory reporting is vital in any industrial or manufacturing operation. It ensures that every department – from maintenance and procurement to production and quality – knows exactly what parts are available, where they are stored, and when replenishment is needed. By tracking the right inventory metrics and establishing a clear reporting cadence, businesses can minimise downtime, avoid emergency orders, and align all teams around a single source of truth.
In this guide, we explore the key things to track in an industrial inventory system and when to report them, with a focus on cross-department parts visibility and efficiency. We also illustrate how a visual system can turn data into an intuitive, shared dashboard.
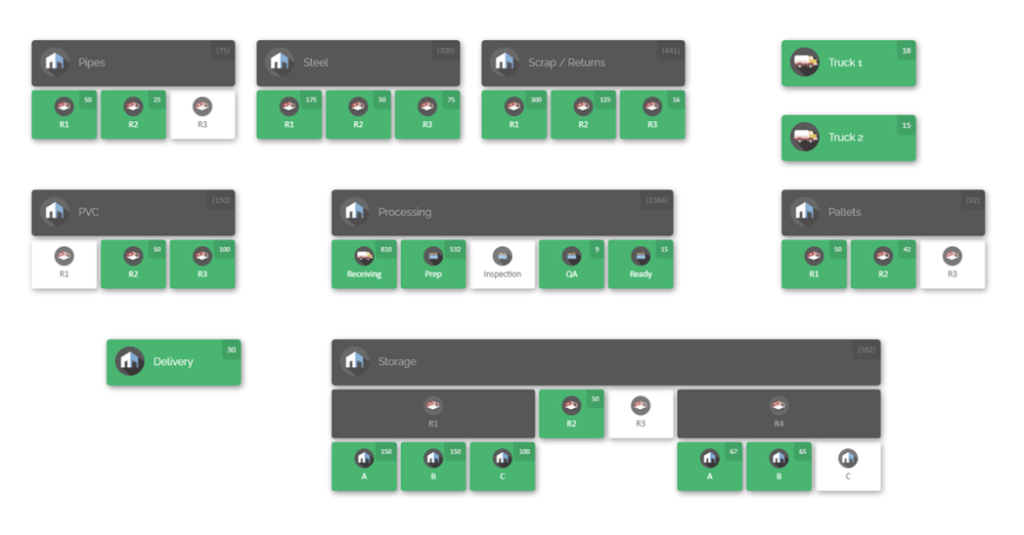
Consider a modern warehouse or job site with parts spread across storage racks, floor bins, vehicles, and tool cribs. To keep track of all those parts, teams are moving beyond spreadsheets and using visual mapping tools. The example map above shows how locations can be organized into a visual layout. Each area is labelled and shows the quantity of key parts (e.g. drills, hoses, bolts). By embedding location logic into the system, anyone can click on a location to drill down and see exactly which products are there and how many. This kind of digital inventory map turns scattered stockrooms into an interactive picture, making it easy to answer questions like “How many of Part X do we have, and where is it?” at a glance. Throughout this article, imagine that kind of map as the backdrop: every data point we discuss can be visualised on a shared layout of the facility, ensuring all departments see the same inventory picture.
Key Inventory Metrics and Data Points

Successful industrial inventory management relies on tracking the right data for parts and materials. The exact metrics will vary by operation, but some of the most important inventory data points to record and report include:
- On-hand quantities by location. For every part number or SKU, record how many are in each storage location (warehouse aisle, bin, vehicle shelf, etc.). This goes beyond a total number – it ties items to the precise places they can be found. By tracking quantities at each location, you can accurately allocate stock to jobs or orders and avoid the classic problem of one department thinking a part is available when it’s been consumed elsewhere.
- Critical parts and safety stock levels. Identify parts that are line-stoppers or maintenance-critical (often called “A” items) and note their safety stock targets. Reporting should flag any critical item that approaches its safety stock or reorder point. These alerts allow procurement and stores teams to replenish proactively before a stockout occurs. Recording minimum and maximum levels for key parts ensures that reports can highlight when inventory falls outside the desired range.
- Inventory accuracy and reconciliation data. Track discrepancies found during cycle counts or audits: how often the system count differs from the physical count, and by how much. Recording count accuracy (for example as a percentage of locations with correct counts) helps measure the health of your reporting process. This metric should also capture the root causes (misplaced parts, missed scans, procedure lapses) so teams can fix issues.
- Usage and consumption rates. Monitor how many units of each part are used over time. This can be broken down by department or line. Trending consumption helps forecast future needs and validates whether actual usage matches planned budgets or schedules. For multi-department visibility, it’s useful to report usage by department – for example, how many bearings were pulled by maintenance vs used in production. These breakdowns highlight if any team is monopolising a part without cross-team awareness.
- Stock movements (check-ins and check-outs). Every transfer or movement should be logged. Reports can summarise incoming receipts and outgoing issues per part. For example, a weekly report might list all transfers between storage zones, or all parts checked out to a job site. Clear reporting of movements ensures nothing disappears into a hidden bin. When used consistently, this data creates a reliable history of where each part went and who initiated the move.
- On-order and in-transit inventory. While this often involves an external system or purchasing data, it’s useful to note expected arrivals that have not yet hit the floor. By comparing current on-hand with pending purchase orders, reports can project when current orders will arrive and whether extra expedited orders are needed.
- Fill rate and order accuracy. Track how often orders or requisitions for parts are filled in full from stock. A high fill rate means most requests are met immediately from inventory; a low fill rate indicates frequent shortages. Similarly, track picking accuracy (were the correct parts and quantities delivered). These KPI reports help teams know if inventory levels and reporting are supporting operational needs.
- Inventory turnover and aging. While common in manufacturing, it’s still useful in industrial settings to compute inventory turnover (consumption divided by average on-hand) for major parts or groups. Also report aging of inventory to identify obsolete or slow-moving stock tying up capital.
In summary, inventory reporting should capture both current status (“what is on hand, where, and who holds it”) and change over time (“what moved in or out”). Reports typically include real-time inventory snapshots for current counts, alongside historical usage and movement logs. This combination ensures all stakeholders – procurement, operations, maintenance, finance – can make informed decisions based on the same data.
Reporting Cadence: When to Report Inventory Data

Tracking data is only useful if reports are delivered at the right times. An effective inventory reporting cadence aligns with operational rhythms and decision points. Below are guidelines for what to report daily, weekly, and monthly in an industrial setting:
- Daily Reports and Updates: Some information needs to be refreshed every day (or shift) to keep the lines moving. End-of-day inventory levels for critical parts are common: for example, report remaining stock of safety-critical spares, fast-moving consumables, and any parts running low. Daily transaction logs (what was received, issued, or transferred today) help catch errors early. Many teams also use daily briefings (e.g. morning meetings) that include a quick inventory status: Did any part fall below its reorder point overnight? Did any department report a missing or damaged item? In a digital system, daily tasks might include scanning items received or installed so the system’s counts are always current. These daily updates prevent “blind spots” and ensure that if one department uses parts, the rest see it immediately.
- Weekly Reports and Reviews: A weekly inventory report often looks for trends and prepares for near-term planning. For example:
- Low-stock alerts: A weekly summary of parts that are at or below their safety levels. Procurement and warehouse teams can review this regularly to prioritise reordering.
- Cycle count results: If you run cycle counts on a weekly schedule (perhaps one category or zone each week), include any discrepancies found and actions taken.
- Usage trends: Show how many units of each major part were consumed that week. This can highlight unexpectedly high usage (e.g. due to a machine running hot or a new project) or parts that may have been siphoned off to a different area.
- Inbound/outbound volumes: Summarise weekly receipts of new stock and shipments or usage (outbound to jobs or production). This helps link inventory to actual production or project work.
- Exception reports: Identify anything unusual – parts moved without records, manual adjustments, or potential data entry errors.
By reviewing these reports weekly, teams can detect problems before they escalate. For example, if one worksite is consistently drawing more parts, the team can investigate the cause (equipment issue? process change?). A weekly review meeting with all relevant departments is a great time to go over these reports together, ensuring alignment on inventory status.
- Monthly and Quarterly Reports: On a longer timescale, reports focus on performance metrics and strategic checks:
- Inventory value and turnover: Calculate the total inventory value and turnover ratio for key categories. Rising or falling trends in inventory value can signal overstock or supply chain changes.
- Fill rate and service level: Measure the percentage of requisitions or orders fulfilled from stock each month. If service levels are slipping, it prompts analysis of stocking policies.
- Cycle count and audit summaries: Monthly (or quarterly) the team might audit critical areas or conduct full physical counts. Report the results (accuracy rates, missing items resolved, etc.) and any corrective actions. This ensures long-term accuracy of the records.
- Deadstock and obsolescence: List any parts identified as obsolete or never used during the month, so they can be reviewed for clearance or removal.
- Budget and forecast alignment: Compare actual usage and spending against forecasts or budgets. Large variances may require adjusting consumption forecasts or reorder strategies.
By setting up a clear schedule – daily checks for immediate visibility, weekly deep-dives, monthly overviews – the business creates a rhythm of reporting that keeps inventory aligned with needs. Consistent timing also means reports become a habit, reducing surprises. When reports are predictable, teams can rely on them to plan their work (for example, a weekly inventory report might feed into a Monday planning meeting).
Best Practices for Inventory Visibility and Reporting
Achieving full visibility across departments requires more than just data – it requires disciplined processes and tools that reinforce each other. Here are some best-practice guidelines:
- Centralize Inventory Data in One System. The single most important step is to consolidate all inventory records into one unified system or platform. Instead of each department maintaining its own spreadsheets or logs, use one database that captures transactions for the entire facility. This way, when procurement orders arrive at receiving, or maintenance removes a part, those changes update the same ledger. Modern cloud-based solutions are ideal, as they let all teams access current inventory data from anywhere. With a single source of truth, there are no silos of data: a planner in the office sees exactly what a foreman on the shop floor is seeing. This prevents one team from unknowingly stocking up on parts that another department already has in abundance. Centralisation streamlines reporting too, since every report – whether daily dashboards or monthly audits – draws from the same data set.
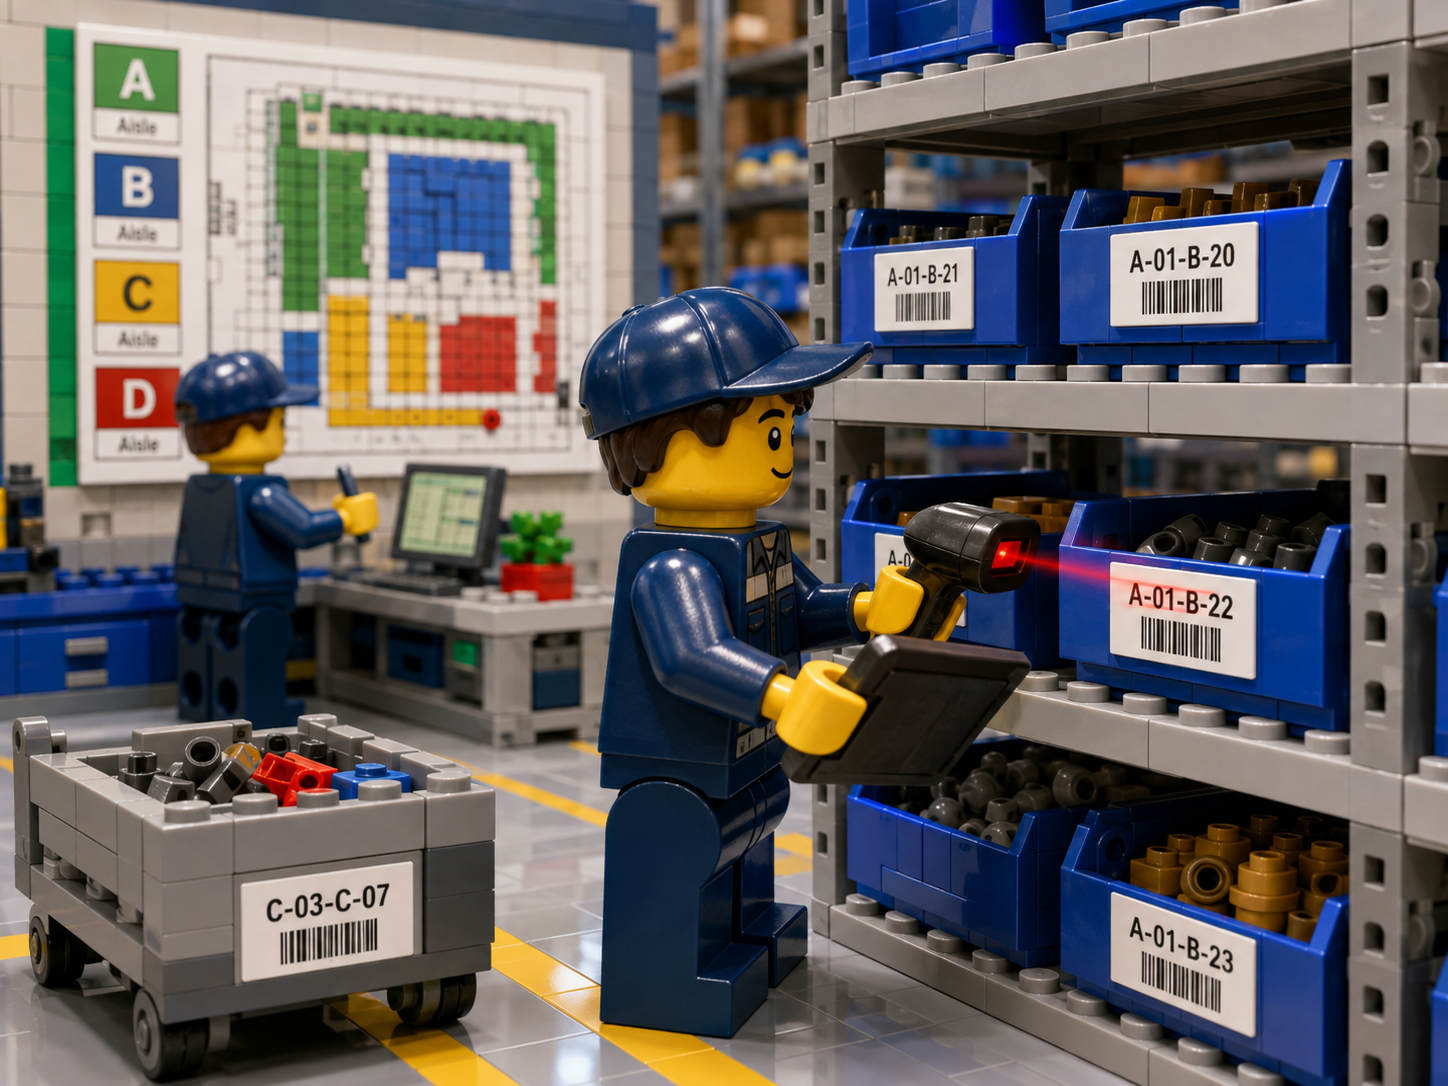
- Standardise Labeling and Location Naming. Consistency is key to cross-team understanding. Every part should have a unique identifier (SKU or part number) and barcode and every storage location (aisle, rack, bin, cart, etc.) should have a clear, systematic label. For example, warehouse aisles might be labelled A, B, C, each bin numbered. A part scanned or requested from “Aisle B, Bin 12” should point to the same place for all users. Standardising naming conventions – using the same format for location codes across buildings and departments – prevents confusion. Without this discipline, simple differences in terminology can hide parts from other teams. A manufacturing engineer might say “left-shop Cabinet 3,” while procurement calls it “Electrical A Bin 5” – if the system doesn’t enforce one standard, neither team can easily find each other’s inventory. By embedding a hierarchy of locations in the system (site → building → room → rack → shelf → bin), and sticking to it, reports can aggregate inventory accurately and personnel can trust that “A-01-B-22” means the same place every time.
- Map Inventory Around Physical Flow and Operations. The way inventory is organised should mirror how it’s used in practice. Start with the material flow through the facility. Map how parts move from receiving to staging, to storage, to point-of-use on the line or maintenance bay. Create specific zones for different purposes (e.g. receiving, inspection, approved stock, quarantine, line-stock, maintenance stores, etc.) and map them in the system. This mapping principle means the dashboard you use will reflect actual processes, not abstract reporting lines. For example, instead of putting a part in a generic “parts closet,” place it in the mapped location where workers will find it (like “Line 2 Spare Parts Shelf A”). A map-based system makes these flows visible: you can literally drag an item from “Receiving Dock” to “Assembly Line 2” on the screen, just as it was moved physically. This approach prevents “shadow stock” situations where a department hoards parts in an untracked nook. Every time material changes hands, it is moved on the map too, so the digital view matches the real world.
- Implement Real-Time Tracking with Barcodes or Scans. To keep data fresh, record inventory movements at the moment they occur. Equip your process with barcode scanning so that adding, moving, or issuing parts is fast and accurate. For instance, when a pallet is delivered, scan the delivery receipt and items as they are placed in inventory. When a maintenance crew pulls parts for a repair, have them scan each part and its storage location before putting it in their cart. When possible, also scan the destination (for example, scanning both the part and the target location’s barcode) to confirm the move. By scanning both parts and locations, the system updates quantities automatically. This means that as soon as the scanner beeps, the database is updated – making manual data entry (and the errors that come with it) a thing of the past. In practice, that means every team member can immediately check the system on their device and see the updated count, no matter where they are. Real-time scanning eliminates the “silent period” where someone knows a part was moved but the rest of the team does not. It also reduces paperwork and the need for notes on clipboards, which are often never entered into the system.
- Conduct Regular Cycle Counts and Audits. Even with best practices, inventory records can drift over time. Routine cycle counting – auditing small subsets of inventory on a regular schedule – keeps accuracy high. A common practice is to classify parts by importance (an ABC analysis) and count the most critical or fast-moving items more frequently. For example, “A” items (high value or high usage) might be counted weekly, while lower-priority “C” items are counted monthly. When a count is done, immediately reconcile any differences and investigate anomalies. Trends from counts (such as repeatedly missing items in a particular area) can signal process gaps. In addition, schedule full audits of major storage areas (like once per quarter) so everyone in the organisation can trust the system’s totals. Accurate counts are the foundation of good reporting – you can build dashboards all you want, but if the underlying data isn’t accurate, the reports will mislead decision-makers.
- Visualize Inventory with Maps and Dashboards. For human beings, pictures beat spreadsheets every time. Instead of forcing staff to interpret long tables of numbers, implement visual dashboards that show inventory on facility maps or interactive charts. The inventory demo map above is an example – clicking on a highlighted bin immediately lists its contents. Dashboards can also highlight critical items with colour coding (e.g. red for low stock, yellow for reorders pending). When inventory data is tied to a visual layout, any team member – whether a floor supervisor or an executive – can instantly see overall status. This aligns with lean and 5S principles by making stock levels and abnormalities obvious. For example, a map might flag that a line-side spare bin is empty (triggering an immediate alert) or that stock is piled up in the quarantine area. By presenting data in context, managers spend less time deciphering reports and more time acting on exceptions. This visual approach also aids training, as new staff can learn the layout through the map rather than memorising codes.
- Set Automated Alerts and Reorder Triggers. Waiting to discover a stockout after it happens is costly. Define reorder points or safety stock for critical parts, and let the system notify the appropriate person when levels approach those thresholds. For example, the system can automatically flag when an item dips below its safety stock or generate a purchase requisition. Likewise, set alerts for overstock situations (which may indicate miscounts or changed demand). These automated alerts become your digital “overseer,” catching issues around the clock. Tying alerts into your visual dashboard ensures that everyone can act in time. For instance, if an important bearing on a machine is low, an alert might ping both maintenance and procurement – prompting a discussion about whether to reorder or delay maintenance. By proactively managing reorder triggers, you transform reporting from reactive to preventive.
- Leverage Data Analytics for Continuous Improvement. Reporting isn’t just for looking backward; it should inform future actions. Regularly analyse inventory data trends to refine processes. Monitor KPIs like inventory accuracy, fill rate, turnover, and stockout incidents. For example, if a particular part’s usage suddenly spikes, dig into the reasons: a new product line? Excess waste? If inventory accuracy falls consistently below target (say 98%), examine root causes – maybe a process needs tightening. Use reports to forecast demand: high-quality usage data, when fed into planning, helps set better reorder points and safety stock. Some systems allow exporting data to business intelligence tools; these can uncover patterns that a simple report can’t. The key is to make reporting part of a feedback loop: learn from what the numbers say and adjust your stocking, layout, or procedures accordingly. Continuous improvement is the goal – the reporting process should evolve as your operation grows, not stay static.
- Foster Cross-Department Alignment and Training. Lastly, reporting only works if people use it. Educate every department on the importance of inventory visibility. Encourage staff to treat updates as part of their daily routine. Assign ownership clearly – for example, a designated inventory coordinator on each shift or team who is responsible for reviewing that week’s reports and follow-ups. Share the same reports across departments so everyone can view the same data. Regularly bring stakeholders together (production, maintenance, stores, procurement, etc.) to review inventory status and discuss discrepancies. When cross-functional teams see the same information, they tend to find collaborative solutions (for instance, consolidating low-use parts rather than each department ordering separately). In short, build a culture where inventory reporting is a shared responsibility, not just an accounting formality.
By following these practices, operations teams create a disciplined routine around inventory reporting. Every part and pallet is consistently accounted for, and every movement is recorded. The result is fewer surprises in the supply chain, improved efficiency, and a shared awareness of exactly how many parts you have and where they reside.
CyberStockroom: A Map-Based Solution for Parts Visibility
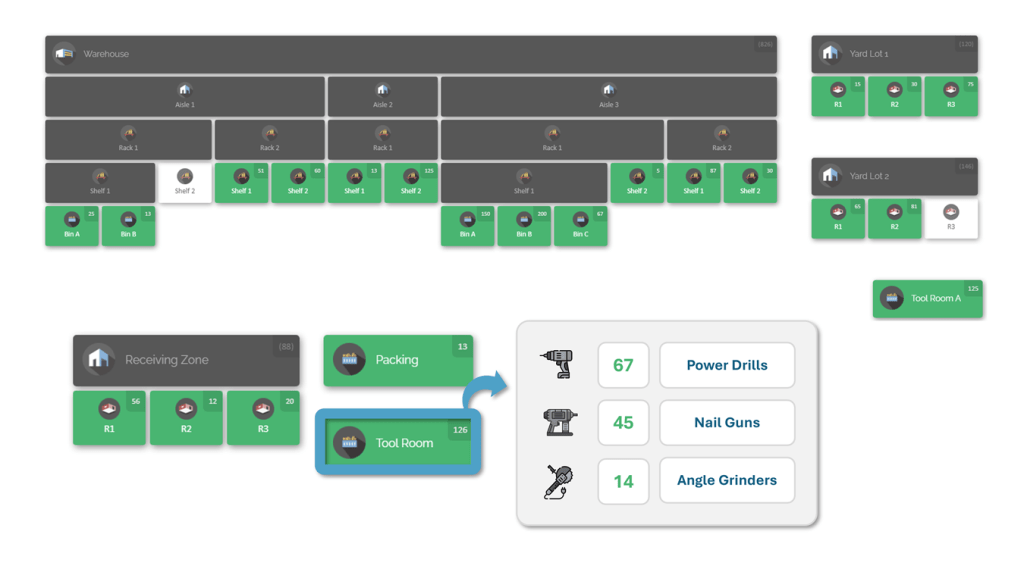
In practice, achieving these best practices is much easier with the right tool. CyberStockroom is one example of a map-driven inventory platform designed for industrial settings. Its features align closely with the needs we’ve discussed:
- Interactive Inventory Map: CyberStockroom lets you build a custom 2d “digital twin” of your entire operation. You can draw floor plans and layouts for warehouses, laydown yards, trucks, or any storage area, defining zones down to aisles, shelves, and bins. Once mapped, every part can be checked into a specific location on that map. The result is that you navigate your inventory visually: instead of searching by SKU on a list, you look at a map and click on “Tool Room A” or “Rack 3B” to see exactly what’s there. This map-based interface turns raw data into a living, intuitive view of the facility. It directly supports cross-team visibility – everyone sees the same map and inventory positions, so there’s no confusion over different naming conventions or disconnected records.

- Real-Time Updates via Scanning: The platform supports scanning barcodes for both products and locations. For example, when a worker receives new parts, they can scan the items and the map location where they belong. The system immediately updates the on-hand quantity at that spot. Similarly, when transferring parts, a simple drag-and-drop action on the map (or scanning the source and destination codes) records the move instantly. This real-time update capability ensures that reports are always current. There’s no lag between physical movement and the digital record, so if maintenance pulls a spare for urgent repair, others can’t inadvertently allocate it elsewhere. Because updates occur in the cloud, any user on any device sees the change immediately, whether they’re on the factory floor or in an office.
- Centralized Cloud Platform: CyberStockroom runs in the cloud, meaning all data is stored centrally and accessible from any web-connected device. This centralised database becomes the “single source of truth.” No matter where work is happening – a main warehouse, a remote site or a vehicle – all inventory counts and movements converge into one dashboard. Cross-location reporting is built in: you can pull up a consolidated view of parts across all warehouses and sites. This addresses a common problem when different teams keep separate records. With one platform, you eliminate data silos and ensure departmental alignment. For instance, procurement won’t over-purchase when the excess is sitting in a different yard, because everyone’s looking at one unified map of all stock.
- Custom Location Hierarchy and Labels: The system encourages a consistent location structure. You define your hierarchy (site, building, floor, area, aisle, rack, bin, etc.) once, and every location you add follows that model. CyberStockroom’s map model effectively enforces discipline: you cannot have two different names for the same spot. This means search and reporting queries work the same way for everyone. Each mapped location has a clear identity, which eliminates the “tribal knowledge” problem. When a report says “Widget #123 at Main Warehouse / Area B / Bin 5,” all users know exactly where that is. This feature ties back to lean principles – it standardises storage points so that parts always “live” in the expected place.
- Flexible Data Fields and Bulk Operations: The platform allows custom fields on product records (for categories, criticality, vendor, etc.), which supports better grouping and searching in reports. At the same time, it simplifies large-scale updates. If you have legacy data or a major layout change, you can import spreadsheets or move dozens of items at once through batch processes. This means implementation or reorganisation work doesn’t have to happen one item at a time. From a reporting standpoint, that ease of setup ensures your inventory data gets into the system quickly and cleanly, so your reports can start providing value sooner.
Together, these capabilities mean teams can put the above best practices into effect in context. Creating a digital map, enforcing codes, scanning at receipt/issue, counting inventory, and automating reports – all within one system – greatly boosts accuracy and efficiency. With CyberStockroom (or similar map-based tools), the practice of inventory reporting becomes part of daily work rather than a separate chore. Data flows naturally from every transaction into the reports, keeping everyone aligned and responsive.

Implementing Inventory Reporting
While a powerful system helps, the human element remains important. To fully leverage these practices, operations should also focus on:
- Training and Standard Operating Procedures: Ensure every team member knows how to use the system and follow processes consistently. This includes how and when to scan parts, interpret location names, and review reports. Clear standard procedures (e.g. “always scan parts into the system before storing them”) reduce errors.
- Regular Review Cadence: Incorporate inventory reports into management routines. For example, a weekly production meeting might include a quick review of stock levels for upcoming orders. A safety meeting might review critical spare availability. By making reporting a regular agenda item, you reinforce its importance.
- Continuous Improvement Loop: Use the insights from reports to improve. If cycle counts show a recurrent error with a certain part, adjust the process (better labeling, re-training, changing storage, etc.). If a forecast misses target, refine your assumptions. Every reporting session should end with action items.
With these steps, reporting evolves from a box-checking task into a strategic tool. Teams learn to rely on the data to plan maintenance, order parts, and solve problems before they escalate. The goal is for inventory reporting not to be an afterthought, but an integrated part of daily operations.
Conclusion

In industrial environments – where downtime is costly and operations span multiple departments and sites – inventory reporting and tracking are mission-critical. By tracking inventory levels, movements, and usage with precision and on a consistent schedule, teams gain full visibility of their parts. This means fewer stockouts, fewer blind spots, and quicker response to production or maintenance needs. The combination of standard processes (labels, scans, counts) and modern tools (visual dashboards, cloud data) transforms inventory from a static spreadsheet into a dynamic operational asset.
Achieving this visibility requires aligning people, processes, and technology. When all departments work from the same data – using a unified system like CyberStockroom – they move in sync. Production, maintenance, and procurement all see the same inventory picture, which keeps lines running smoothly. Visual tools reinforce this by making stock levels and location clarity obvious at a glance. As a result, teams spend less time hunting for parts or reconciling records, and more time on productive work.
Ultimately, knowing “how many of what we have, and where it is” is the foundation of efficiency. By adopting the best practices outlined here and leveraging an integrated inventory mapping system, industrial operators can turn inventory reporting into a strategic advantage. Daily and weekly reports become clear signals rather than chores; metrics like turnover and accuracy drive smarter ordering; and cross-team alignment replaces guesswork with confidence. In a competitive landscape, this level of visibility and control translates directly into lower costs, higher uptime, and the ability to meet demand without scrambling. Inventory reporting is not just an administrative task – it’s a key pillar of operational excellence.









Leave a Reply