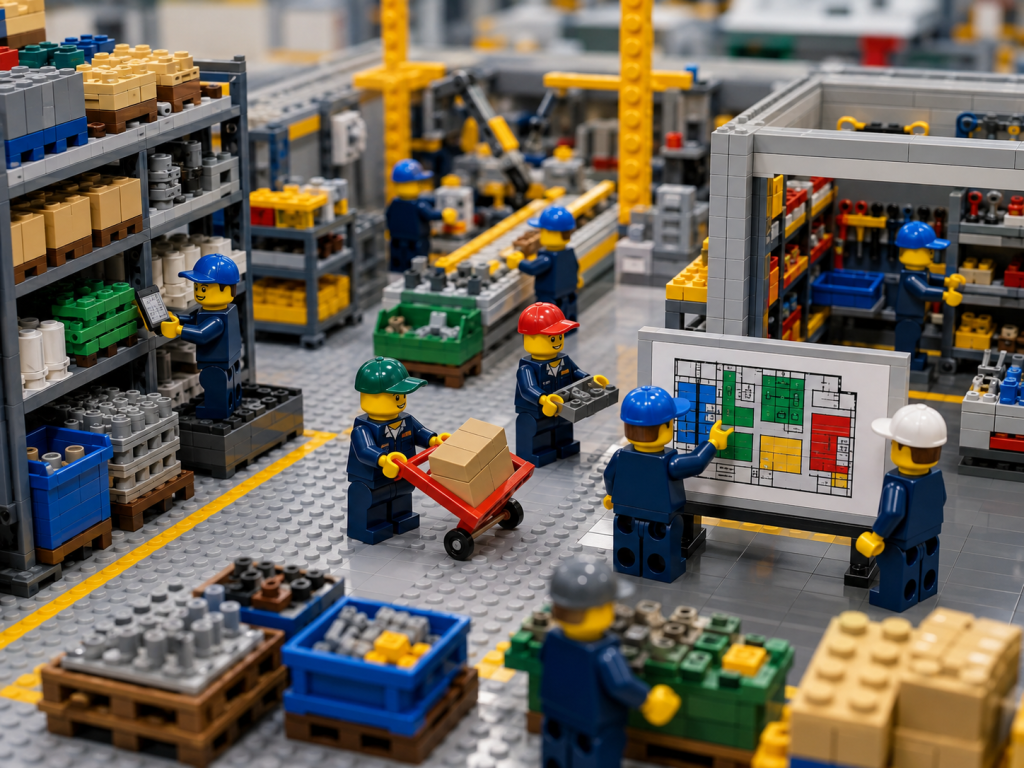
Manufacturing managers have always needed a fast way to answer a simple but expensive question: what do we have, where is it, and can the next job get it without delay? For years, the whiteboard has been the nearest, cheapest answer. It can show shortages, priorities, transfers, and urgent notes in one visible place. That is why whiteboards still survive in tool cribs, stores areas, fabrication shops, maintenance rooms, and production offices. But once inventory spans multiple departments, multiple storage zones, and multiple hand-offs, the whiteboard stops being a complete system and becomes a summary of a problem. A modern visual inventory dashboard is built for the same operational need as classic visual management: making the status of parts, work, and performance understandable at a glance by everyone involved. The difference is that a dashboard can stay current across locations, users, and transactions in a way a static board cannot.
If you are trying to replace a whiteboard with a visual inventory dashboard in manufacturing, the aim is not to abandon visual management. It is to make visual management more reliable, more shareable, and more useful for real operational decisions. A whiteboard can still be valuable for team communication, shift handovers, and immediate abnormality signals. But as soon as purchasing, receiving, production, maintenance, quality, stores, and shipping all need the same parts visibility, the inventory layer needs a stronger foundation. Leaders need a view that shows location, quantity, movement, and status clearly enough that each team can act without waiting for another department to interpret or rewrite the board.
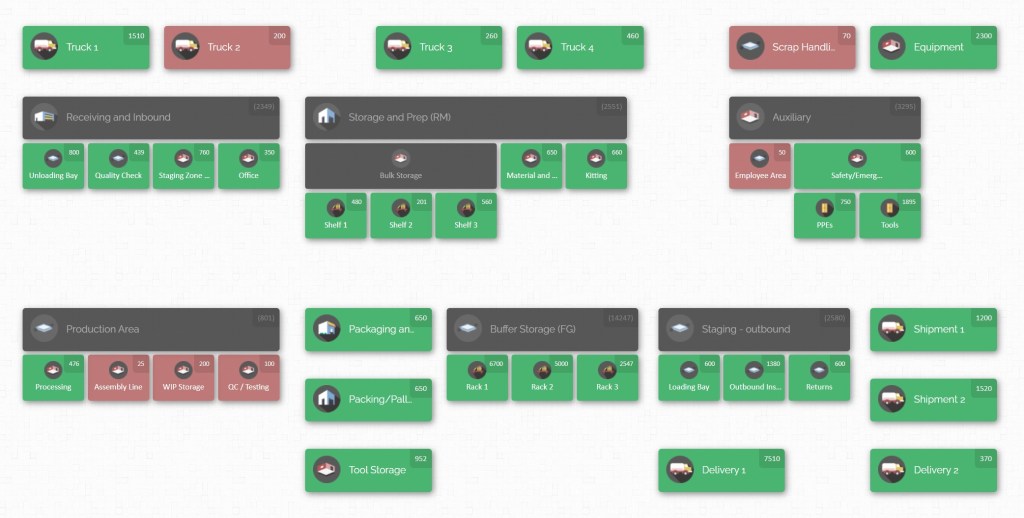
That is the real shift behind the move from board to dashboard. In lean terms, visual management works best when it makes the standard visible, highlights abnormalities quickly, and supports action. In dashboard design terms, the most effective displays are built around a clear audience, a clear purpose, and a layout that makes the most important information easy to find at a glance. A manufacturing inventory dashboard should do exactly that for every critical part, bin, shelf, room, line-side point, and stockholding area that matters to production continuity.
This guide explains how manufacturing teams can move from manual boards to a visual inventory dashboard that improves parts visibility across departments, raises inventory accuracy, strengthens cross-team alignment, and reduces the friction that comes from chasing answers through spreadsheets, calls, walk-arounds, and tribal knowledge. It also shows where a map-based system such as CyberStockroom fits naturally into that operational model, especially when the biggest pain point is not accounting complexity but the daily difficulty of seeing parts across buildings, rooms, shelves, bins, vehicles, laydown areas, and work zones.
Why Whiteboards Stop Working in Multi-Department Manufacturing

Whiteboards remain useful in manufacturing because they make information visible and easy to understand. However, as inventory moves across more departments, locations, and shifts, a local manual board can no longer provide the complete and current view that the operation needs.
Whiteboards Are Effective for Local Visibility
The whiteboard solves one immediate problem very well: it makes local information visible to the people standing in front of it. That is why handwritten and manual visual controls still have a place in lean operations. In fact, lean practice has long recognised that simple manual visuals can be effective when they are connected to a real process and a clear standard.
The problem is not that whiteboards are “old”. The problem is that inventory visibility in manufacturing is rarely local any more. Once data has to serve more than one area, more than one shift, or more than one stockholding point, a board that lives in only one place starts to create delay, duplication, and interpretation gaps.
Inventory Moves Faster Than the Board Can Be Updated
Think about the normal path of a part in a busy manufacturing environment. It may arrive at receiving, sit in quarantine, move into stores, get issued to a kitting area, travel to line-side stock, be returned to stores, be held for quality review, or be moved again for maintenance work.
None of those steps is unusual. The difficulty is that a whiteboard cannot naturally follow the part through every physical move while remaining visible to every team that depends on it. Someone has to notice a change, decide it matters, update the board, and hope the rest of the operation reads it in time.
By contrast, inventory visibility services and modern dashboard practices are designed around the need for up-to-date quantities across locations and for people who are not physically in the same place to read the same current view.
Visible Information Can Create Phantom Certainty
This is where manual systems start to generate “phantom certainty”. The board looks current because it is visible, but visibility is not the same as accuracy. Inventory accuracy is fundamentally a comparison between recorded quantity and physical reality.
When the board is updated manually, lag and discrepancy are built into the process. The more transfers, exceptions, partial picks, emergency issues, and returns you have, the more likely the board becomes a partial truth rather than an operational truth.
That is why accuracy matters so much. When recorded and actual quantities drift apart, the practical consequences show up as stockouts, overstocking, fulfilment delays, expediting, and unreliable decision-making.
Broad Quantities Do Not Show Exact Locations
A second limit of the whiteboard is that it tends to collapse location detail. Manufacturing managers do not just need to know that a part exists somewhere in the business. They need to know whether it is in the right building, room, rack, shelf, bin, staging point, or vehicle, and whether it is actually available for use.
Traditional boards rarely capture that structure cleanly because physical layout becomes cumbersome to draw and redraw. The result is a familiar pattern: someone writes broad quantities on the board, but operators still walk the floor to find the actual carton, tote, crate, or component.
Digital dashboards work better here because dashboards are made to bring related information together in one place, and location-based inventory maps add a spatial layer that makes the layout easier to understand at speed.
Separate Departmental Systems Reduce Trust
A third limit is cross-department trust. When purchasing plans replenishment from a spreadsheet, stores manages stock by memory and labels, production uses a whiteboard, and maintenance keeps a separate shortage list, every team may be “right” inside its own workflow while the plant as a whole remains misaligned.
Real inventory visibility requires more than data capture. It requires a shared view that every worker who interacts with stock can use. That point is critical. A reliable, up-to-date view of stock should not sit only with office staff or selected individuals if the goal is a seamless operation.
The practical meaning for manufacturing managers is clear: parts visibility must travel across functions, not stop at departmental boundaries.
Whiteboards Do Not Preserve Movement History
There is also a problem of historical context. A whiteboard is usually strong on the present moment and weak on movement history. It may show that a bin is now short, but not necessarily whether the shortage came from an unrecorded transfer, a line-side over-issue, a poor count, a mis-location, or a delay in replenishment.
Without movement context, teams debate symptoms instead of fixing causes. A better visual inventory dashboard preserves visual simplicity while giving managers enough traceability to investigate why stock levels changed and where responsibility sits.
That is especially important when one department’s “missing part” is another department’s “unprocessed return” or “not yet checked in” material.
More Inventory Creates More Visual Clutter
Whiteboards also struggle with scale. The more SKUs, storage points, and users you add, the more the board either becomes cluttered or shallow.
Good dashboard design guidance warns against cramming too many views into a single display because visual clarity disappears when everything competes for attention. The same principle applies on the shop floor. A whiteboard with too much information becomes wallpaper. A whiteboard with too little information becomes decorative escalation rather than decision support.
Manufacturing managers need an information structure that can reveal more detail only when needed, while preserving a clear high-level view for fast review.
The Inventory Problem Has Outgrown the Medium
None of this means the whiteboard has failed as a lean tool. It means the inventory problem has outgrown the medium.
Manual boards are still useful for local team communication, daily plan adjustments, and abnormality signals. But when your objective is full parts visibility across departments, the board should no longer be the system of record or the main search tool.
The dashboard should take over the inventory job, while the board can remain where it is strongest: fast team signalling, short-interval review, and improvement discussion.
What a Visual Inventory Dashboard Must Do Better Than a Whiteboard

A visual inventory dashboard should do more than move information from a wall to a screen. It should help manufacturing teams locate stock, verify availability, understand movement, and take action faster than they could with a manual board.
The Dashboard Must Be Built Around Decisions
A manufacturing dashboard is only worth the change if it answers operational questions faster and more accurately than the board it replaces. That starts with a simple rule: the dashboard must be designed around the decisions people are trying to make, not around every field the database can store.
Effective dashboards begin with purpose and audience. A manufacturing manager needs a different view from a stores attendant, a planner, or a maintenance lead, but they should all be looking at the same underlying stock reality. If the dashboard cannot tell each user what matters now, it is just a digital version of a cluttered wallboard.
It Must Show the Exact Location of Every Part
The first job of the dashboard is location clarity. Inventory visibility is not just about quantity. It is about quantity by location, and often by sub-location.
In manufacturing, that means the system should make it obvious which building, room, aisle, rack, shelf, bin, cage, cart, vehicle, or line-side point currently holds the part. This is precisely why map-based thinking is powerful. Instead of forcing users to translate codes into a mental layout, the dashboard can reflect the physical arrangement of the operation and let teams navigate from a broad area to an exact stock point.
CyberStockroom’s model is explicitly built around that concept, encouraging users to create a visual map of locations and sub-locations and use the map as the dashboard for viewing and managing stock.
It Must Show Whether Stock Is Actually Available
The second job is availability clarity. A part is only useful if the dashboard tells the truth about whether it can actually be used. In practice, that means separating “exists somewhere” from “available for this job now”.
Manufacturers often need to distinguish stock that is on hand, quarantined, allocated, staged, returned, or under review. Inventory visibility platforms are valuable because they can surface current quantities across locations and physical measures quickly enough to support daily business decisions.
Without that status layer, teams see stock but still cannot act with confidence.
It Must Make Inventory Movement Easy to Understand
The third job is movement clarity. Good visual management makes abnormalities visible. For inventory, one of the most important abnormalities is unexplained movement or unexplained absence.
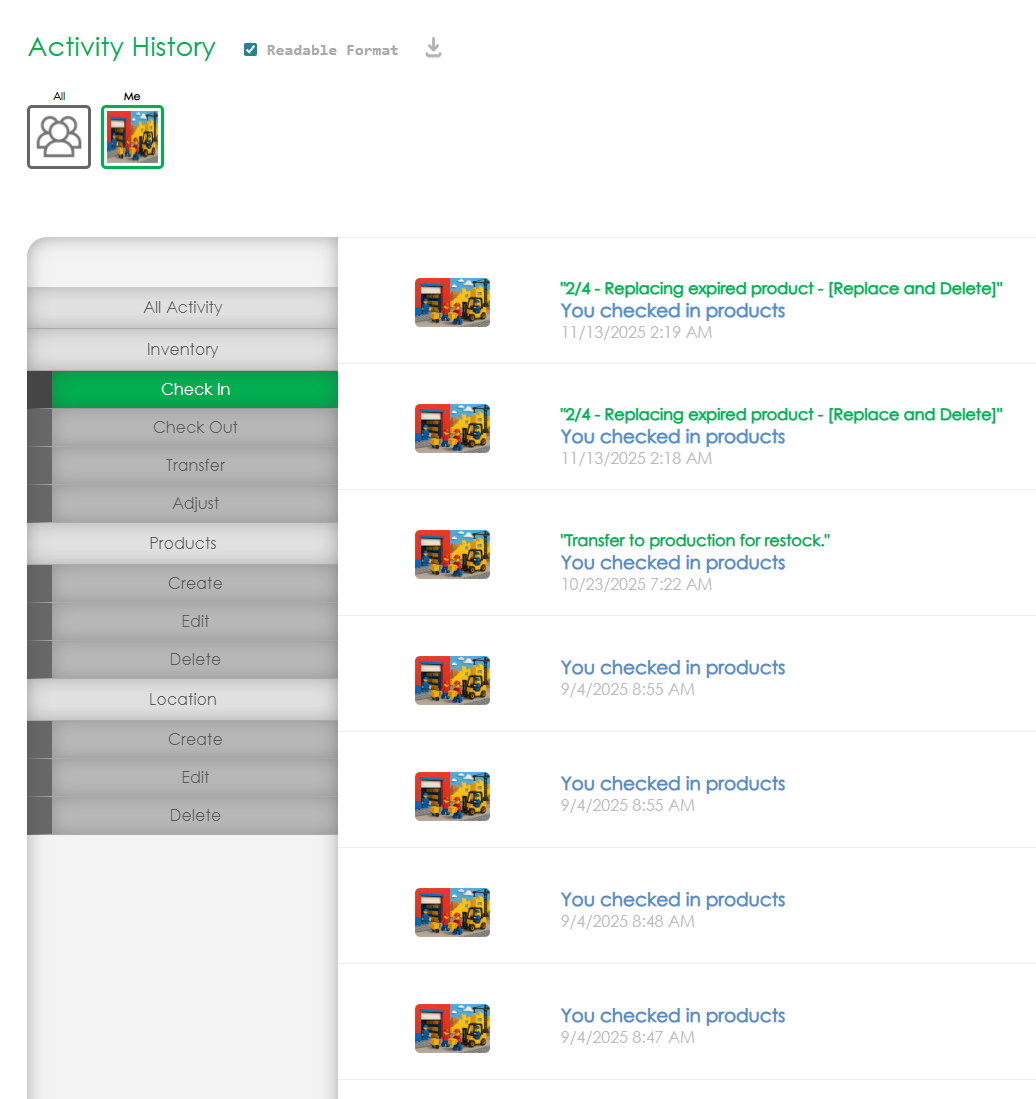
A strong dashboard should help users see not only where stock is, but where it went, where it is concentrated, and whether the distribution matches operational intent. CyberStockroom supports this kind of visibility through product distribution views, drag-and-drop transfers between locations and sub-locations, and activity-related tracking built into its map-centred workflow.
That matters because manufacturing problems often begin with the wrong stock in the wrong place rather than with a true total shortage.
It Must Help Users Take Action Quickly
The fourth job is action speed. A whiteboard remains popular because it is quick. Manufacturing managers will reject a dashboard that looks polished but slows down receiving, issue, transfer, counting, or locating work.
That is why the best dashboards favour at-a-glance reading, limited views, and clear placement of the most important information. A practical inventory dashboard should let users go from question to action in a small number of steps: find a location, verify quantity, move stock, count stock, or isolate an abnormality.
CyberStockroom’s emphasis on viewing location contents, quick transfers between locations, item lookup by barcode or selection, and cycle count adjustments shows the kind of operational bias that is necessary for adoption on the floor.
It Must Create a Shared View Across Departments
The fifth job is shared understanding. Dashboards are valuable because they bring related information together in one place and make it easier for non-technical and technical users alike to understand what is happening.
In a manufacturing environment, that cross-functional legibility is essential. Production needs to know if the build can continue. Stores needs to know where the stock sits. Purchasing needs to know whether the shortage is genuine. Maintenance needs to know what spare parts are available without calling three different areas. Quality needs to see where held or review stock sits.
If every department must reinterpret the data differently, the dashboard has not replaced the whiteboard problem. It has merely moved it to a screen.
It Must Support Better Inventory Accuracy
The sixth job is support for accuracy improvement. Inventory accuracy does not improve because a screen looks modern. It improves when the system helps people count, verify, scan, and correct stock within normal operations.
Cycle counting is especially important because it lets organisations confirm inventory levels by counting selected products regularly instead of relying only on infrequent full counts. Software-supported cycle counting improves practical control by prompting counts, handling categories or locations logically, and reducing the friction of making counts a normal daily routine.
When a dashboard supports counting as part of the workflow rather than a special event, it becomes a tool for operational discipline rather than a passive display.
It Must Stay Simple Without Losing Meaning
The seventh job is visual simplicity without hidden ambiguity. Visuals are powerful only when people can tell whether the current condition is good or bad and what action they should take next.
Lean guidance is very clear on this point: impressive-looking boards that are not actionable fail their purpose. In dashboard terms, this means keeping the most important signals obvious, limiting clutter, and making filters or drill-down paths clear enough that users know how to explore the data.
A manufacturing inventory dashboard should help people answer operational questions immediately, not admire a design.
The Goal Is a Better Operating Habit
In other words, the right dashboard does not simply “digitise the whiteboard”. It replaces the whiteboard’s weak points while preserving its operational strengths: fast understanding, clear visual cues, and easy abnormality detection.
When done well, the result is not a prettier board. It is a better operating habit.
Best Practices for Full Parts Visibility Across Departments
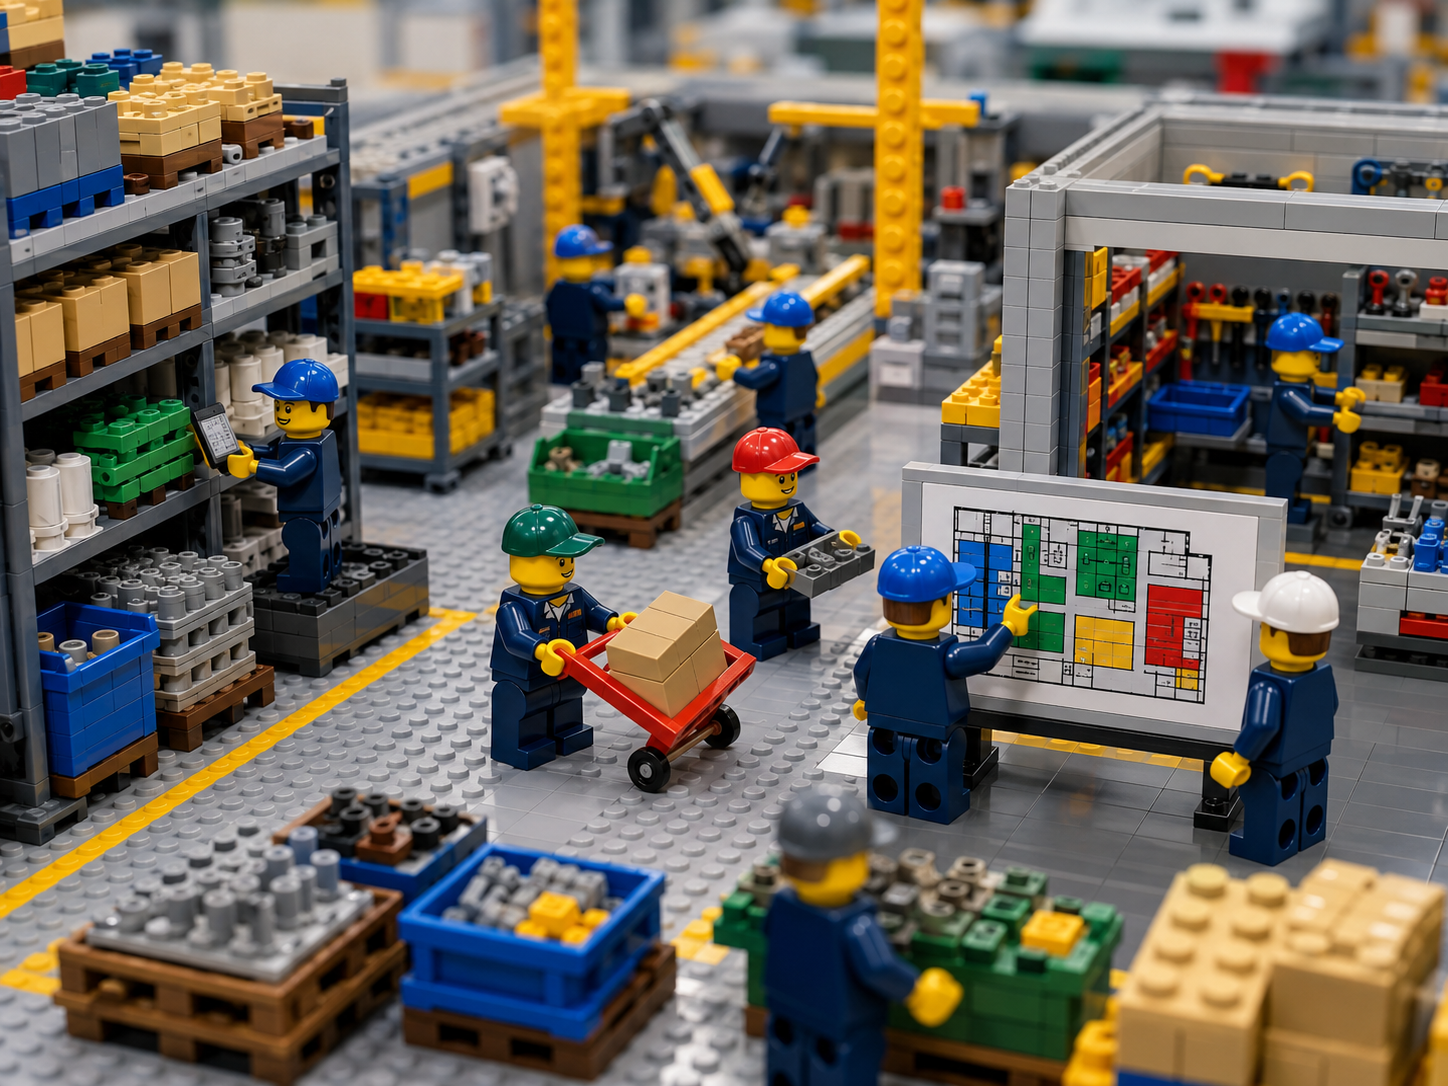
Replacing the whiteboard with a visual inventory dashboard works best when the technology supports disciplined operating practices. Clear location structures, accurate transactions, regular counting, and shared ownership are what keep the dashboard aligned with the physical floor.
Build a Location Structure That Reflects the Plant
Many inventory problems start with location structures that make sense to the system administrator but not to the people who pick, issue, count, stage, and return parts.
Manufacturing managers should define stock locations in a way that reflects the real physical world: site, building, room, aisle, rack, shelf, bin, vehicle, line-side point, maintenance crib, kitting zone, laydown area, and other relevant sub-locations.
A visual map approach makes this easier because it allows the operation to be arranged in a way that mirrors physical reality rather than a flat list of codes. When users can recognise the layout instantly, search time drops and stock discipline improves.
Create One Shared View of Location and Quantity
Every department should work from the same current stock picture, even when each team uses that information differently.
Inventory accuracy and cross-team alignment both suffer when one group works from a spreadsheet extract, another from a wallboard, another from email updates, and another from memory. A central visual inventory dashboard creates a common reference point, which is exactly what organisations need when multiple workers and functions interact with the same stock.
Connect Every Location to Clear Ownership
Visibility is not enough if nobody knows who is responsible for updating, counting, replenishing, or escalating an abnormality in a location.
Lean visual management is effective when the standard is visible and the gap from that standard is obvious. In inventory terms, each mapped area should have clear operating rules: what belongs there, what does not, how replenishment is triggered, how returns are handled, how temporary staging is labelled, and what to do when counts do not match.
A dashboard becomes far more powerful when each visual area corresponds to an accountable process.
Record Inventory Movement at the Point of Activity
The longer inventory movements remain unrecorded, the more the dashboard drifts from the floor. That is why barcoding, quick item lookup, and simple transfer actions matter.
Barcoding improves accuracy by reducing manual entry errors and accelerating common inventory tasks such as receiving, counting, and transfers. CyberStockroom supports barcodes for products and locations, barcode-driven item handling, and quick movement between locations.
This fits the practical need to update stock at the point of use or movement instead of relying on later transcription.
Use Cycle Counting to Maintain Trust
Teams stop trusting dashboards when they repeatedly discover that the screen says one thing and the shelf says another. Cycle counting is the operational habit that prevents that trust gap from widening.
Because cycle counting can happen during normal operations, it is a more sustainable control than waiting for occasional large-scale counts. It is especially effective when based on logical priorities such as high-use items, high-value items, problem locations, or areas with frequent transactions.
For production, stores, and maintenance to act confidently from the same dashboard, teams must count where risk is highest and correct discrepancies quickly.
Show Shortages in Their Physical Context
A part shortage is rarely just a number problem. It is often a process problem attached to a place: a receiving backlog, an unprocessed return cage, a line-side hoard, a quality hold area, an unlabelled cart, a staging lane, or a shelf that everyone assumes someone else is managing.
Location-based visibility helps teams ask better questions: Is the stock missing, miscounted, misplaced, unissued, or simply sitting in another mapped area?
The more precisely the dashboard ties stock to place, the faster departments can align on the cause and the next action.
Use Focused Views Without Creating New Data Silos
Dashboard design guidance advises limiting views and placing the most important information where people look first.
In manufacturing, this means creating concise review views for daily huddles, stores reviews, shortage meetings, maintenance planning, and production readiness checks, while keeping each view tied to the same live location data.
Teams should not need separate shadow boards for each meeting. They should be able to filter or focus the visual inventory dashboard on the area, department, or stock class under discussion. That is how a dashboard improves horizontal alignment instead of creating more local versions of the truth.
Use the Language People Search With
Inventory data should reflect the language used across the plant, not only the terms preferred by procurement or finance.
Custom fields and product identifiers are valuable when they support real operational search and sorting. Manufacturing teams often need to search by manufacturer, supplier, category, colour, size, line, machine family, or other practical descriptors.
CyberStockroom supports custom fields alongside location mapping, which is useful because plant teams usually want to find the right part faster, not admire a perfect item master. When the dashboard reflects real search behaviour, adoption rises.
Keep Physical Visual Controls in Place
Replacing the whiteboard does not mean removing local cues, labels, floor markings, stock rules, or abnormality signals.
The best manufacturing environments combine digital visibility with strong physical visual controls. Floor labels still matter. Bin discipline still matters. Standard locations still matter.
The dashboard should reinforce those controls by reflecting them clearly, not by asking the plant to work in an abstract database detached from the physical world.
Make Visibility Useful to Every Department
Parts visibility should be treated as a service to the entire operation, not as the sole responsibility of one department.
Stores may administer the system, but production, maintenance, quality, purchasing, and logistics all benefit only when the parts view is shared. Cross-team alignment improves when everyone can see the same location-based truth and then respond according to their role.
This is where modern inventory visibility matters most. The value is not merely that the data is digital. The value is that every worker who interacts with inventory can understand the current condition quickly enough to make better decisions.
How CyberStockroom Supports Multi-Department Parts Visibility

A lot of inventory software can record quantities. The reason CyberStockroom stands out in this discussion is that it approaches visibility as a mapping problem, not only a counting problem. That distinction matters in manufacturing because many daily delays are caused by location confusion. Teams know the part exists, but they do not know exactly where it sits, who moved it, how it is distributed, or whether the place it should be stored still matches the way the plant now operates. CyberStockroom addresses that gap by centring the inventory experience on a visual map of locations and sub-locations that can mirror the real structure of a manufacturing site.
For manufacturing managers, that means you can model the operation in a way people recognise immediately: buildings, rooms, shelves, bins, storage cages, tool areas, parts cribs, laydown spaces, vehicles, and other physical stock points. CyberStockroom specifically describes its map as a bird’s-eye view of inventory, with the ability to break a business down into any number of locations and sub-locations and rearrange the layout to match the way the business is seen in practice. That is particularly helpful when the main challenge is not a lack of SKU records but the daily effort of translating those records into a usable picture of the plant.

The platform also supports the basic operational moves that matter when replacing a whiteboard. Teams can view the contents of any location, assign barcodes, images, and custom fields to items, and add items manually, by barcode scanner, or by spreadsheet. In practical terms, that makes it easier to move away from handwritten shortage boards and towards a location-centred dashboard where the question is not “what did someone write this morning?” but “what does this location currently contain?”. For departments that spend time calling stores or walking the floor to verify stock, that is a meaningful shift.
Transfers are another strong fit for manufacturing use. CyberStockroom’s drag-and-drop inventory workflow is designed for moving items between locations and sub-locations visually, and its location map is presented as a live management interface rather than a static diagram. In a plant environment, that supports common micro-transactions such as moving parts from receiving to storage, from storage to kitting, from crib to line-side, from one zone to another, or from temporary staging back to a standard location. The faster those moves can be reflected visually, the smaller the gap between physical reality and the dashboard.
CyberStockroom also helps with one of the biggest operational pains in multi-department inventory visibility: knowing how a part is distributed across the operation. Its product distribution view, described on the site as “X-ray vision” for products, lets users scan or select a product and see its distribution. For manufacturing teams, that kind of visibility is highly practical. It helps answer questions such as whether a spare part is concentrated in one crib, spread across multiple line-side points, sitting unused in another department, or available in a less obvious area that would otherwise require a call or search. When departments can see distribution instead of relying on broad totals, cross-team coordination becomes faster and less argumentative.
Cycle counts and adjustments are part of the workflow as well. CyberStockroom states that users can quickly perform cycle counts and adjustments through the mapped inventory interface. That is important because a visual dashboard only remains credible when corrections are built into everyday work. Manufacturers replacing whiteboards need a system that can support not only finding and moving parts but also verifying counts where discrepancies appear. A dashboard that shows the layout and supports the correction step in the same working context is more likely to stay trusted.
Barcoding strengthens that further. CyberStockroom supports barcode tracking for both products and locations, accepts scanner input across interfaces, and allows quick handling of common stock transactions. In manufacturing terms, that helps reduce manual entry errors during receiving, issue, transfer, and counting while keeping the visual map current. The advantage is not abstract efficiency. It is that the dashboard becomes easier to maintain accurately across departments that may handle the same material at different points in the day.
Custom fields are another useful piece for manufacturing environments where the same part may need to be found by several different cues. CyberStockroom allows users to add custom attributes to products while still managing them in a mapped location structure. That means stores and production teams can organise stock visibility around the descriptors that matter operationally, such as supplier, category, line, style, or other practical identifiers, without losing the physical location picture. When teams can find stock through the language they actually use, adoption usually improves.

What CyberStockroom does especially well in the context of this article is preserve the spirit of visual management while improving the underlying reliability of the information. It does not ask manufacturing teams to think only in tables. It lets them manage stock visually, by location, with the ability to zoom in, see contents, move items, assess distribution, and organise the map to reflect the operation. That makes it a natural fit for organisations whose whiteboards are failing not because the team dislikes visual tools, but because the operation has become too complex for a manually maintained visual board to keep up.
How to Replace the Whiteboard Without Slowing the Plant Down

The biggest mistake in any replace whiteboard visual inventory dashboard manufacturing project is assuming that technology alone creates adoption. In practice, manufacturing teams accept a new tool when it makes today’s work easier within the first weeks. If the dashboard feels slower, more bureaucratic, or too detached from the plant’s real layout, the whiteboard will quietly return. That is why the transition should be phased around visible operational wins rather than a single “go live” event.
Start with one area where the whiteboard pain is obvious and expensive. Good pilot candidates include maintenance spares, line-side consumables, kitting stock, a congested parts crib, or a shared stores area that serves several departments. These are usually the places where location confusion, partial issues, urgent transfers, and emergency shortages create frequent interruptions. By mapping a contained but operationally important area first, you give teams a clear before-and-after comparison: fewer calls, faster locating, fewer blind searches, better count confidence, and clearer ownership of stock locations.
Build the location map from the floor, not from a conference room. Walk the area with the people who handle the parts every day and define the structure the way they actually think about it. If they say “north mezzanine shelf B” or “press line cage three” or “maintenance van two”, that language should shape the visual model. A map-based dashboard is strongest when the physical logic is obvious enough that a user can orient themselves instantly. This is one reason CyberStockroom’s customisable location and sub-location mapping is important: it allows the layout to match the business rather than forcing the business to match a rigid predefined structure.
Next, define a minimum transaction discipline that everyone can follow. Avoid trying to digitise every exception on day one. Focus first on the movements that create the most operational distortion when they go unrecorded: receiving into stock, transfers between mapped locations, issues to the line or job, returns, and cycle count corrections. If those moves are captured consistently, the dashboard will start to earn trust quickly. Barcoding can accelerate this stage because it reduces the effort of recording common actions and lowers the chance of typographical errors.
Keep the whiteboard during the early transition, but change its role. Do not ask teams to jump from a familiar board to a wholly new routine overnight. Instead, stop using the board as the primary inventory record and use it only for local communication: daily priorities, special alerts, temporary constraints, or improvement notes. Then anchor inventory verification to the dashboard. This preserves the benefits of local visual communication while shifting the authoritative parts view to the mapped system. Lean practice supports this kind of pragmatism. The medium matters less than whether the visual control makes standards and abnormalities visible and supports action.
Train by role, not by software menu. A stores user needs to know how to find a location, move stock, verify counts, and correct discrepancies. A production supervisor needs to know how to check line-side availability and identify shortages by location. A maintenance planner needs to find spares distribution across the mapped operation. A manufacturing manager needs an overview view and a confidence that departments are looking at the same truth. Dashboard best practices stress knowing the audience. That principle is just as important in rollout as it is in design.
Run daily huddles from the dashboard as soon as possible. This is one of the simplest ways to replace the whiteboard culturally rather than only technically. If shortage review, replenishment discussion, and exception management move onto the visual inventory dashboard, the organisation begins to internalise the dashboard as the shared operating picture. Because effective visual management supports frequent team-based meetings and horizontal alignment, using the dashboard in huddles turns visibility into a live management habit instead of a background record.
Measure the transition with a few practical indicators rather than a long KPI list. Ask whether teams can locate parts faster, whether cycle count discrepancies are reducing, whether departments are making fewer verification calls, whether urgent transfers are being reflected more reliably, and whether shortage discussions involve less debate about basic facts. Inventory accuracy is still the central KPI, but operational confidence matters too. When uptime, responsiveness, and trust improve, teams will stop asking whether the whiteboard should return.
Most importantly, keep the design simple. Dashboard guidance consistently warns against too many views, too much clutter, and unclear interaction. The same is true on the shop floor. Do not bury the operation in a complex screen just because the software can display more detail. Start with the visual view that answers the plant’s most urgent questions. Add depth only when teams ask for it. A dashboard wins when it feels easier than the board, not smarter than the people using it.
Closing Thoughts
The whiteboard became a fixture in manufacturing for a good reason. It made work visible. It helped teams talk about priorities, shortages, and abnormalities in a common visual language. That principle still matters. In fact, it matters more than ever. Modern manufacturing is too interdependent for inventory to remain hidden in tables, scattered across departmental spreadsheets, or trapped in the memory of a few experienced people. Parts visibility has to be visual, shared, and operationally useful.
That is why the better question is not whether to use visual management or digital management. It is how to combine them so the plant gets the strengths of both. A well-designed visual inventory dashboard gives manufacturing managers a way to preserve at-a-glance understanding while improving inventory accuracy, location clarity, and cross-team alignment. It helps every department see the same stock reality across buildings, rooms, shelves, bins, cribs, and line-side points. It turns the search for parts from a manual chase into a manageable flow of visible information.
For operations that struggle most with where parts are, not just how many exist, CyberStockroom offers a particularly practical route forward. Its map-centred approach, location and sub-location structure, product distribution visibility, drag-and-drop movement, cycle count support, barcode handling, and stock organisation tools align directly with the daily problems that cause whiteboards to break down in multi-department manufacturing environments. It does not try to replace visual thinking. It extends visual thinking into a system that can keep up with the real movement of inventory.
So if your plant is still using a whiteboard as the main way to manage inventory visibility, the next step is not simply to buy software and hope for the best. It is to redesign visibility around the physical reality of the operation, define clear location ownership, support fast transaction capture, count stock continuously, and make the current condition understandable at a glance for every department that touches parts. When that happens, the whiteboard stops being the centre of inventory control and returns to what it does best: simple local communication. The dashboard becomes the place where manufacturing managers finally get a trustworthy answer to the question that drives every shift: what do we have, where is it, and what should we do next?






Leave a Reply