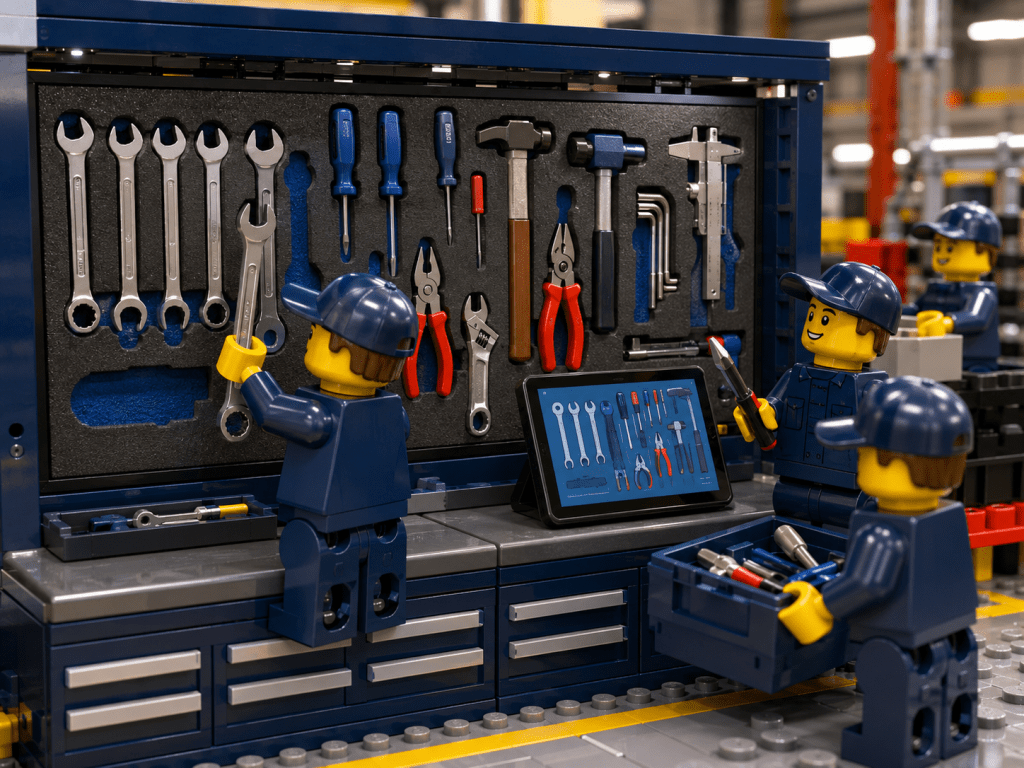
In modern manufacturing, every tool and spare part must be accounted for with discipline and precision. A missing spanner or a misplaced component can grind production to a halt, costing hours and hundreds in emergency replacements. To avoid this, forward-thinking plants assign every item a fixed “mapped home” on a visual layout of the factory floor. This means each tool, part bin, and storage zone is drawn into a digital floor plan so staff instantly know where each item belongs.
Below is an example of such a visual inventory map – a digital layout of a workshop with marked zones for storage, tool cribs and work areas. By referring to this map, everyone can see at a glance where tools are stored and used, eliminating guesswork and saving time. This approach is at the heart of strong tool accountability and full parts visibility across departments.
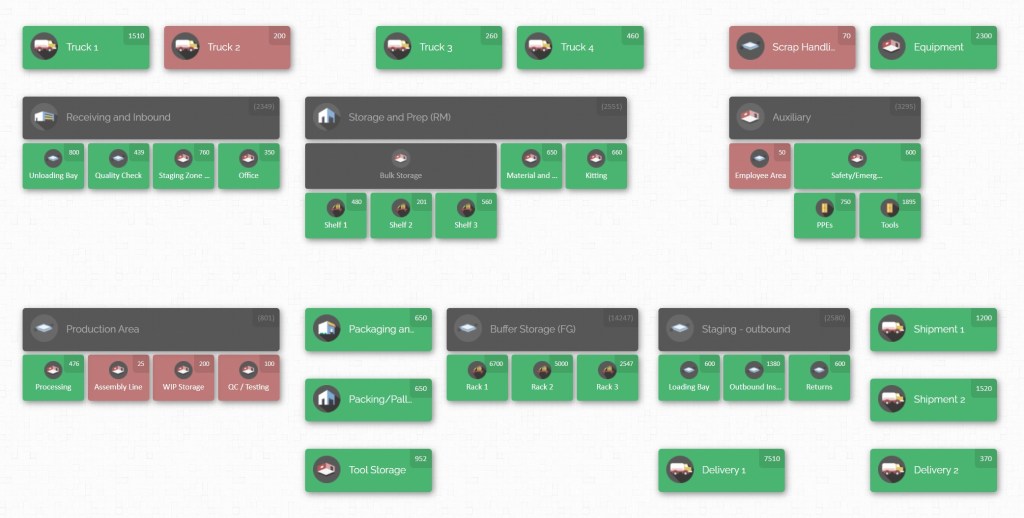
When a technician needs a specific item, they can open the map and immediately see its location. Any team member can click on a zone to reveal details about its contents. By turning inventory lists into a living picture of the shop floor, a visual map makes tool accountability and parts visibility straightforward for everyone.
Why Tool Accountability Matters on the Factory Floor
Tool accountability – knowing where every tool is, who has it, and that it is ready for use – is essential for smooth operations. Lost or untracked tools cause production delays and higher costs. For example, if a mechanic can’t find a calibrated gauge, a whole assembly line may stop until it turns up. Searching for missing items drains labour hours that could be spent on value-added work. Worse, undiscovered missing tools can pose serious safety and compliance risks. In aerospace or energy sectors, a tool left behind in equipment can lead to catastrophic failure or regulatory violations. Quality audits and ISO standards increasingly demand strict records of tool usage and calibration.
When multiple departments are involved – maintenance teams, warehouse staff, production crews, and procurement – lack of clarity about inventory breeds inefficiency. One team might order a replacement part without knowing another team already has it in stock, creating overstock and tying up capital. Conversely, a critical part may be sitting unused in a back corner because it wasn’t recorded in the system that way. These gaps in inventory visibility become “firefighting” problems: managers scrambling to respond to surprises rather than sticking to the production plan. In short, poor tool and parts accountability quietly bleeds productivity and profit. Every minute spent hunting for equipment is a minute of lost output.
Building a Visual Inventory Map for the Factory

A practical first step to solve this is to create a visual inventory map of the facility. This means digitally sketching out the entire factory layout – warehouses, production lines, tool rooms, even delivery yards – and dividing it into clearly defined zones. For example, you might draw the raw materials warehouse, a separate tool crib, individual production cells, inspection stations, and packaging areas. Within each zone, define sub-locations such as shelves, racks or bins. Each shelf or storage bin on the map is then tied to the actual stock it holds.
This mapping process gives every tool and part a precise address. Instead of asking “where did I put that wrench?”, workers consult the digital floor plan and see “Tool Crib – Bay A – Shelf 2”. By converting the physical world into a graphical layout, the inventory moves from abstract spreadsheets into intuitive pictures.
Key Steps in Creating the Map: Start by sketching each building and department. Label main areas like receiving docks, machining shops, storage aisles and quality zones. Within each, break down further into rows, shelves, bins or cabinets. Assign clear identifiers (for example “Zone 3 – Rack B”) to each location. Finally, load your inventory items into those spots – tools and parts can be bulk-uploaded into the software or added by scanning their barcodes while standing at the mapped location.
By the end of this exercise, your team has a blueprint: a bird’s-eye view showing where everything is supposed to be. This visual framework is the foundation for every subsequent accountability practice. Whenever a tool is moved, the map is updated so that the digital picture stays in sync with the real world. With everyone referencing the same map, the entire plant can talk about “Tool Crib Shelf 1” or “Aisle C-Bin 5” with certainty.
Standardizing Storage Locations and Processes
Mapping the factory floor on paper (or software) is only useful if it is backed by standard practices that everyone follows. This means giving each item and location a unique, standardized label, and enforcing rules for how items are moved in and out of those locations.
Designated Spots for Every Item: Assign a fixed “home” for each tool and part. For example, drilling machines might be on “Shelf 3 – Cabinet A” while cutting fluids go in “Bin 2 on Shelf 4”. Even small consumables (nuts, screws) should have a spot. This is similar to the 5S principle Set in Order – everything has a place. When parts come in, immediately put them in their pre-defined location.
Clear Labelling: Label each bin, rack or toolbox with its code or name that matches the map. Use durable labels or tags. Also tag items and tools with identifiers – barcodes or QR codes are ideal. For example, an air impact wrench can carry a barcode sticker. These codes should correspond to the map’s location names.
Clear Labelling: Label each bin, rack or toolbox with its code or name that matches the map. Use durable labels or tags. Also tag items and tools with identifiers – barcodes or QR codes are ideal. For example, an air impact wrench can carry a barcode sticker. These codes should correspond to the map’s location names.
Scan In and Out: Make sure every movement is recorded. When a part is taken from storage, someone should scan the item’s barcode and the destination location on the map (or select it in the system). This updates the inventory records in real time. Likewise, when a tool is returned, it’s scanned back to its home location. Enforce that every check-in and check-out goes through the system. This discipline prevents items from “vanishing” in administrative limbo.
Consistent Procedures: Document standard operating procedures (SOPs) for inventory tasks. For example: “Upon receiving a delivery, staff must scan each pallet’s contents and assign them to mapped locations before shelving.” Similarly, make it a rule that before a machine operator begins work, they verify needed tools by scanning them from the tool crib location. Training every department on these SOPs ensures that moving inventory is always a controlled process.
Visibility Across Departments: Use one unified inventory system for all departments, rather than isolated spreadsheets or siloed records. This way, procurement, production, maintenance and stores share the same data. If a machine shop takes 50 bolts from the raw materials rack, procurement immediately sees the updated count. This alignment stops duplicate ordering and lets teams plan around actual stock.
Applying these standards means nobody can put an item back in the wrong place without it showing up immediately. If someone tries to stash a tool in the wrong bin, the location scan will not match its expected home and the system will alert the user. Over time, habits form and inventory handling becomes routine. Everyone learns to “follow the map” in their work, so items are always returned to the mapped home, whether that’s a shelf, a cabinet drawer or a shadow board.
Routine Audits and Cycle Counting

Even with great processes, discrepancies can occur – tools get scratched, stickers fall off, or a rush job leads to a missed scan. To catch and correct errors, regular physical audits are vital. Cycle counting is a method where you count a subset of inventory on a frequent schedule instead of doing one massive annual count. For example, count all items in one zone each week. Use the digital map to ensure systematic coverage: go location by location, verifying each count matches the system.
Key points for auditing:
- Prioritize High-Value and Fast-Moving Items: Count the most critical tools and parts (often small fasteners or specialised tools) more often. This is an “ABC inventory” approach where “A” items get daily/weekly checks, “B” items monthly, and “C” items quarterly.
- Investigate Discrepancies: If you find a mismatch (say the map says 20 hammers in the tool room but you only count 18), pause and resolve it. Maybe someone borrowed two hammers and forgot to log them. Updating the digital count immediately prevents skew in planning.
- Audit Trails: Good inventory systems log every transaction. Review the activity history to see recent movements for that tool or bin. Often you’ll see exactly who last scanned the item out or in, which can explain the variance. Keeping this audit trail builds accountability – everyone knows the system tracks their actions.
Conducting these audits visibly enforces accountability. When staff know there are routine spot checks, they are less likely to skip scanning. Audits also keep data accurate: the “digital twin” of your inventory on the map only helps if it reflects reality. Regular cycle counting quickly exposes if processes are slipping, so you can retrain or adjust before problems grow. In effect, a mapped inventory that is audited becomes visible and reliable inventory.
Enabling Cross-Department Visibility
A key goal of mapping and accountability is to make inventory information transparent across the entire organisation. When procurement, stores, production and maintenance all use the same mapped system, it breaks down silos and aligns planning with reality.
- Unified View: If maintenance needs a replacement part, they look at the shared map and see exactly how many are on hand and where. They don’t have to ask stores or dig through spreadsheets; all data is on one platform. Similarly, production planners can see if parts are reserved for upcoming jobs or free for general use, by checking the live inventory map.
- Shared Language: By referring to locations by code (e.g. “Spare Parts Room – Shelf 3”) rather than vague terms, teams speak the same language. Any team member can say “Check Bay 5, Bin B” and everyone knows where that is. This avoids confusion when one team’s jargon differs from another’s.
- Real-Time Alerts: A common system can generate alerts to multiple departments. For example, if a critical tool level falls below a threshold, the system can flag both maintenance and stores. This prevents surprises – maintenance can reorder or replenish tools before an outage happens, and stores can check if an error caused a count drop.
- Coordinated Planning: Imagine a planning meeting where everyone can pull up the inventory map on a screen. Marketing or production sets a build schedule, and maintenance sees it directly: “We’ll need X tools and Y parts tomorrow on Floor 2.” If shortages appear, they can be addressed proactively. The map ties the supply chain’s forecasts to the actual floor, making everyone accountable to the same data.
Breaking down departmental boundaries in this way has a multiplier effect on efficiency. Instead of each group operating in isolation, the entire operation views inventory data through one lens. This shared visibility keeps teams aligned. It also speeds up communication: an operator won’t have to walk to stores and ask “Do we have four hydraulic hoses?” – they just tap the database. In short, shared visibility fosters collaboration: every department updates and benefits from the same accurate inventory picture.
Visual Management and 5S Techniques for Tools
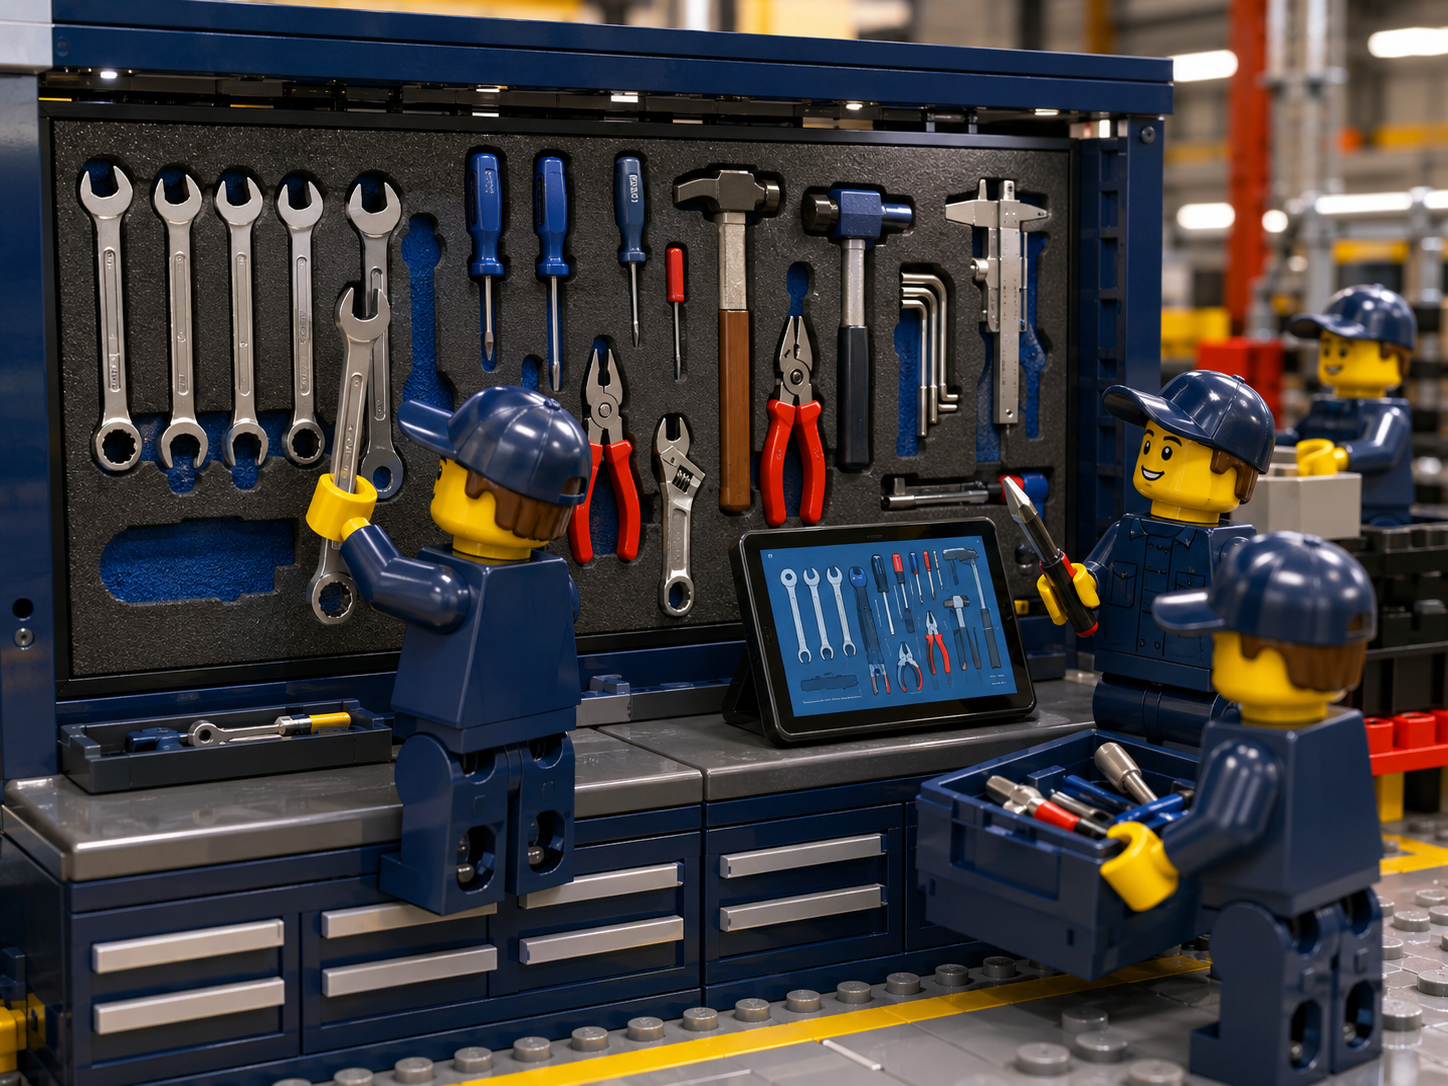
Digital maps are powerful, but on the factory floor we also rely on physical visual cues to reinforce organisation. Classic lean tools like 5S and shadow boards complement the mapped inventory system:
- 5S Organization: The second “S” (Set in Order) and the fifth “S” (Sustain) encourage marking every storage spot with colours or outlines. Painting outlines on tool shadow boards or labelling shelves with vivid signs immediately shows if something is missing. For example, a wall-mounted board might have silhouettes of each wrench or screwdriver. If a tool’s outline is empty, it pops out at the eye. This level of visual control makes audits faster and missing tools obvious even to casual observers.
- Shadow Boards: These are a form of visual map for a tool cabinet or bench. Each tool’s shape is drawn or recessed on foam so it “snaps” into its exact slot. Workers returning tools can quickly see if a slot is empty or if they’re placing a tool correctly. Shadow boards significantly reduce search time and loss. Studies have found that implementing shadow boards can boost accountability and productivity because every missing tool is flagged by design. When combined with a digital map, shadow boards ensure the physical order matches the electronic records.
- Colour-Coded Zones: Another tip is to use colour or signage on the floor or shelving to define areas. For instance, green tape might outline a pallet jack parking spot or a box storage area. Everything kept within a zone has to be related. This tidy arrangement reduces misplaced items.
- Visual Kanban: For consumable parts like screws or gloves, Kanban bins or Andon lights can be placed in the mapped location. When a bin is empty or a light is triggered, it connects to the inventory system as well. Though we avoid discussing complex IoT here, simple sensors like bin-level flags can be integrated. This ensures real-time visibility of re-order points in a very visual way.
By combining these visual management tactics with the digital map, the factory becomes “transparent.” In a well-implemented system, any team member glancing at a workstation can see both physically and on-screen that inventory is in control. For example, if a cabinet says “Parts – Bin C” and the digital map shows 0 units in Bin C, that screams “reorder needed.” Visual controls make the rules of the map obvious and effortless to follow, greatly improving inventory accuracy.
Digital Tracking Technologies
Accurate tool accountability is bolstered by technology that tracks items in real time. Here are common methods that fit a factory environment:
- Barcode Scanning: This is the simplest and most ubiquitous solution. Attach a durable barcode sticker to each tool or part container. Whenever an item is moved, the worker uses a handheld scanner or a computer terminal to scan the item and its new location. This instantly updates the system. Barcodes ensure that counts on the map always reflect reality and remove manual data entry errors. They’re affordable, reliable, and easy to integrate with any inventory software.
- RFID Tagging: In areas with a very high volume of items, passive RFID tags can speed up inventory. Instead of scanning one by one, an RFID reader can sweep and identify multiple tagged tools at once. For example, fitting commonly used kits or cages with RFID panels means a whole set of tagged tools can be read in seconds. This technology reduces human touch for bulk moves and ensures nothing is overlooked.
- Mobile Devices (Scanners/Tablets): Instead of IoT sensors, most facilities use mobile barcode scanners or tablets. Maintenance staff might carry a scanner that communicates with the central map-based system. When they scan a tool at a machine, the map automatically shows it now “checked out” or in use. Importantly, this does not mean a consumer smartphone app – it can simply be a rugged industrial scanner connected via local Wi-Fi. The principle is that the device is a portal to the unified inventory system from anywhere on the floor.
- Cloud-Based Syncing: Modern inventory platforms run in the cloud, which means every user’s device shows the same live data. As soon as one person scans a tool out of the tool crib, all other users see the updated count. Real-time syncing removes communication delays. If stores enters a new shipment, production immediately sees the added quantity without paper forms.
Adopting these tracking tools revolutionises accuracy. Manual counting and logbooks become obsolete. When technology automatically logs each action, inventory reconciliation is more a formality than a chore. Over time, the historical data from scans and transfers can also highlight process improvements. For example, if the system shows a particular tool moving back and forth frequently, managers might decide to stage a duplicate closer to its point of use.
Integrating Best Practices into Daily Workflows

For tool accountability to succeed, the above best practices must be woven into everyday routines. Here are ways to embed them into your workflow:
- Start at the Tool Room or Stores: Every shift, tool room staff (or whoever manages the stockroom) should open the inventory map on their screen. They verify new arrivals (using barcodes) and check them in to the location in the visual inventory map. They also use the map to plan the day’s transfers – for instance, moving parts from main warehouse to production kanban locations.
- Worker Check-Out: When a worker needs tools for a job, they do a quick check-out process. They go to the tool crib, take only what’s needed, and scan each item as they leave. The system notes the destination (e.g. “Welding Bay”). If they return early, they scan them back. This means at any moment, it’s clear which tools are “out” and where.
- Auto-Replenish Trigger: For critical spares, set up alert thresholds in the system. For example, if the map shows only 5 units of a safety fuse left (below the reorder point), the system indicates it. Stores personnel can then arrange a transfer or reorder. This avoids abrupt shortages. Such triggers depend on accurate counts and mapped locations so they alert at the right time.
- Cross-Department Tasks: Suppose the production manager spots a near-stockout on the map. They can immediately coordinate with stores to move stock rather than waiting for the shortage to affect output. In many plants this used to be done by phone calls; with a shared map they simply update the transfer in the system and all affected teams see it. This coordination is the key to cross-team alignment – everyone acts on the same information.
- Maintenance Planning: Maintenance schedulers can use the same system to ensure they have the tools/parts on hand for planned maintenance. By looking at the map days in advance, they lock in necessary tools. If an unusual tool is needed, they can add it to the system so stores fetch it before the work begins.
By folding these steps into daily routines, the factory shifts from “reactive” to “proactive” inventory management. Workers build trust in the inventory data; they see that scanning and mapping truly keeps items available where needed. Over time, it becomes second nature to use the map and the scanner for every tool movement, making full visibility an ingrained part of the factory’s operation.
CyberStockroom: A Map-Based Inventory Solution
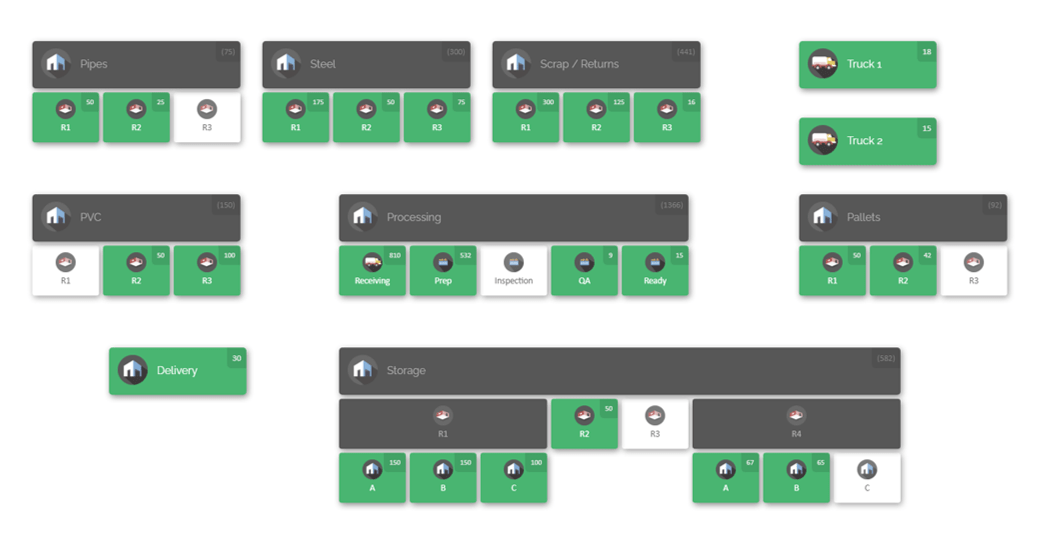
Bringing all these best practices into one cohesive system is the promise of map-based inventory software. For example, CyberStockroom provides a unified cloud platform that embodies each of the principles above. With CyberStockroom, you design a visual inventory map of your entire operation – from warehouses and stockrooms to on-site trucks or even construction sites. Each area and shelf is placed on a visual dashboard, so your digital twin mirrors reality.
With this in place, accountability becomes automatic. When a team moves inventory, they can simply drag the item on-screen from one zone to another and the system does the rest. Under the hood, CyberStockroom records the transfer, updates quantities, and logs who made the move. For example, a warehouse attendant might drag “Cabinet Keys (Qty 5)” from Storage – Section A into Maintenance – Toolbox 12, and instantly everyone sees that Toolbox 12 now has 5 keys. No paperwork, no mistakes. Alternatively, scanning can drive movements: workers scan barcodes with a scanner linked to the software, and the map updates just as reliably.

Key features support the best practices:
- Centralized Visibility: All departments access the same database in the cloud, eliminating silos. A plant manager can view stock levels across all zones on a single screen. If you run multiple sites, CyberStockroom can display each site’s map (e.g. Factory A, Factory B) in one interface. This aligns with the need for one source of truth.
- Custom Maps for Any Space: The software handles warehouses, process flows, tool rooms and more. You can build a Process Flow Map that tracks items through manufacturing stages or a Department Map that shows which crews have which parts. Each type of map is fully customisable. For instance, you might create a map of your maintenance workshop with each bench and cabinet defined. Then all technicians know exactly where to return their tools on the map.
- Drag-and-Drop Transfers: Traditional inventory systems often require entering numbers into forms. CyberStockroom’s intuitive map interface allows you to move inventory by dragging. This reduces errors: it’s impossible to accidentally “double-move” or skip a location. It also speeds up tasks – even non-technical users find it easy.
- Real-Time Sync: Because it’s cloud-based, updates happen instantly for every user. The moment a part is scanned or dragged, the live map reflects the change. If a production shift leader in Plant 2 moves bolts into an assembly cart, the Plant 1 stores manager sees the new lower bolt count at once and can react if needed. This meets the requirement that everyone always sees the same live data, enabling operational efficiency and quick response to issues.
- Activity Logs and Reporting: Every inventory action is tracked in an audit trail. You can query who moved what and when, which helps resolve any confusion. Built-in reports and alerts let you measure inventory accuracy, turnover, and spot anomalies. For example, if a tool is scanned out but never scanned back in, the system can flag that exception. This reinforces accountability – employees know the system is watching and easy to check.
- Scaling Across Teams: From small maintenance shops to large factories, the system scales. You can break down large spaces into fine-grained maps (down to individual bins) or keep things broad. You set user permissions so that each department sees what matters to them. For instance, the assembly team may only view their area’s map and get alerts about their parts, while an inventory clerk has full visibility to manage stock. This flexibility ensures each team stays aligned on the big picture and on their own responsibilities.
With a platform like this, all the practices we discussed become day-to-day reality. Every tool truly has a “mapped home” and if it leaves home, the map immediately shows where it went. Inventory accuracy shoots up because lost or misplaced items are quickly identified. Cross-team alignment improves because everyone refers to the same map instead of personal notes. In effect, CyberStockroom turns the ideal of full parts visibility into an everyday workflow.

Conclusion: Building a Culture of Accountability
Achieving full tool accountability and parts visibility is not a one-time project but a continuous improvement journey. The key is integrating these practices into the routine of every shift. Start with mapping your facilities and defining homes for each item. Then enforce standard processes and use technology to keep data live. Over time, regular audits and cross-department coordination will reinforce the new norm.
The payoff is substantial: smoother operations, fewer stockouts, and higher productivity. Technicians spend minutes searching instead of hours. Managers trust inventory data when making production plans. Procurement avoids unnecessary rush orders. Ultimately, a mapped inventory system transforms confusion into clarity.
On a factory floor running at peak efficiency, tools and parts are always exactly where the map says they should be. Processes hum because teams can move freely knowing they are always working with up-to-date information. A visual inventory map isn’t just a chart on a screen – it’s the shared blueprint that keeps everyone on the same page. By embracing these best practices and leveraging a system designed for multi-department visibility, manufacturing operations can ensure every tool truly has a home, achieving the accountability and accuracy that drive success.









Leave a Reply