
Efficient manufacturing starts with knowing exactly what materials you have and where they are. In many factories, raw material waste eats into profits: sheets of steel left unused, chemicals expiring on shelves, leftover plastic pellets collecting dust. A powerful way to cut this waste is by implementing location-based inventory tracking. This means every bin, shelf, and storage zone on the shop floor is mapped and monitored in real time. Teams can instantly see how much material is in each spot, where leftovers sit, and what’s available for production.
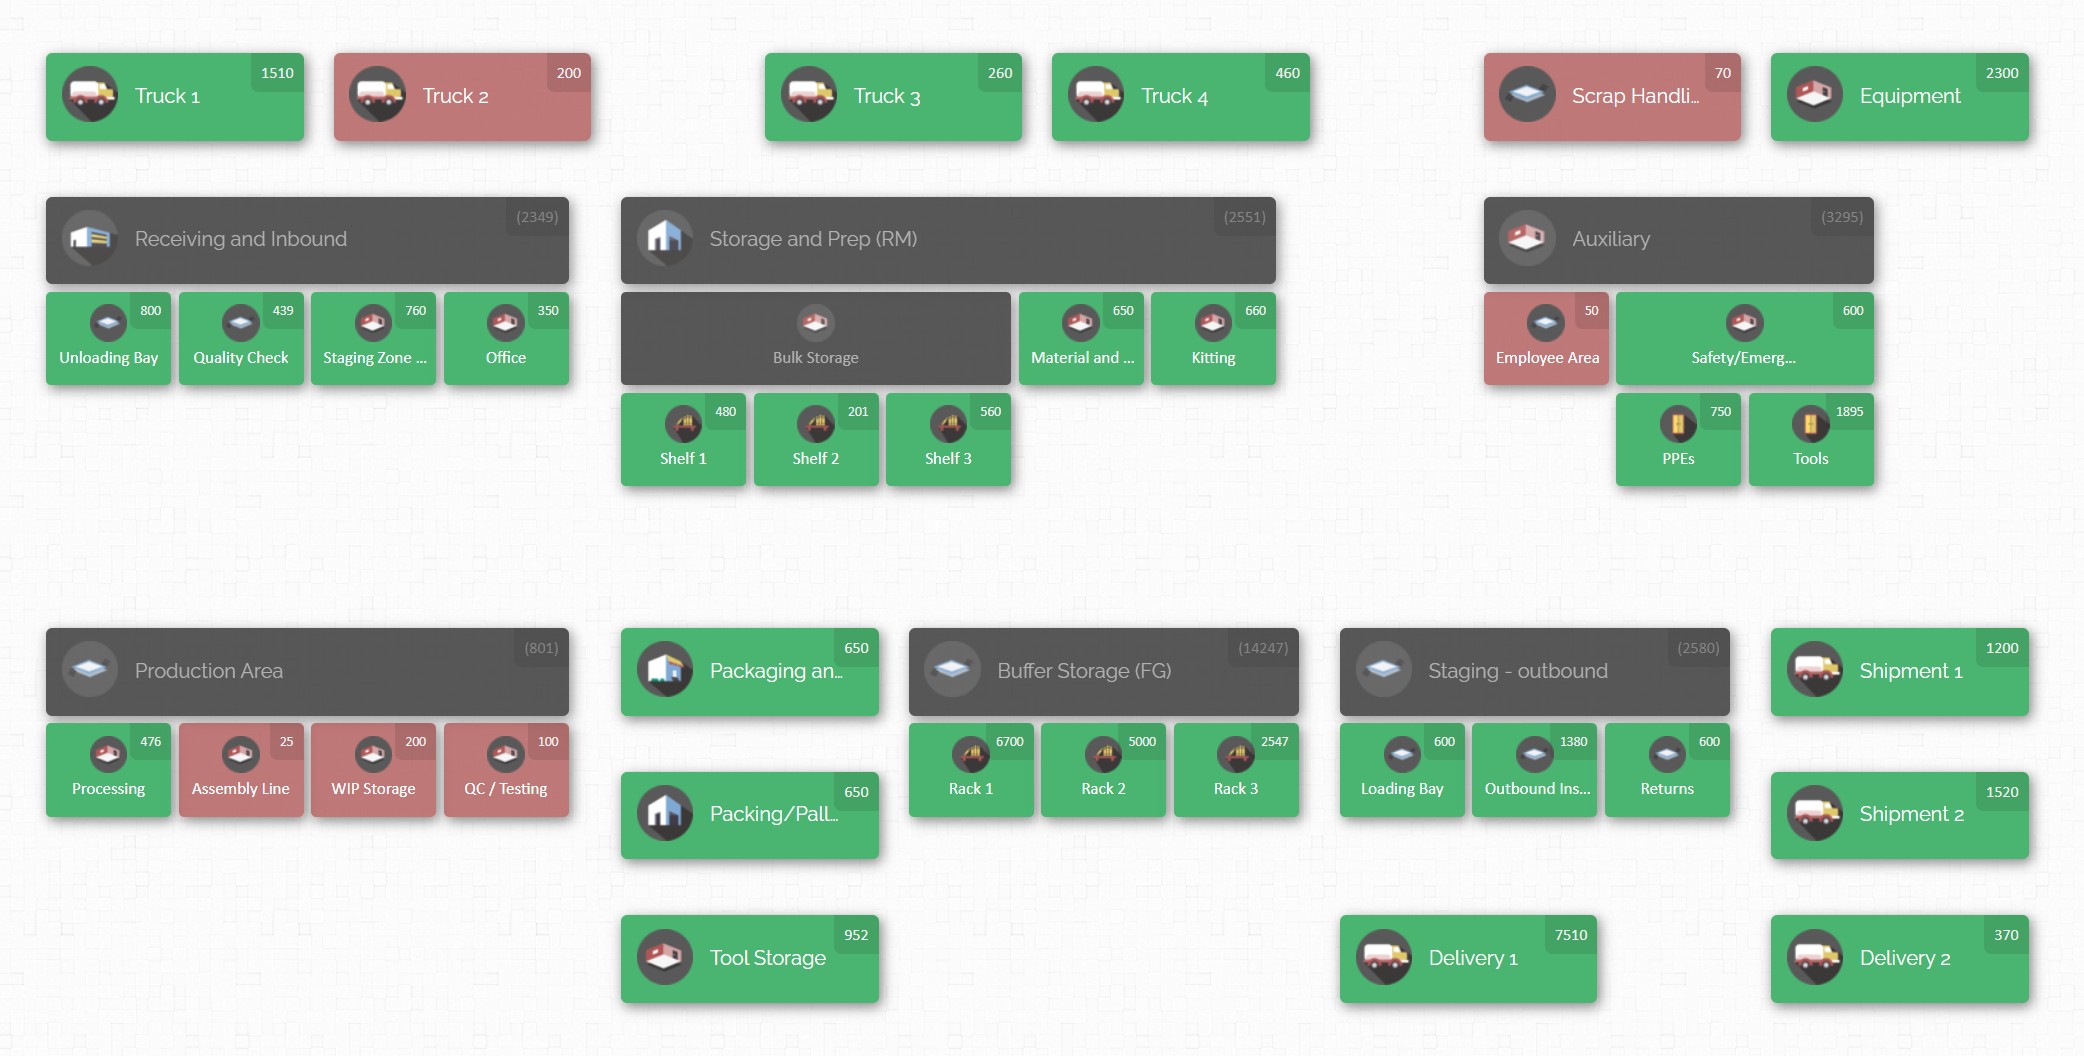
In this guide, we’ll walk through the best practices for setting up location-based inventory in your plant to improve visibility, accuracy, and cross-team alignment. You’ll learn how organized storage zones, smart tracking processes, and regular counts all contribute to reducing raw material waste. Later, we’ll introduce how an inventory mapping tool like CyberStockroom can bring these practices to life. By the end, you’ll have a complete strategy for using location tracking to minimize scrap and ensure every department knows where parts are.
Why Raw Material Waste is Costly?
Raw material waste in manufacturing isn’t just an environmental issue – it hits the bottom line hard. In many factories, 5–15% of raw materials are wasted due to poor tracking and handling. This waste can come from expired ingredients, leftover offcuts that never get used, or simply material that sits unseen until it must be discarded. Besides the obvious cost of wasted materials, there are hidden costs: extra storage space, emergency expedited orders, and the labor tied up in managing disorder.
For example, imagine an electronics plant where resistors are stored in several closets. Without clear tracking, one department might order more resistors even though another closet has plenty. When the extra resistors arrive, some may sit unused and become obsolete. At the same time, if departments think stock is lower than it is, they might order urgently, driving up costs. By using a location-based system, each resistor roll is logged in a specific bin or shelf. The moment one drawer is full and the other has spares, the system reflects it. Teams can transfer stock between locations or consume from the right spot, preventing overstocking and expiration.
Reducing raw material waste also improves efficiency. When workers never have to hunt for parts or make guess orders, they stay productive. Projects finish faster, and your manufacturing lead times shrink. Fewer surprise shortages mean less frantic restocking and fewer production stops. All of this means smoother operations and more output from the same inputs. This guide will focus on practical steps – from planning your storage layout to tracking every withdrawal – that will cut waste and give you full visibility across the plant floor.
What Is Location-Based Inventory?

At its core, location-based inventory means every item is assigned to a specific place, and that location is tracked digitally. Instead of thinking “we have 200 units of material X somewhere in the warehouse,” you’ll know exactly “we have 50 units of material X in Bin A1, and 150 units in Rack B2.” Each physical storage spot – a shelf, a bin, a pallet rack, or even a whole storage room – gets a unique identifier (like Aisle 1 – Shelf 3, or Zone C – Bin 4).
In practice, this involves creating an inventory map of your facility. You might divide your plant into zones (raw storage, work-in-progress, finished goods, maintenance storeroom) and then break each zone down into rows, racks, and bins. Each location is labeled on the map and in the system. When a shipment of raw material arrives, the receiving clerk scans or enters the item and its quantity into that specific location. Later, when production needs material, they scan it out of that same location.
This approach stands in contrast to manual or “general area” tracking. With older methods, materials were often just lumped in a corner or noted on a paper list with vague descriptions. People played hide-and-seek trying to find parts, and some stock was forgotten until it was too late. With location-based inventory, the system is always asking “what and how many are at location X?” It gives everyone a shared single source of truth.
Key benefits of location-based inventory include:
- Full Visibility: Every department sees the same, up-to-date inventory. Purchasing knows exact on-hand raw material levels. Production sees what’s in the storeroom and on the floor. Maintenance can check spares bins for fasteners or lubricants without leaving their desk.
- Accuracy and Control: Since items are logged in specific bins, it forces accountability. Workers must confirm a barcode or part ID and location when moving stock, reducing errors. If counts go off, you can immediately see which location’s count is wrong.
- Faster Access: With a map, finding parts is quick. A technician can open the system, click “where is part Y?” and see it’s in Aisle 2, Rack C. This cuts wasted time running around.
- Waste Reduction: Knowing exactly what’s on hand stops duplicate orders. You avoid throwing away expired or obsolete materials that got lost in the shuffle. Leftover scraps (remnants) can be put back into the system as new items in “Remnant” locations and reused instead of tossed.
- Space Optimization: When you map everything, you’ll spot empty areas or overcrowded zones. You can reorganize to make better use of space and improve flow, which further cuts damage and waste.
Overall, location-based inventory replaces guesswork with data-driven control. It is the foundation for reducing waste because it brings clarity to the often messy world of shop-floor inventory.
Planning Your Inventory Layout
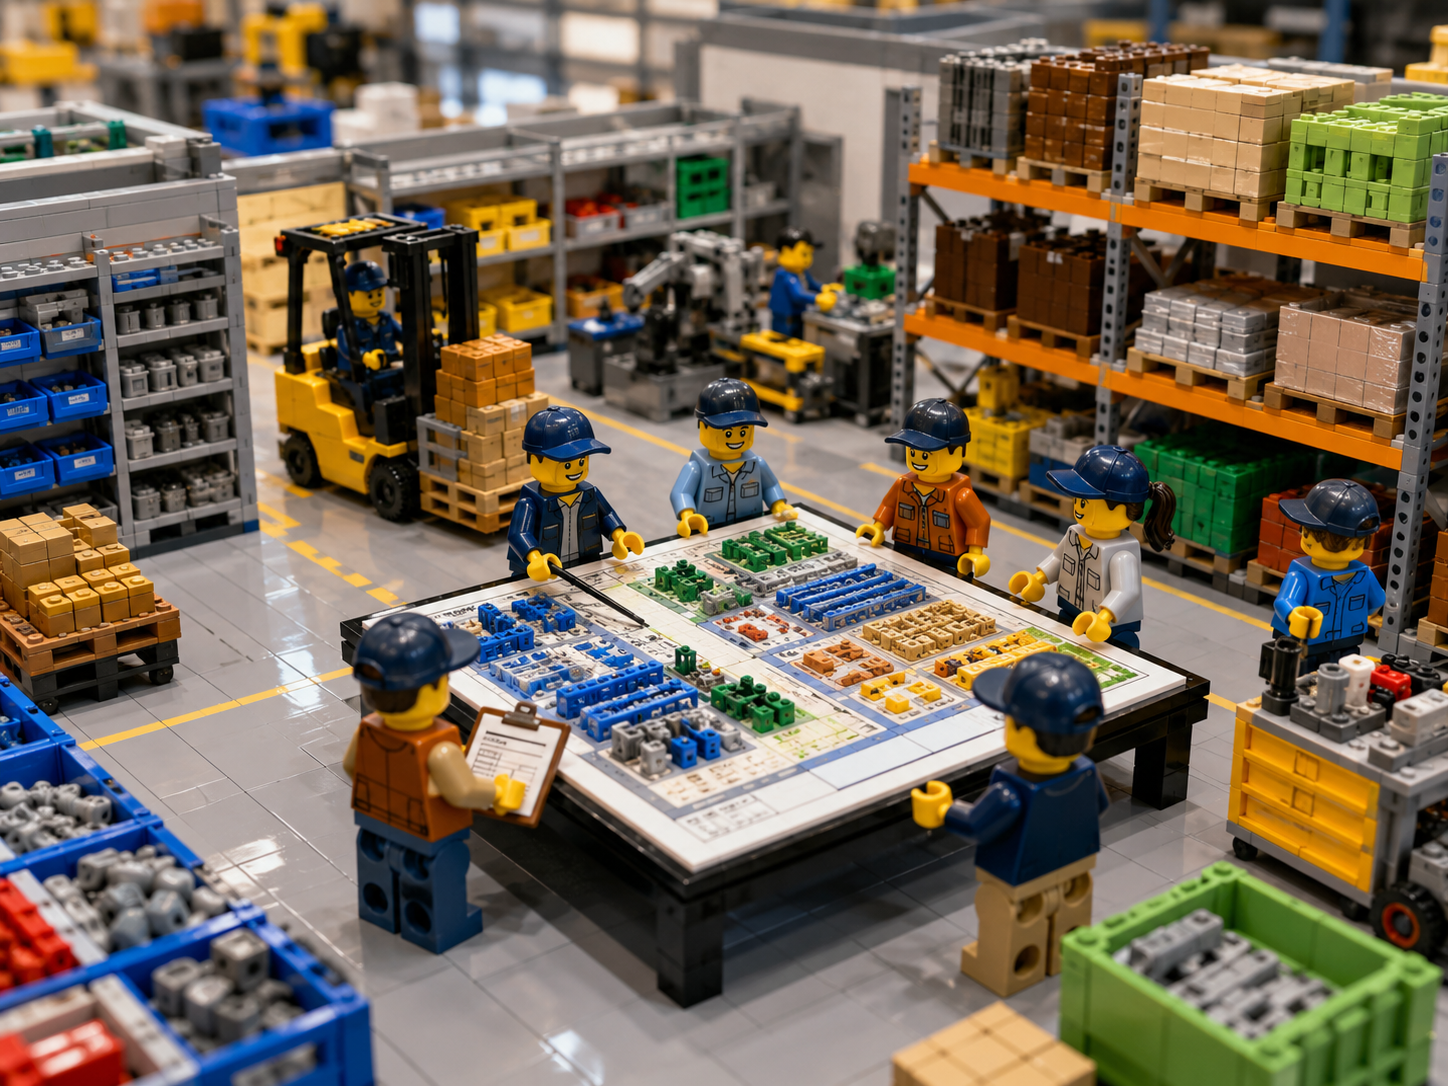
The first step is to plan and map your storage layout. Don’t just wait for materials to arrive and heap them wherever. Instead, sketch out zones and label them logically. Here’s how to get started:
- Identify key zones: Begin by dividing your facility into functional zones. Common zones include Receiving, Raw Material Storage, Production Work Areas, Quality Inspection, Finished Goods, Maintenance Storeroom, and so on. Each of these can become a section on your inventory map.
- Define sub-locations: Within each zone, break the space into aisles, racks, shelves, bins, or floor stacks. For example, Raw Material Storage might have three rack aisles, each with five shelves (Shelf 1, Shelf 2, etc.), and within a shelf you might have bins A, B, C. The more granular you go, the easier it is to find small items.
- Label everything: Give each location a clear identifier (e.g. Zone-Section-Aisle-Shelf-Bin). It can be alphanumeric (like A1, B3) or a code system you choose. Attach visible labels or placards on each physical shelf or rack. This labeling must match what’s in the software map.
- Plan material flow: Arrange zones so that materials flow forward. Incoming raw materials should enter at a receiving area, move into raw storage, then to production, and finally to shipping or finished goods. Keep this flow one-way if possible. For example, place incoming storage near the receiving dock and finished goods near shipping. Avoid dead-ends where forklifts must backtrack.
- Allow room for growth: Don’t pack every square foot from day one. Leave buffer space for extra deliveries. If a zone gets too full, you’ll have to waste time shifting pallets just to park a new truckload. Better to have 80% filled and some contingency space.
- Account for special needs: Some materials require climate control, shade, or height restrictions (e.g. chemicals, paints, metals that might rust). Plan special shelves or cages for these. Place hazardous materials away from through-traffic but accessible to whoever needs them, and label them clearly.
- Safety and access: Make sure aisles are wide enough for equipment (forklifts, pallet jacks) and that emergency exits are not blocked by storage. Mark fire lanes and keep sprinklers clear. Safety and waste reduction go hand-in-hand: less clutter and organized storage reduces accidents and spillage.
Example: In a metal fabrication plant, the raw steel might be grouped by thickness or grade. You could have Zone RM1: Hot-Rolled Steel, Zone RM2: Stainless Steel, each with shelves labeled by width or thickness. Production zones would similarly be broken down, e.g., Zone P1: Laser Cutting, Zone P2: Assembly, each with its own racks of parts waiting to be used.
By planning this layout before the first delivery, you prevent chaos. When parts arrive, a forklift driver knows exactly which zone and rack to drop them in. Your inventory system will recognize “this 500kg coil of sheet metal is at location RM1-A3.” The crew immediately knows where to pick from, and an accurate count is recorded from Day 1.
Labeling and Organizing Stock Locations
With zones in place, the next step is organizing and labeling inventory within those zones. Good organization is a visual cue for everyone and reinforces correct habits.
- Consistent naming conventions: Decide on a standard format for location codes and stick to it. For example, [Building-Floor-Zone-Aisle-Shelf-Bin] or [WarehouseSection-Row-Rack-Bin]. Use clear terms, not internal shorthand that only one person knows. This consistency helps when people move between departments or plants.
- Use visible labels or signs: At each shelf or rack, attach a sign showing the location code. For example, “RM1-A3” might be a green sign with white text. You can even include a quick description (e.g. “Stainless Steel Sheet 3mm”). This way, someone new on the floor can find location RM1-A3 by looking at the labels, instead of guessing.
- Group by category: Store similar materials together. All of one type of raw material (e.g. 3mm stainless sheets) should be in one area or a contiguous set of locations. This makes counts and movement simpler. If multiple types must share a zone, try to keep each type on specific shelves or bins.
- Organize by usage: Sometimes it helps to sort inventory by how soon it will be used. One strategy is “first in, first out” (FIFO): place newest stock behind or below older stock, so older stock is used first. Physical layout can support this (e.g. loading docks on one side, picking racks on the other).
- Label the products, too: In addition to labeling locations, label your inventory items. Each raw material batch should have a part number, lot number, or barcode. When it goes into a bin, label the bin slot with the item or family of items it holds. For high-mix operations with many part numbers, use barcode or QR labels on each bin.
Proper organization makes it obvious when something is out of place. If a production worker tries to store raw material in the finished goods area, a quick glance at the labels and map tells them they’re in the wrong zone. By assigning each material to its right spot, you prevent mix-ups that lead to waste.
Best practice: Conduct a walkthrough after labeling. Pick a random part and follow the process of finding it on your system map, then locating it in the warehouse by following the labels. If something is hard to find, adjust your labels or zone definitions. This test shows any blind spots in your organization.
Implementing Real-Time Tracking

With a mapped layout and labelled bins, the critical part is keeping the system updated in real time. A map alone does nothing if nobody records inventory moves. Here are the practices to follow:
- Scan or log every transaction: Whenever material arrives, is moved, or is used, record it at that moment. This can be done with barcode scanners, mobile devices, or a fixed terminal – whichever fits your environment. For example, when a delivery of copper tubing arrives, the receiver scans the part ID and then scans the location code (or selects it on the map) to log the receipt of 100 units to that bin. Later, when production pulls 20 units, they scan the same IDs and location to decrement stock.
- Use barcodes: Tag raw material batches and storage locations with barcodes. Scanning a barcode instantly updates the record. For bulk materials (like large bags of resin or big boxes of screws), you can affix a barcode label that contains part info. The scanning makes data entry fast and error-free. Even printing simple barcodes on labels and sticking them on racks improves accuracy dramatically over writing numbers by hand.
- Enforce a single inventory system: All departments must use the same digital system or map. Do not let people keep parallel spreadsheets. If multiple tools exist, designate one as the system of record. Train everyone that this tool shows the truth. Over time, trust in the system grows, and people stop keeping hidden stock or fudging counts.
- Immediate receiving process: When new stock arrives, follow a strict receiving protocol. Count the items against the packing slip or purchase order before leaving the receiving area. Note any discrepancies, and only then mark the quantity in inventory. Early catching of errors (too many boxes, too few, or damaged pieces) prevents “mystery” differences later. Record the date of receipt so you have a timestamp.
- Check out to jobs: Link withdrawals to work orders or production jobs. For example, before starting a production run, a team should stage all needed materials and check them out of inventory. This provides an audit trail of who took what and why. It also closes the loop: your system then knows exactly how much material each job used and can calculate yield and scrap more accurately.
- Regular cycle counts: At least weekly or monthly (depending on volume), perform quick counts of selected items. Many companies use ABC classification: count fast-moving, high-value items more often (maybe weekly or biweekly), and slower-moving ones quarterly. Cycle counting catches discrepancies early so they don’t pile up. If a count shows “supposedly 100 units in A1 but only 90 are found,” investigate immediately. Frequent smaller counts are better than an annual walloping physical inventory, which is painful and often inaccurate.
- Use alerts and dashboards: Modern systems can highlight issues. Set up alert thresholds so the system tells you when an item’s quantity is out of range. For example, if raw material falls below a reorder point in any location, or if it hasn’t moved in a long time (risk of expiry or obsolescence), you get a notification. Dashboards can show live stats like inventory accuracy percentage, days of stock remaining, or pending transfers. These tools keep everyone proactive instead of reactive.
The goal is that at any moment, your inventory system should answer: “How many of Part X are available, and in which locations?” If real-time tracking is in place, that answer is always accurate. This transparency alone cuts waste: it avoids phantom stock (ghost inventory) that leads teams to over-order, and it prevents stockouts that force emergency purchases or rush shipping fees.
Controlling and Optimizing Material Flow
A well-mapped inventory system goes hand-in-hand with lean material flow practices. Here’s how to use location tracking to streamline usage and cut waste:
- Just-In-Time (JIT) Receiving: Schedule deliveries to arrive as close as possible to when they will be used. By tracking locations, you can make smaller, more frequent orders without worrying about losing track of parts. For example, if you know half a ton of stainless will be used in three days, schedule that delivery tomorrow, not two weeks early. This reduces time any material sits idle, minimizing risk of damage or obsolescence.
- Kitting and Staging: For complex assemblies, pre-stage all needed raw materials in a dedicated staging area before production starts. Use location codes on these kits. For instance, if a job requires various circuit boards and fasteners, gather them into a kit bin labeled with the job number. Then scan out all those parts from main inventory into the kit. This prevents interruptions mid-job and avoids cases where some materials are forgotten or wasted because they weren’t prepared.
- FIFO and Expiry: If any materials have a shelf life (chemicals, coatings, organic components), use location tracking to enforce FIFO (first-in, first-out). Mark arrival dates on each lot and put new stock behind or below older stock. Your system can require that the oldest lot of Part X is used first. When scanning out parts, train staff to pick from the correct physical location (e.g. the front rack). This disciplined rotation prevents throwing away expired or ineffective batches.
- Mini-batches and Lot Control: For materials like rolls, bar stock, or liquids, track lot numbers in each location. If you use 20% of a roll of cable, leave it in the bin and note the new remaining quantity. Record any scrap length as a new “remnant” entry so it can go back into inventory rather than being thrown away. Over time, use data from the system to adjust lot sizes and reorder quantities to match your actual consumption patterns.
- Demand-based Allocation: Let your inventory system inform production scheduling. If one line shows unusual demand for a part, you can reallocate stock from another area without overbuying. For example, if Line 2 production suddenly needs more brass fittings, and you see a surplus in the maintenance storeroom, you can transfer those fittings instead of ordering new ones. Multi-department visibility means everyone plays on the same team.
- Waste Tracking: Use your system to log scrap. Many ERP or inventory tools allow “scrap codes.” Whenever production cuts unusable scrap or rejects material, log it in the location where it occurred. Over time, analytics can reveal if a certain process is generating excessive waste. Location data can pinpoint where to improve: if Rack A consistently shows more scrap than average, maybe those parts are prone to damage in that area or the picking process there is flawed.
By treating raw materials not as loose inventory but as tracked stock in specific places, you gain insights to cut every kind of waste. You’ll reorder only what’s needed (avoiding overproduction) and find ways to reuse or recycle what you’ve got.
Cross-Department Collaboration and Communication

Large manufacturers often have separate departments (production, procurement, maintenance, QA, engineering, etc.) that all rely on shared materials. Location-based inventory unites these silos:
- One Single Data Source: When sales, planning, and shop floor all access the same inventory map, everyone trusts the numbers. For example, if procurement sees a spare part quantity drop on the map, they know an engineer or maintenance person must have taken it, rather than each department keeping its own private count. This shared visibility prevents duplication and frustration.
- Role-Based Access: Use your system’s permissions to let each department have its view. Production might see every raw material available. Procurement sees raw and WIP but not necessarily secret project stock. Maintenance sees spare parts and materials. Despite different views, the underlying data is common. Everyone works with the same “master map.”
- Shared Scheduling Data: Tie your inventory tracking into production schedules. When a job is planned to start, the system checks if all materials are on hand. If not, it flags the shortage well in advance. This avoids one department unknowingly scheduling work that can’t proceed. Everyone from planning to shipping sees the same inventory picture.
- Centralized Documentation: Store standard operating procedures, safety documents, or quality specs in the system (if supported). For example, near hazardous material locations, you could link the Safety Data Sheet in the location’s notes. This ensures compliance and keeps information at the point of use, further preventing waste from mishandling.
- Regular Coordination Meetings: Use the inventory data as the agenda. In cross-functional meetings, review the inventory dashboard together. Are any materials sitting too long (risking expiration)? Are any critical items trending low? Hearing stakeholders discuss live data encourages accountability and alignment.
By breaking down the “my material vs. your material” mindset, location-based inventory builds a culture of collaboration. Everyone knows that the inventory they see is the inventory everyone will use. This transparency alone eliminates many pointless mismatches and duplicate orders that cause waste.
Reducing Waste through Lean Practices
Location-based inventory dovetails perfectly with lean manufacturing principles. Here are some lean-aligned tactics that use inventory visibility to cut waste:
- Just-In-Time Production: Coordinate material arrival tightly with production schedules. Use pull-based replenishment: when a bin hits a low level on the map, that triggers procurement to refill, rather than pushing fixed shipments. This reduces overstock and scrap from sitting too long.
- Eliminate Overproduction: Only produce and order what’s needed now. If excess product is made (beyond customer demand), that is waste. Location tracking helps you trust low inventory triggers so you don’t build extra stock “just in case.”
- Continuous Improvement (Kaizen): Use the data from your system to spot problems. If a location consistently shows missing items or sticky situations, that’s a sign to improve a process or retrain staff. For example, if scraps in a cutting area consistently bypass logging and disappear, talk to operators or adjust the system to make logging scraps easier.
- Optimize Material Usage: Measure yields per batch. If a job normally requires 100kg of steel but your BOM says 90kg, investigate the 10% difference. The map’s accuracy means yields and scrap can be trusted data points. Then lean out the process (sharpen tools, adjust feeds) to reduce scrap.
- Standard Work and Training: Document the ideal way to pick, move, and return inventory. Use the map in training new hires. When everyone follows the same steps, errors drop. For instance, teach that any time you remove raw material from shelf A1, you must scan it out in the system immediately. Consistency is key to preventing waste.
- Visual Management: Use the inventory map and signs as visual cues. A zone with a red highlight for low stock or a warning icon for expiring items immediately draws attention. Teams can spot problems at a glance and react before waste happens.
Together, these lean methods and location tracking form a loop: the system provides data, teams act on it to reduce waste, and the resulting improvements are visible on the map (fewer emergency orders, steadier usage). Over time, you’ll see metrics like scrap percentage and inventory turns improve, directly reflecting less waste and more efficient flow.
Monitoring Metrics and Continual Improvement
To know if your location-based system is working, track some key metrics and review them regularly:
- Inventory Accuracy: This is the percentage of items whose counted quantity matches the system record. A good target is above 95%. Regular cycle counts feed this metric. If accuracy drops, find and fix errors (it might be a missing scan, a system entry mistake, or theft). High accuracy means confident decision-making about waste reduction.
- Days of Inventory (DOI): Calculate how many days the on-hand inventory will last at current usage. Rising DOI for raw materials may signal overstock. Falling DOI could mean production might soon starve. Adjust orders accordingly to keep inventory “just right.”
- Scrap/Reject Rate: Track scrap volume as a percentage of material received. If you see a rising scrap percentage, that’s wasted raw material. Use location data to pinpoint where scrap originates. For example, if most scrap is associated with materials from a certain rack or supplier lot, investigate those first.
- Obsolescence Rate: If certain items sit unused past a threshold (defined by shelf life or review cycle), mark them obsolete. Your system can flag items not moved for 3–6 months. Review these regularly and either return or repurpose them. Lowering obsolete stock directly cuts waste.
- Utilization of Materials: Some systems let you track yield: actual material used vs. material issued. High yields (close to 100%) mean efficient usage. Analyze any gaps.
- Transfer Frequency: Monitor how often materials move between locations or plants. Too much shifting might indicate initial placement issues. Ideally, stock should stay where it’s most used. Reducing excessive transfers saves handling time and prevents lost inventory.
By reviewing these KPIs in weekly or monthly meetings, your team can spot trends. If waste starts creeping up, you’ll catch it early. If inventory accuracy slips, you correct procedures. Continual improvement is what keeps waste down over the long run.
CyberStockroom: Enhancing Visibility with Inventory Mapping
All the best practices above require good tools to execute at scale. A modern inventory mapping platform can turn theory into day-to-day reality. CyberStockroom is one such tool that helps manufacturers achieve full parts visibility across departments. It builds a digital map of your entire facility – every warehouse, floor, rack, bin, and even vehicles or laydown yards – putting your inventory at your fingertips.
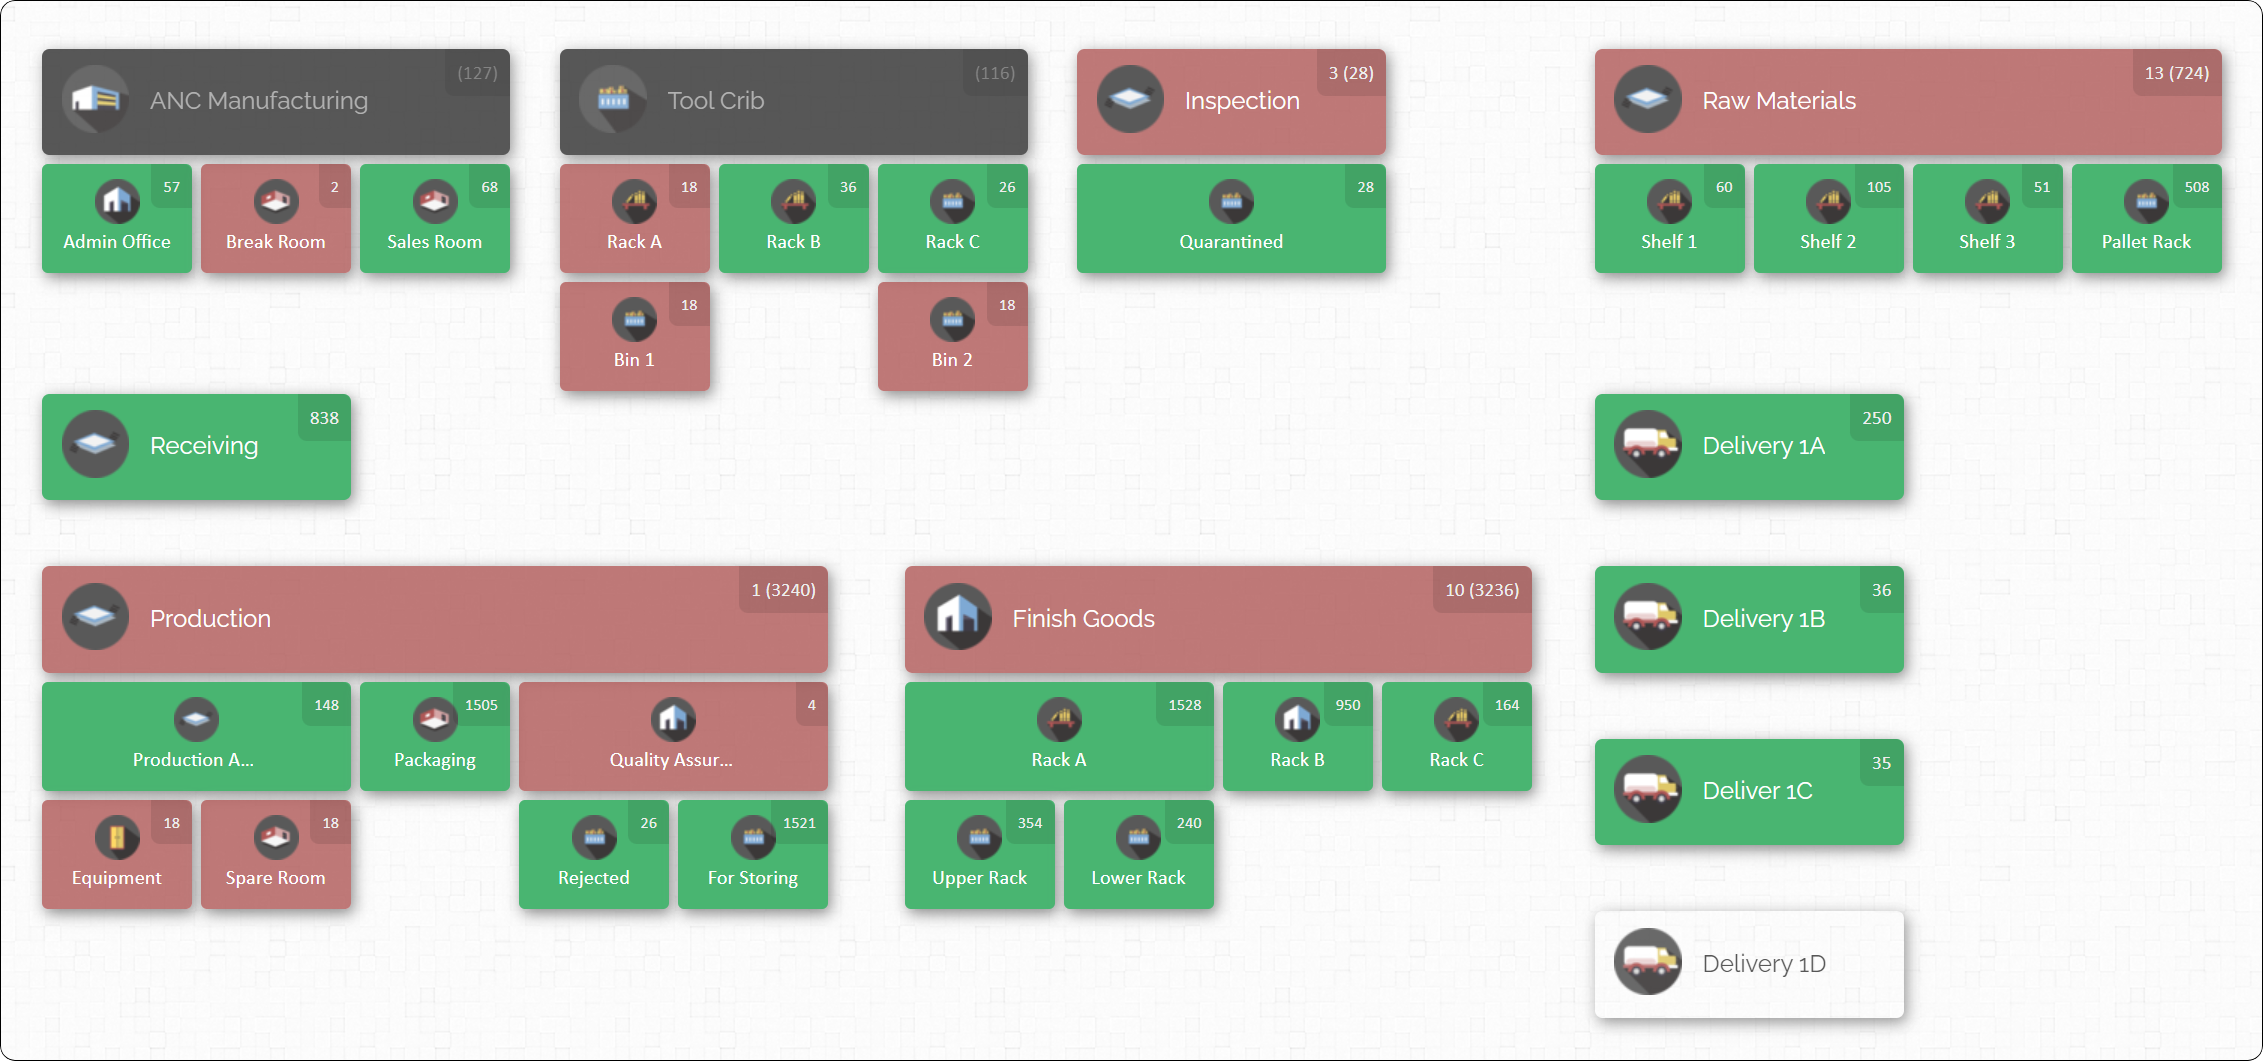
For example, you can create a live map with CyberStockroom that mirror your actual plant layout. Label each area clearly: raw material bins, production lines, inspection areas, shipping docks, etc. Once locations exist on the map, you can add products to those spots in bulk (via spreadsheet upload) or one by one. Each item gets attributes: quantity on hand, part number, lot number, and even an image or custom field.
Teams then use the interactive map daily. To move stock, a supervisor just clicks an source location on the map and drags it to a new location– the system records a transfer instantly. This visual drag-and-drop interface makes even non-technical workers feel comfortable updating inventory. For fast operations, you can also scan barcodes or QR codes: walk up with a handheld scanner or tablet, scan the part label and the shelf label, and the map updates the count in seconds.

Because CyberStockroom is cloud-based, the updated map is visible to everyone with access. Procurement in the office, floor supervisors by the machines, and maintenance staff all share the same live view. If Production used 50 units of material from Rack B2, a quick glance at the map by Purchasing shows that drop instantly. If stock at any location reaches a preset minimum, the software alerts your team to reorder or intervene before running out.
The inventory map also makes cycle counting and audits faster. Instead of scouring spreadsheets, you click on a location on the map (say, Tools Crib – Bin 1). The system lists the expected contents. You count physically, enter the result, and any difference is reconciled on the spot. This keeps counts accurate and reduces surprise discrepancies that often cause waste.
In practice, a company using CyberStockroom saw emergency procurement costs drop significantly. When everything from raw material racks to finished goods pallets is on one map, someone noticing a shortage at 5 PM can instantly see if neighboring areas have the stock or if a reorder is needed. The transparency means teams no longer hoard “just in case” stock – they trust the system to tell them what’s available at a moment’s notice.
Key CyberStockroom capabilities that support waste reduction:
- Interactive Inventory Map: Visualize every storage location; see stock levels at a glance.
- Drag-and-Drop Transfers: Easily relocate items on the digital map to match physical moves.
- Barcode Integration: Scan parts and locations to update counts and locations instantly.
- Real-Time Stock Alerts: Set reorder points or shelf-life triggers so the system prompts action before waste occurs.
- Multi-User Access: Share the single map across departments (production, quality, procurement) so everyone uses the same data.
- Reporting and Logs: Track all inventory changes, receipts, and withdrawals, helping audit trails and continuous improvement efforts.
By weaving CyberStockroom into your process, all the steps outlined earlier become simpler. For instance, when planning a new layout, you can mock it up on the map and walk it virtually. When the first batch arrives, scan it right into the mapped location. Production teams can scan materials as they go, keeping the system up to date. Over time, the map becomes a living reflection of your plant’s inventory health – and a powerful tool for reducing waste.

Training and Culture
Finally, none of these tools or processes can help unless your team buys in. Training and culture are essential to making location-based inventory work:
- Hands-On Training: Walk through the map system with every team member who handles inventory. Show them how to scan in receipts, move stock, and use the map to find items. Highlight how this will solve day-to-day problems (less hunting for parts, fewer emergency runs to the store room).
- Clear Procedures: Document standard processes for receiving, issuing, and returning materials. Make these simple checklists: e.g., “1) Verify delivery against PO; 2) Scan material into Receiving area; 3) Place material in mapped location; 4) Update map with actual qty.” Enforce following these steps.
- Accountability: Assign responsibility for each area. For example, one person might be in charge of the raw materials zone. Their duties include signing off that weekly counts were done and the map was adjusted. When errors happen (like a mismatch after a count), investigate with the person who logged it. This accountability discourages cutting corners that lead to waste.
- Continuous Feedback: Encourage teams to suggest improvements. If a location label is confusing or the map is not reflecting reality, fix it quickly. The system should serve the workers, not the other way around. Keep the conversation open so that staff feel ownership of the inventory data.
- Audits and Reviews: Periodically, do an inventory audit comparing map counts to physical counts plant-wide. Celebrate when accuracy is high. If you find errors, identify the root cause: was it a missed scan, mislabeling, or other? Use this as training rather than punishment.
Building a culture of inventory discipline goes a long way in cutting waste. As the saying goes, “What gets measured gets managed.” With location-based tracking, everyone can measure inventory performance in real time. Over time, the habits your team forms – always scanning items, always putting parts back in their designated spot – will weave waste reduction into the fabric of daily work.
Conclusion
In manufacturing, raw materials represent a large investment. Reducing waste in these materials means more profit and smoother production. Location-based inventory tracking is a proven strategy to achieve that. By mapping out your facility, labeling every bin, and keeping accurate, real-time records of inventory across all departments, you eliminate guesswork. Everyone knows what’s in stock and where to find it. Overstock and stockouts drop, expiration and obsolescence are minimized, and leftover remnants get reused instead of trashed.
This approach requires careful planning: define your storage layout, implement disciplined receiving and issuing procedures, and hold all teams accountable for updating the system. But the payoff is huge. Teams spend less time searching and double-checking, scrap rates go down, and emergency material orders become a rare exception rather than the norm.
Leveraging a visual inventory tool like CyberStockroom makes these best practices much easier to follow. With an interactive map on a shared platform, the entire plant operates from the same data. Any department can open the map, scan a part, and see the latest quantities in every location. Threshold alerts and clear workflows help enforce FIFO and timely reordering. Over time, your inventory becomes lean, accurate, and transparent to all stakeholders.
By following these steps and mindset shifts, your manufacturing operation will use raw materials more efficiently. Material costs shrink as waste is identified and eliminated. Production can run smoothly without stoppages. And your team will have a powerful system in place – an inventory map that guides decision-making – so you can sustain these improvements. In the end, location-based inventory is not just a tool, but a strategy for smarter, waste-free manufacturing.









Leave a Reply