
Managing consumables – spare parts, tools, maintenance supplies and raw materials – in a manufacturing setting can be complex. Parts move through multiple areas of a plant: raw material stores, production lines, maintenance shops and finished-goods warehouses. Without clear visibility, items get misplaced or forgotten. One department may over-order a part while another has a surplus. Production can stall waiting for a bolt or gasket that was “somewhere” in inventory. Inaccurate stock records lead to emergency rush orders, excess carrying costs and frustrated teams.
A visual, map-based inventory approach can solve these problems. By creating a digital layout of your facility and placing consumable items on it, everyone instantly sees what is in stock and where. This bird’s-eye view of inventory improves parts visibility, reduces search time, and aligns all departments on one truth. In this guide we explain how to apply proven best practices in consumables inventory management and use a visual map to tie everything together. The techniques here will boost operational efficiency and inventory accuracy across multiple manufacturing departments.
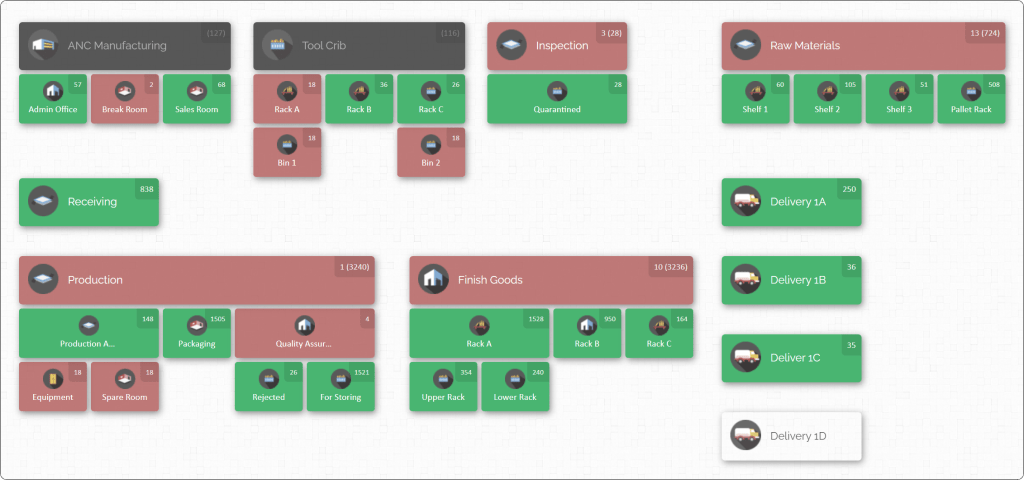
Having a visual map like the above means a maintenance technician or warehouse operator can simply look at the screen and know exactly which aisle, bin or shelf holds a needed part. The map above divides a plant into areas such as raw materials, production, assembly, maintenance and shipping, each annotated with current quantities of consumables. With this view, questions like “Where is part X?” and “Do we have enough widgets in stock?” are answered instantly. Creating such an inventory map is one of the most effective ways to manage consumables across departments, as we will explain below.
The Challenge of Consumables Inventory in Manufacturing
Manufacturing operations handle a wide variety of inventory types: raw materials, work-in-progress, finished goods, spare parts and consumables. Consumables include everything from lubricants, safety supplies and hand tools to maintenance parts and packaging materials. These items are often stored and used by different teams – production line workers, maintenance crews, quality control, purchasing and shipping. Each team may have its own stockrooms or tool cribs, leading to fragmented data.
Common challenges include:
- Lost or misplaced items: A needed component might “disappear” on the shop floor or in a storeroom because no one knows exactly where it went. Teams waste time searching or may re-order unnecessarily.
- Inaccurate counts: Manual logs or spreadsheets easily fall out of sync. One department’s records might show ten fasteners, while another’s says zero, causing confusion and mistakes.
- Stockouts and overstock: Without real-time visibility, one area can run out of a part while another has excess. This causes production delays on one side and unused capital on the other.
- Operational bottlenecks: If materials aren’t where they’re needed, machines sit idle. For example, if maintenance expects a spare part in their cupboard but it’s actually on a shelf in assembly, downtime increases.
- Higher costs: Rushed replenishments, expedited shipping and excess inventory raise expenses. Also, expiry of old stock (like chemicals or adhesives) leads to waste if not managed properly.
In short, poor consumables management can cascade into slower throughput, higher costs and missed deadlines. The solution is to boost inventory visibility – knowing precisely how much of each item you have and exactly where it is across all departments. A combination of better processes and the right tools can create a “single source of truth” for inventory. Below we outline best practices and show how a visual map brings them together.
Best Practices for Consumables Inventory Management

Implementing the following best practices will improve parts visibility and efficiency across manufacturing departments. Each practice tackles a common pain point and makes inventory data more reliable and usable:
- Centralize inventory data in one system. Use a unified inventory management platform (rather than isolated spreadsheets or disparate databases) to record all consumables. This single source of truth ensures that when one department updates stock levels, everyone else sees the same data immediately. For example, if the maintenance team checks out some lubricants, the central system adjusts the count so production and stores teams see the change. Centralisation prevents blind spots – no more cases of one shop running out while another sits on excess. It also makes tracking items across shifts and sites much easier.
- Implement real-time tracking (barcode). Equip consumable items with barcodes and use scanners to record every movement. When a delivery arrives, scanning items in eliminates manual entry errors. Similarly, scanning each time a part is picked for use or moved to a different location immediately updates the database. Real-time updates mean inventory counts in the system always match the physical stock on the shop floor. This level of tracking turns every inventory transaction into an event that all departments can see, keeping everyone on the same page.
- Standardize labels and processes. Give every item a unique identifier (SKU or part number) and attach a barcode. Label all storage locations – racks, bins, shelves, cabinets and lockers – with clear identifiers too. Establish standard operating procedures for receiving, storing, picking and using parts. For instance, a receiving process might require checking goods against purchase orders, labelling each pallet, and scanning items into the system before shelving them. Whenever an item is moved or consumed, require an immediate scan of both the item and its source/destination locations. This disciplined approach – “every item, every movement, every time” – avoids inventory “falling off the radar” and makes auditing easier. Standard labels and scans also make training new staff much simpler, as the same method applies at each department and shift.
- Perform routine cycle counts and audits. Even with the best digital system, errors can creep in. Regular counting keeps inventory data accurate. Instead of only doing rare full inventories, use cycle counting: count subsets of inventory on a rotating schedule. For example, you might audit the tool crib one week and high-use consumables the next. Prioritize frequent checks on critical or fast-moving items. After each count, compare the physical count with system records and immediately investigate any discrepancies. This catches issues early (e.g. a scan missed during a busy day) so corrections can be made. Periodically schedule a complete physical audit of all locations, perhaps before a peak production period. Accurate counts are the foundation of visibility – even the best map or report is useless if the data is wrong.
- Prioritize high-usage consumables. Identify which items are used most often – these deserve extra attention. High-turnover supplies like fasteners, safety gloves, cutting tools, abrasives, and common fasteners should have dedicated storage spots and shorter reorder cycles. Give them prominent locations on your inventory map and perhaps special visual indicators. Track their usage daily and set higher stock levels or automatic triggers. By prioritizing these key items, you reduce the risk of frequent stockouts and ensure they never become a bottleneck. Less-critical consumables (like seasonal or very specialized items) can follow normal reordering procedures.
- Use FIFO rotation for time-sensitive items. For materials with expiry dates or shelf-life concerns (e.g. lubricants, sealants, adhesives, some cleaning agents), practice first-in-first-out. Clearly label batches with dates and organize bins so that older stock is used first. The system can support this by recording lot or batch information. When combined with a visual layout, you can place older items at the front of a bin on the map interface, prompting staff to use them. This avoids waste and ensures that only fresh, usable stock is on your shop floor.
- Plan replenishments proactively. Instead of reacting to shortages, set reorder points and safety stock levels in your inventory system for each consumable. When stock falls to the reorder threshold, the system should alert the team. Coordinate between departments on these levels: for example, if production and maintenance both rely on the same part, they may agree on a joint reordering policy. A just-in-time (JIT) approach can work for stable demand items, but only if suppliers are reliable and lead times are consistent. In practice, a hybrid approach often works best: keep minimal safety stock for fast-moving parts, and lean inventory for others. Combining this planning with real-time tracking ensures that replenishments are timed correctly, without overstocking.
- Streamline purchasing and supplier collaboration. Have a clear, centralised purchasing process for consumables. This avoids duplicate orders from different departments and keeps inventory in sync. Assign responsibility for inventory oversight (such as an inventory coordinator or purchasing manager) who monitors the map and reports. Build strong relationships with key suppliers so you can quickly restock critical items. Suppliers can also help forecast demand trends (for example, if an item’s price suddenly rises, you might accelerate ordering). With a mapped inventory system, procurement can see exactly what’s on hand when creating purchase orders.
- Train and align your teams. New systems and procedures only work if people use them correctly. Provide thorough training on the inventory platform, scanners and labeling standards. Emphasise why accuracy and timeliness matter. For example, if a worker knows that an unscanned part could cause a colleague in another department to waste hours looking for it, they are more likely to comply. Periodic refresher training prevents bad habits. Encourage cross-department communication around inventory: a quick meeting or shared dashboard can keep everyone informed of upcoming needs (e.g. a big order for a customer) and ensure parts flow smoothly. Cultivating an inventory-conscious culture is as important as the technology itself – when all staff understand the “why” behind these practices, they execute them more consistently.
Following these best practices creates a strong framework. The next step is to bring the data into a unified visual map, so that all this information is easy to grasp at a glance.
Creating a Visual Inventory Map
A visual inventory map is the digital layout of your facility where every inventory location is drawn and labeled. Setting up an effective map involves a few key steps:
- Define your facility layout and locations. Sketch the major areas and departments of your plant. For example, raw materials warehouse, production lines, maintenance tool crib, assembly stations, finished goods storage, loading bay, etc. Within each area, identify the specific storage locations (bins, shelves, racks, cabinets). For instance, a warehouse might be divided into Aisles A–D with Shelves 1–10 on each, or a workshop might have Cabinets 1–5. Decide what “locations” make sense for your workflow – large zones (like a whole warehouse bay) and sub-locations (individual racks/bins) can both be part of the hierarchy.
- Create a digital floor plan or location map. Using your inventory management software, recreate this layout. Place markers or areas on the map for each defined location. For example, create a location that represent the tool crib and label it “Tool Crib 1,” and overlay bin labels inside it. This map should mirror the physical arrangement. If you operate multiple buildings or external yards, include those as well – each can be a separate map or a segmented section of one map. The goal is that a team member could look at the map and recognise each area.
- Assign consumables to map locations. Once the map is ready, populate it with your inventory data. Import or enter each item’s details – name, SKU, quantity – and specify the location on the map where it lives. Modern systems allow bulk import from spreadsheets to speed this up. You might start with critical consumables first (fasteners, wear parts, etc.) and expand to all items. For each bin or shelf on the map, the software will display the current stock level. The map then becomes a live dashboard: for example, clicking on “Storage Cabinet 7” might show “Hex Bolt M8x20 – 150 units,” “Nut M8 – 100 units,” etc. Over time, as consumption happens, the quantities update on the map.
- Label and organize bins consistently. Make sure the digital location names match labels on the physical bins. If “Rack A, Bin 3” in the warehouse corresponds to a specific map spot, workers should see that same label on the rack. This consistency links the physical world to the map.
- Set up scan-based updates. Equip staff with handheld scanners or mobile devices (they might just use the browser on a tablet) and train them to scan items as they receive, move, or use them. When a new shipment of bearings arrives, warehouse staff scan each box as they place it in “Bin 4.” When production uses some valves, the operator scans them out. Each scan prompts the map to refresh that location’s count. Over time, your map stays in sync with reality automatically.
- Maintain and refine the map. As your facility changes, update the map. If you add new storage shelving, create new locations on the map. If a department moves, redraw that section. Encourage staff to note any discrepancies (e.g. if something got misplaced, correct it on the spot) so the digital and physical always match. Periodically walk through the floor and compare it with the map data to catch any drift.
By following these steps, you turn abstract inventory numbers into an intuitive visual system. The live map acts like an interactive blueprint of your inventory. Instead of scanning rows of spreadsheets, managers and operators can click on their area of the facility on the screen and instantly see what is there. For example, the maintenance crew leader might click “Maintenance Shop,” see that “Air Filters” are down to 5 units in Shelf 2, and schedule a replenishment before they run out. Similarly, production supervisors can check the map to confirm that all required consumables are staged before a new batch begins.
A well-organized visual map enables inventory transparency and faster workflows. Materials flow more smoothly because workers always know exactly where to get what they need. Discrepancies and potential stockouts become visible – often highlighted in red or blinking alerts in the system – so you can react before they halt production. In short, mapping brings your inventory data to life.
Ensuring Cross-Department Visibility and Alignment

A major benefit of a centralized, map-based inventory system is that it bridges departmental silos. Here’s how to make sure all teams are aligned:
- Shared access and permissions. Give each department and its key users login access to the inventory system. The map is then visible to everyone (for example, production planners, maintenance supervisors, inventory clerks, purchasing staff). With roles and permissions, you can control who edits data (for example, only certain staff can perform stock adjustments), while still letting everyone view up-to-date quantities. This ensures that when one department consumes parts, every other department sees the change immediately.
- Department-specific zones on the map. In the visual layout, designate separate areas for each department’s stock, but within the same unified map. For instance, if there are multiple assembly lines, each line’s kitting area can be mapped, as well as a central tool store. This makes it clear which inventory belongs to whom, but since it’s all in one system, departments aren’t blind to each other’s stock. Maintenance can see that the CNC shop has extra coolant in their zone, production can see spares in the tool room, etc.
- Consistent data for cross-team decisions. Encourage departments to check the central system before ordering new consumables. For example, a simple rule: “Always look at the inventory map for availability in all locations before placing a purchase order.” If purchasing is planning a big order, they can verify existing quantities in each department first. This avoids duplicate stockpiling. Likewise, if one area is low on a part, others can offer help or transfer stock.
- Shared visibility for inter-departmental needs. Use the visual inventory map as a shared reference point for low-stock review and cross-team planning. For example, if “Coolant A” is stored in the main warehouse but used by maintenance, production, and facilities, each team can view its location and current stock level in the same system. This makes it easier to coordinate replenishment, transfer stock between areas, and prevent one department from making decisions without seeing how the same item affects others.
- Regular team coordination. Use the shared map as a communication tool. In weekly or daily huddles, display the dashboard and review critical items. Departments can visually highlight any issues on the map (low stock, overages, misplaced items) and coordinate solutions. Because everyone is looking at the same map, there’s no confusion about “what data” is correct.
The net effect is strong cross-team alignment. When maintenance, production and stores all rely on one live inventory map, they make decisions from the same data. This collaborative visibility means resources are allocated efficiently. For instance, if maintenance needs an urgent part and sees production has a few extra in their bins, they can arrange a quick transfer instead of ordering anew. Everyone wins: downtime is minimised and budget isn’t wasted.
Leveraging Digital Inventory Software
All the above best practices, including central data, scanning, standardized locations, structured inventory movement, and visual mapping, become much easier to manage when supported by the right inventory management tool. A cloud-based platform built around visual inventory organization can help teams move away from scattered spreadsheets, disconnected department lists, and unclear location records.
For manufacturing teams managing consumables across multiple departments, the goal is not just to store inventory data. The goal is to make that data easy to see, update, and use in daily operations. A solution like CyberStockroom supports this by giving teams a visual way to organize inventory by location, track stock across departments, and maintain a shared view of where consumables are stored and how quantities change over time.
The features to look for include:
- Interactive Visual Dashboard: The core of the system is a digital map of your facility. This map is interactive: you can pan and zoom across zones, and each area shows real-time stock levels. Clicking on any location instantly reveals details of the parts stored there. This interface turns data into an easy-to-understand layout – teams can quickly identify where each consumable lives and how much remains.
- Real-Time Location Updates: With integrated barcode scanning, the software updates inventory the moment a transaction occurs. When stock arrives at a dock door, a quick scan moves it into a receiving area on the map. When a mechanic pulls a filter from a cabinet, scanning it adjusts that cabinet’s count. Because it’s cloud-based, everyone sees these changes immediately. The map never shows stale information. This continuous update mechanism prevents discrepancies between departments: if production reduces a bulk item, maintenance sees the new balance right away.

- Flexible Layout Management: The platform should let you customise the map to match your actual layout. You can create warehouses, rooms, vehicles or jobsite areas as needed. Within each, define nested sublocations – shelves, bins, tool cabinets and even kits on a cart. This hierarchy means very precise tracking: for example, you could have “Plant 1 > Assembly Hall > Rack 5 > Bin B” all set up on the map. Whatever your structure, the tool can mirror it. If your plant expands to new buildings or mobile trailers, you simply add new locations on the map without reworking your system.
- Drag-and-Drop Inventory Movements: Transferring consumables between locations becomes intuitive. On-screen, you can drag an item from one bin to another and drop it – the software records that transfer instantly. For example, if you move a set of wrenches from the central tool crib to a satellite maintenance shop, a couple of clicks moves their stock on the map. This visual method reduces errors that happen with manual forms or hidden receipts. It also makes training easy: anyone who can drag an icon on a screen can perform an inventory move.
- Cloud Access for All Teams: Because the solution is hosted in the cloud, any authorised user can log in from a browser or mobile device in any department or location. This ensures every team member, whether on the shop floor, in procurement, or in a regional office, is looking at the same live map. It also means the system supports multiple sites seamlessly: regional warehouses and on-site stockrooms all appear on a consolidated global map view. Cross-department visibility happens naturally when there’s one system.
- Review Tools and Inventory Reporting: Consumables management improves when teams can regularly review what is on hand, where items are stored, and how stock is moving across departments. With CyberStockroom, inventory teams can maintain a centralized view of consumables by item, quantity, and location, making it easier to identify low-stock items, check usage patterns, and confirm materials are stored in the right places. Reporting also supports better planning. Teams can review usage trends for lubricants, fasteners, PPE, cleaning supplies, packaging materials, and other recurring consumables across production, maintenance, quality, and facilities. These insights help teams adjust stock levels, improve cycle count priorities, and make better replenishment decisions before shortages affect daily operations.
By choosing a software platform with these capabilities, you make it far easier to implement the best practices. The tool becomes the nerve centre of your consumables management. No more siloed data entry or guessing – instead, a clear digital twin of your operations. Teams spend less time reconciling inventory and more time on productive work.

Implementation Tips and Next Steps
To put everything into action, follow a step-by-step approach:
- Audit current inventory: Before setting up the system, clean up your data. Count what you have, fix labels and resolve obvious mismatches. This ensures you start with accurate information.
- Define responsibilities: Assign roles such as “Inventory Administrator,” “Department Stock Owner,” etc. Make clear who is responsible for updates in the software (for example, who scans incoming goods, who approves adjustments). Having accountability avoids confusion later.
- Roll out in phases: You might pilot the map in one area or for a set of critical consumables first. Once that’s working smoothly, expand to cover all departments and inventory. This limits risk and helps staff adjust gradually.
- Communicate benefits: Help each department see why the change is good for them. Maintenance will benefit from never misplacing parts; production avoids line stops; purchasing won’t have to rush orders; warehouse staff get a simpler process. When people understand the positive impact, adoption is faster.
- Monitor and refine: Use the system’s data to keep improving. If cycle count discrepancies persist in one zone, maybe retrain that team. If some items still run out, adjust reorder levels. Continually consult the reports and dashboards to measure key metrics (inventory accuracy, stockout events, inventory turnover) and tweak your processes.
With dedication and these tools, you can achieve full parts visibility across all manufacturing departments. Each time a consumable is added, moved or removed, the system records it. Teams share one clear picture of stock levels. As a result, the plant operates more smoothly: technicians find parts instantly, materials flow without interruption, and everyone is confident the numbers are right. This alignment boosts productivity and cuts costs.
Conclusion
Bringing your consumables inventory under control starts with visibility. By centralizing inventory data, enforcing real-time tracking and embracing a visual inventory map, you eliminate the uncertainty that plagues multi-department operations. When every bolt, bearing or bottle of lubricant is tracked on a shared dashboard, manufacturing teams can plan and react with confidence. The efficiency gains are dramatic – fewer production stoppages, less excess stock, and clearer team communication.
A visual map ties it all together. It answers the key question “What do we have, and where is it?” in an instant, instead of forcing staff to dig through spreadsheets or walk the warehouse. Combined with disciplined processes (labeling, counting, training) and modern cloud-based inventory tools, it ensures that each department works from the same information. In practice, this means the maintenance team never has to wonder if the part they need is “in stock somewhere” – they’ll see it on the map. The production team knows exactly when to reorder critical supplies before they run out. And procurement can optimise orders without guesswork.
Ultimately, managing consumables across departments with a visual map transforms chaotic inventories into organised, efficient systems. As you implement the steps outlined above, you will foster cross-team alignment and build a more resilient manufacturing operation. With inventory clarity in hand, your teams can focus on the work that matters – keeping the lines running and delivering quality products on time.


Leave a comment