
In modern manufacturing, accurate parts visibility is crucial. Relying on manual lists, clipboards and spreadsheets causes delays, errors and frustration. One way to modernize production line inventory tracking is to implement a visual, map-based system. Imagine a production team halting the line because a needed component “should” be in stock on a printed list – even though it’s actually sitting in another department’s storeroom. Such disconnects happen when data is siloed and out of date.
Large manufacturers are increasingly recognizing that digital inventory control is a cornerstone of efficiency. Firms that embrace this shift often outpace competitors still mired in manual processes. In a lean context, visual inventory mapping becomes as essential as any other floor control. By contrast, an interactive inventory map shows every part’s location and quantity at a glance.
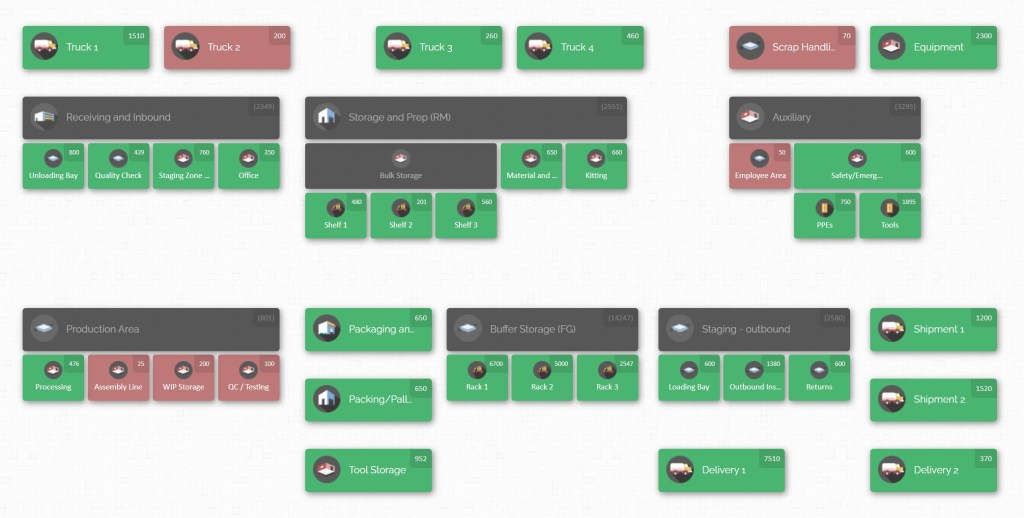
This article explores how to improve parts visibility across departments by combining best practices with modern tools. We will cover strategies that boost operational efficiency, inventory accuracy and cross-team alignment. Along the way we’ll explain how a cloud-based visual inventory solution (such as CyberStockroom) puts these ideas into action. The goal is to help production and inventory teams move beyond the clipboard era to a unified, real-time view of their parts.
The Limits of Manual Tracking
Manufacturing often begins with notepads and spreadsheets, but these methods create blind spots. When each team keeps separate records, nobody sees the full inventory picture. Consider some common problems:
- Data Silos: Departments (assembly, maintenance, shipping, etc.) maintain independent logs. A part might be used by one team without informing others, causing colleagues to double-order or falsely think stock is missing.
- Lost or Misplaced Parts: Without a tracking system, parts can “walk off” the floor. A technician might take a spare bearing and leave it at a workstation without updating the ledger. The next shift then wonders where that bearing disappeared.
- Counting Errors: Handwritten counts and batch data entry introduce mistakes. One worker’s tally may not match another’s. Over time, these errors cause stock records to drift far from reality.
- Production Delays: Ultimately, missing or miscounted parts lead to downtime. A single missing component can halt an assembly line. Every stopped minute means missed deadlines and extra cost. With manual methods, companies often react after a shortage occurs, rather than avoiding it in the first place.
- Poor Space Use: Lack of visibility often means poor organization. Valuable items might end up on the floor while empty shelves are ignored. Cluttered aisles and haphazard storage result when there’s no clear plan for parts layout.
- Inaccurate Planning: Spreadsheets may tell you “how many,” but not “where.” This means teams might order stock that already exists on-site, or miss planning gaps until it’s too late. For example, maintenance could order extra filters for machinery not realizing production has already allocated them.
- Communication Overhead: Without a shared system, staff resort to calls or messages to ask where parts are. This wastes time and still risks miscommunication.
In short, manual inventory methods waste time and money, introduce errors and disconnect departments. If one group updates stock without notifying others, everyone else is left guessing. Manufacturers need a single source of truth: a live record that all stakeholders trust. With that shared view, many of the issues above disappear.
Centralize Inventory Data for a Single Source of Truth

The foundation of parts visibility is centralization. Instead of scattered spreadsheets or departmental logs, all inventory data should live in one system. A unified, cloud-based platform ensures every department logs information into a shared database. When this is done, everyone looks at the same live data.
Cloud inventory software excels at this. Since it’s online, warehouse, shopfloor and even offsite yards connect to the same system. For example, a factory manager at the main plant and a site engineer at a remote yard can both view identical stock levels. Centralization offers these benefits:
- Real-Time Updates Everywhere: Any change – receiving, issuing or transferring parts – updates the central database instantly. All teams see the update at once, preventing situations where one side has stale information.
- Eliminate Duplication: A part is entered once, not separately by each department. This avoids conflicting records and double ordering.
- Holistic Reporting: Consolidated data makes it easy to see total inventory across all locations. Management can run reports on combined stock or drill down by site – something impossible if data is scattered.
- Simplified Audits: With one system, audits reconcile against a single set of records. This greatly reduces the headache of matching multiple lists and locating discrepancies.
Key steps to implement centralization include:
- Data Migration: Import existing records (spreadsheets, ERP exports, etc.) into the new system. This provides a comprehensive baseline without losing historic information.
- Unique Identifiers: Assign each part and each storage location a unique code or SKU. Attach barcode labels that match these codes. Consistency here avoids ambiguity when scanning.
- Cloud Deployment: Roll out the platform to all sites. Provide access via PCs, tablets or scanners so everyone can log transactions into the system from anywhere.
- Continuous Synchronization: Ensure all interfaces (receiving stations, production scanners, etc.) feed into the central database in real time.
Cloud platforms also simplify multi-site management. If you have several plants or stores, a cloud system handles them seamlessly. You could, for instance, draw a single map showing all locations, or switch between maps for each site. No separate software install is needed at each facility. In practice, a supervisor at headquarters or a mobile manager can monitor inventory globally, spotting trends and issues across the entire organization.
Once inventory is centralized, “invisible” stock disappears. For instance, if Warehouse A shows 100 valves and Warehouse B shows 50, those numbers can be summed centrally. All users then know the company has 150 total. Centralization prevents one warehouse from over-ordering because it didn’t know another warehouse had surplus. In effect, the unified system becomes the single truth. Each team – procurement, production, quality, maintenance – accesses the same data. Decisions are made with confidence and efficiency instead of guesswork.
Implement Real-Time Tracking on the Shopfloor
A central system is only useful if data is fresh. Real-time tracking captures inventory movements the instant they occur. By equipping the shopfloor with barcode, parts are logged into the system on the spot. This keeps the inventory map always up to date.
Common real-time tracking methods include:
- Barcode: Label every item and location with a code. When parts arrive, the receiver scans the item’s barcode and the destination bin’s barcode. The system immediately records those units in that bin. Likewise, when production pulls parts, the operator scans the part and the line or cart location. Each scan increments or decrements inventory instantly, leaving no lag.
- RFID Tagging: In busy or large areas, RFID tags can speed up transactions. Tag pallets or racks with RFID chips. A reader at a doorway or loading dock can automatically register all tagged items passing through. For example, as a forklift carries multiple tagged parts through a gate, an overhead reader logs the entire transfer without needing to scan each item by hand.
- Mobile Devices: Modern inventory platforms often allow smartphone or tablet scanning. A technician on the line can use a mobile device’s camera to scan barcodes and update stock counts. This mobility means scanning is always at hand, even if dedicated terminals aren’t feasible in every location.
- Automated Transactions: Some systems let you preload transactions in advance. For instance, you might enter a purchase order in the system so that a single scan “receives” all items upon arrival. Similarly, planned production picks can be staged and then confirmed with one action. This reduces the number of clicks needed for routine moves.
- Continuous Updates: The goal is to update inventory as closely to real time as possible. Instead of entering data once per shift, updates happen minute by minute or instantaneously. This effectively gives everyone a live dashboard of stock.
To set this up, ensure you have:
- Labels on Everything: Attach durable barcode labels to parts, pallets and storage bins. The on-screen codes must match the labels exactly.
- Accessible Scanning: Place scanners or tablets at receiving docks, storage aisles and critical workstations. Ensure a reliable Wi-Fi or cellular network so each scan updates the cloud instantly.
- User Training: Make scanning an ingrained step in every inventory task. Update SOPs so that every receipt, pick or transfer is immediately logged. Emphasize the “scan first, then move” rule.
- Eliminate Paper Forms: Replace checklists and paper logs wherever possible. Even if an item arrives without a barcode, have a quick digital entry process (such as a mobile form) so no part goes unrecorded.
Real-time tracking brings inventory data to life. The moment a part is consumed or a pallet is moved, the system records it. This immediacy prevents discrepancies from building up. Over time, daily scanning virtually eliminates “unseen” inventory changes. For production, it means no more guessing whether a part was used yesterday – the map shows it instantly. Supervisors can spot low-stock alerts in real time and respond before lines stall. In short, real-time updates turn inventory into a live resource rather than a delayed report.
Standardize Labels and Processes

Even the best software requires disciplined usage. The third best practice is to standardize how inventory is identified and handled across the organization. Consistency keeps the data clean and reliable.
Begin with labeling: give every bin, shelf, rack or toolbox a unique label (usually a barcode). Those labels should correspond exactly to entries on the map. For example, if you scan a label as “Aisle-3-Bin-2” on the map, the same code should appear on that bin in the warehouse. Parts themselves also need consistent identifiers. Avoid free-form text descriptions; instead, use a single part number or SKU for each item, and barcode that. Clear, unambiguous labels eliminate confusion about where things belong.
Next, fix your processes. Develop clear procedures so every transaction is handled the same way:
- Receiving: When stock arrives, inspect it against the purchase order and immediately scan it in. Assign it to a bin by scanning that bin. This ensures the system is updated before the parts hit the floor.
- Put-Away: Always scan parts from receiving into their correct storage location. If items are staged on a cart, assign them a temporary “buffer” location in the system until they’re shelved.
- Picking/Issuing: When parts are drawn for production or maintenance, scan them out of their source location. If the system uses a staging area (like a line-side shelf), scan the items into that location. This two-scan process records exactly how many left a bin and where they went.
- Transfers: Any movement between departments or buildings should be logged. Scan items out of the origin location and into the destination location. This way, your map will always show their current home.
- Cycle Counting: Schedule regular counts of inventory subsets (daily, weekly or monthly). Use the digital map to generate pick lists. As each part is counted, scan it to confirm the quantity. Correct any differences on the spot and note reasons (e.g. damage, theft).
- Adjustments: If stock adjustments are needed (for damage, returns or corrections), perform them through the system with a supervisor’s approval and a reason code. Never simply erase counts without a log.
Training is crucial to make these steps routine. Provide guides or cheat-sheets that remind users how to scan and where to report exceptions. Some companies hold short refresher sessions or post signage in warehouses. Making scanning and map-updating a habit for everyone — not just the warehouse clerks — ensures data stays accurate.
A concrete example: if a part is labeled “Widget-001”, make sure no variation like “Wg-1” or “widget 1” exists elsewhere. Create standard templates for receiving and transfer forms so fields always match the system. Over time, these consistent conventions pay off – searches and filters in the system always yield the expected results, and little time is lost clarifying naming discrepancies.
Standardization yields huge benefits. When everyone follows the same procedure, data stays coherent. New staff learn one process that applies plant-wide. Audits become straightforward because each location is scanned on a known schedule. In short, standard labels and processes turn the map into a dependable reflection of reality. Deviations stand out and can be corrected immediately, improving accuracy and trust in your inventory data.
Visualize Inventory Flow with Mapping Tools
Instead of poring over spreadsheets, imagine your inventory laid out on a map of your facility. Visual inventory mapping tools turn your warehouse, production lines, yards and other areas into an interactive diagram. Stock levels and alerts are overlaid on these zones. This approach brings immediate clarity.
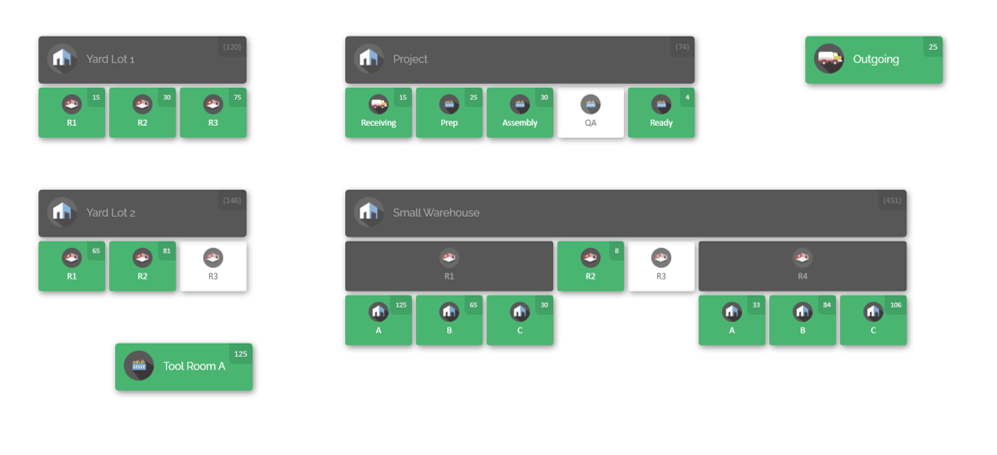
Example of a visual inventory map including outdoor yard and warehouse zones, helping teams locate stock across multiple areas.
An interactive map instantly shows where items are kept – including outdoor areas – so workers can find parts at a glance. It transforms static data into actionable insight. Benefits of this visual approach include:
- Pinpoint Any Part: Instead of wandering the floor, users can click or search for a part on the map and every location that holds it lights up. For example, a maintenance technician scanning a pump motor sees on screen exactly which shelf or cart the motors are on. This eliminates wasted time searching.
- Workflow Visibility: The map can mirror production flow. Zones like “Raw Materials,” “Cutting,” “Assembly” and “Finished Goods” show how parts move. If assemblies pile up before final QA, it’s obvious on the map. Managers see production bottlenecks at a glance because the map shows where work-in-progress is accumulating.
- Space Optimization: Maps reveal empty shelves and overcrowded racks. If one area is 90% full and another is half-empty, you know storage is unbalanced. You can then reorganize stock (for example, moving fast-moving items closer to production) to make better use of space.
- Intuitive Transfers: Moving inventory is a breeze: users can often drag items from one zone on the map to another with a click. This user-friendly drag-and-drop replaces tedious paperwork or data entry forms, speeding up transfers between stores and production lines.
- Faster Audits: During stocktakes, the map guides the route. Auditors can scan each highlighted location in order. If a quantity is off, the exact spot of discrepancy is immediately known. Ideally, with good processes, the map’s counts will already match the floor, making counts a formality.
- Visual Location Awareness: Instead of searching through long location lists or relying on memory, teams can navigate a visual map of the facility to quickly identify where inventory is stored. Clicking a mapped location displays the inventory assigned to that area, making it easier to locate parts, verify stock placement, and coordinate work between departments.
- Training and Communication: The map itself is a training aid. New employees learn layouts faster by referencing the map. Communicating locations also becomes easier. Saying “the part is in Bay 3, Section B” while both look at the map avoids misunderstandings.
By converting inventory data into a spatial layout, these tools align all teams around one shared view. For example, if a part is needed urgently, anyone can visually identify its location rather than relying on someone else’s notes. The map can be used on PCs or tablets at the point of use. In practice, an inventory map turns thousands of stock records into one simple picture. It answers “What do we have?” and “Where is it?” instantly. This shared visibility transforms decision-making: managers can reallocate stock on the fly and resolve issues days faster than before.
CyberStockroom: A Visual Inventory Management Tool
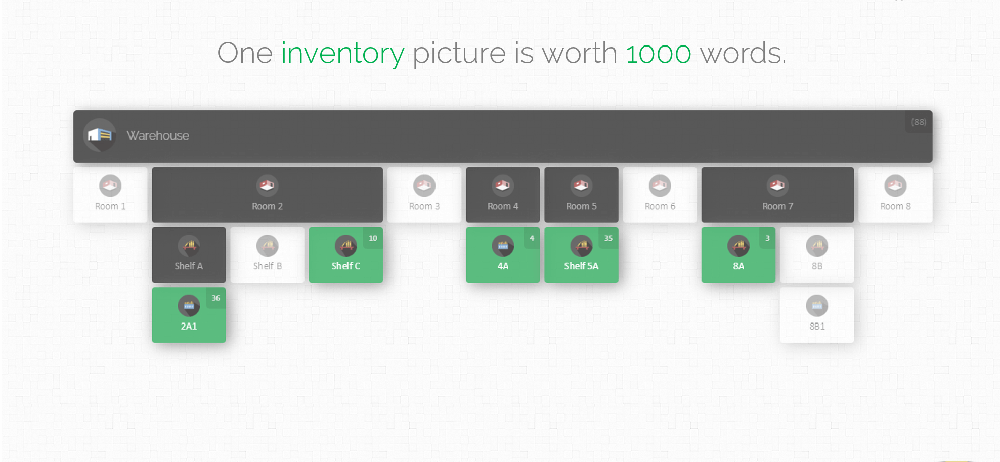
The best practices above come together in software like CyberStockroom. This cloud-based platform is built around visual maps and real-time updates. The sections below show how its features align with our goals (no external references needed, just a narrative integration of capabilities).
- Interactive Maps: You begin by creating a digital map of your facilities. Define zones for each warehouse, workshop, yard or even vehicle. For example, set up locations like “Main Store,” “Assembly Line 2,” “Tool Crib” and “Laydown Yard.” The inventory map becomes the main interface. Each part you add is tied to a spot on the map.
- Unified Visibility: All users see the same map. If a company has multiple sites, you can zoom out to view all locations or zoom in on one building. Everyone looks at one shared, up-to-date blueprint of inventory.
- Drag-and-Drop Transfers: Moving stock is intuitive: drag the item icon from one map location to another. The software then automatically logs that transfer. This makes issuing parts or relocating stock as easy as clicking and dragging on-screen, replacing forms or spreadsheets.

- Barcode Scanning: CyberStockroom supports barcodes on parts and bins. You can scan an item to pull up its record and map location instantly. This speeds up receiving and issuing. For example, scanning a scanned-in box shows you exactly which rack it went to.
- Part Distribution (X-ray) View: Need to know where a particular part is stocked? The “X-ray view” highlights all map locations containing that item, with quantities at each. This instantly shows how inventory is spread out.
- Custom Data Fields: Each part record can have extra attributes. Combined with the map, this lets you filter stock. For instance, filter the map to “project A” to see all parts allocated to that project.
- Real-Time Cloud Sync: Because it’s cloud-based, all inventory changes update live for everyone. A count entered in one building shows up immediately in another. This works on any internet device – the same interface runs on desktop, tablet or phone browser. There’s no separate mobile app to install.
- Activity Log: Every inventory action – who moved what and when – is recorded. If a part goes missing, the history shows who last accessed it and what they did. This audit trail deters loss and makes accountability clear.
- Alerts and Reporting: You can set minimum stock levels for each item. If inventory dips below that, the map flags it (for example, by coloring that bin red. Built-in reports let you track accuracy, usage history, turnover and other metrics, often tied to map locations.
Using a tool like CyberStockroom effectively enforces all our best practices. It centralizes data into one map, uses real-time scanning, and provides standardized processes through its interface. It also fosters cross-department coordination because any team can view any part’s status on the map. For instance, if maintenance sees the map alert that a bearing is low, they know immediately whether stores has any left. If not, procurement can schedule a replenishment.

Practically, this means no more “blind passes.” A production planner can run a report on the map for “all motors used this month” and see their exact locations. A stores clerk moving parts can drag them to “Assembly Line 3” and trust the counts are updated. In short, CyberStockroom turns an entire facility into one navigable inventory database – exactly what’s needed for full parts visibility.
Empowering Your Team
Even the best technology must be used correctly. Building a culture around the new system is essential. Key practices include:
- Hands-On Training: Provide practical, hands-on training for all users. Show warehouse staff, line operators and supervisors how to scan parts, navigate the map and carry out their tasks in the system. Use real scenarios so they practice receiving, issuing and transferring. Revisit training periodically, especially when new features are added.
- Inventory Champions: Appoint one or two “power users” or champions in each department or shift. These go-to people can answer questions, help troubleshoot issues, and coach others. Champions also monitor that procedures are followed correctly.
- Communicate Benefits: Explain clearly why visibility matters. If employees see that accurate data prevents production stops, they’ll be more motivated to use the system. Share success stories – for instance, how quickly a missing part was found thanks to the map.
- Daily Huddles: Start each shift with a quick team huddle reviewing the inventory map. A dashboard screen can highlight critical low-stock items or incoming shipments. This reinforces the process and catches issues early.
- Feedback Loop: Encourage suggestions. If a team member spots a way to improve the map layout or a process tweak, take note. Implementing user feedback builds ownership of the system and improves it.
- Recognition: Reward teams or individuals who maintain excellent inventory records. Publicly recognizing a crew that achieves perfect accuracy or invents a clever improvement reinforces the right behavior.
- Cross-Training: Have staff learn about other roles. For example, a warehouse assistant spending a day in production helps them understand needs and vice versa. This mutual understanding leads to better collaboration.
- Support Resources: Provide quick-reference guides and internal help channels (for example, a shared chat group) for inventory questions. Ensure someone (like an IT or inventory manager) is available to fix technical issues promptly.
Over time, a culture of data-driven collaboration will emerge. When all staff members, from operators to managers, trust and rely on the same system, they naturally work together toward common goals. The technology is the enabler; the engaged team is what makes it a success.
Data-Driven Optimisation
With full visibility established, use your data to continuously improve. Regularly review key performance indicators and adjust accordingly. Important metrics include:
- Inventory Accuracy (%): How often recorded quantities match physical counts. Aim for near 100%. Dips indicate a process breakdown in a certain area.
- Order Fill Rate (%): The percentage of parts requests fulfilled immediately. A lower rate signals stockouts; analyze map data to see which items are missing when needed.
- Inventory Turnover: How quickly inventory cycles. Compare categories to identify slow-movers (which tie up space) versus fast-movers (which may need tighter control).
- Stockouts or Near-Stockouts: Track how often critical parts run out. Each alert on the map can be logged and counted.
- Cycle Count Variance: Percentage difference between system and count for cycles. High variance pinpoints problematic areas.
- Lead Time and Reorder Compliance: Measure time from reorder alert to receipt. If lead times stretch unexpectedly, investigate supplier or process issues.
These metrics should be easy to pull from a unified system. For example, you might run a report showing that Gearbox Model X had 100% fill rate last month but Motor Y was only 80%. The map can then highlight where Motor Y stocks are located and help fix the shortage.
Concrete benefits often follow data analysis. For instance:
- Companies frequently reduce emergency shipments by 20% simply by spotting recurring shortages and pre-ordering in time.
- When inventory is organized and consumed on the map, many businesses cut inventory holding by 10–20% because redundant or obsolete parts become visible and can be cleared.
- Audit time can shrink dramatically – frequent cycle counts with scanning replace infrequent full counts.
Many systems allow exporting data for deeper analysis. You could perform an ABC analysis (categorizing parts by turnover) and then adjust stocking policies. Or you could use historical map data to forecast seasonal demand.
In lean terms, this approach creates continuous feedback loops. Teams identify waste (excess stock or lost time searching) and eliminate it step by step. Over time, these improvements compound: fewer rush orders, less holding cost, and smoother production flows. Essentially, the map shifts your operation from reactive firefighting to proactive planning.
For example, if the map consistently shows a certain part sitting idle, you might decide to reduce its stock or move it out of prime real estate. If a workcell regularly triggers low-stock alerts at day’s end, you might raise its reorder point. Each tweak is guided by data.
Achieving Cross-Department Collaboration
All of these techniques serve one goal: full visibility for every team. When inventory is centrally managed and visualized, departments naturally work together:
- Shared Platform: Procurement, stores, production and maintenance all access the same map. No one works in a silo. For example, production won’t over-order because they can see stores’ real-time stock. Maintenance knows exactly what’s already scheduled for production, so they order spares appropriately.
- Aligned Goals: Everyone focuses on the same data. If one department sees a part running low on the map, they can reach out to the responsible team or simply scan it out themselves. Success is measured using common metrics like fill rate, so all teams have skin in the game.
- Efficient Communication: Rather than calls or meetings to check stock, teams consult the system. A quality engineer can look at the map to see if spare parts arrived; a project manager checks the map for materials staged for a job. This cuts unnecessary back-and-forth and makes handoffs smoother.
- Accountability: With the audit log, it’s clear which team or user last moved a part. If discrepancies appear, teams can investigate together by reviewing the map’s history. This transparency encourages everyone to keep records accurate.
- Cross-Functional Planning: Since the map shows inventory across the site, departments help each other. For instance, if maintenance sees that a critical part is low but production still has some on hand, they can coordinate an internal transfer rather than ordering new stock.
In practice, a visual inventory system turns coordination from a chore into a byproduct of daily work. Teams adjust their work based on shared information. The result is a responsive operation where parts flow smoothly through receiving, storage, production and shipping – all orchestrated by the live map.
Inventory Mapping and Lean Manufacturing

Modern visual inventory systems align naturally with lean manufacturing principles. Lean emphasizes visual controls and continuous flow – both of which an inventory map provides. For example:
- Digital Kanban: Lean plants often use cards or boards to signal inventory needs. A live map acts as a digital Kanban. When stock dips at a line, the map’s color change or alert serves as the signal to replenish, without needing physical cards.
- Waste Elimination: Lean’s goal is to eliminate waste (muda). Searching for parts is waste; a map eliminates this by pointing directly to items. Overproduction (ordering too many parts) is also reduced, since everyone sees what’s already on hand. This aligns with lean’s pull system concept.
- Visual Location Control: Lean operations depend on making work easier to see, understand, and act on. A visual inventory map supports that goal by showing where parts, materials, and storage areas are physically located across the facility. Instead of relying on memory, handwritten notes, or unclear location codes, teams can use the map to find inventory faster, confirm where items belong, and keep departments aligned around the same layout.
- Standardized Work: Scanning and map-updating become part of standard operating procedure, which is a lean principle. Because each move is recorded the same way, inventory tasks are standardized and predictable.
Over time, these practices turn the map into a lean tool. For instance, if two parts are always used together, the map might prompt you to store them together, reducing motion. If an area consistently shows yellow, teams will refine their process until it’s green. In essence, the inventory map supports continuous improvement by making data visible, which is the heart of lean thinking.
By integrating a visual system, companies effectively digitize many lean methods. Stock flows become more just-in-time. Misalignment between teams shrinks. The operation as a whole becomes more agile, with inventory managed as neatly as any other lean process.
Benefits and Return on Investment
Modernizing inventory tracking is an investment, but the payoff is substantial. Companies often see:
- Lower Inventory Costs: Better data lets you reduce safety stock. This frees up working capital and cuts holding costs. It’s common to see overall stock levels drop by 10–30% because excess or obsolete items become visible and can be cleared.
- Reduced Downtime: With parts more available on time, production slows or stops far less often. Even a small reduction in downtime translates to significant savings in high-volume manufacturing.
- Faster Throughput: Workers spend less time on manual inventory tasks and more on productive work. Productivity typically rises (often by 10–20%) as processes remove inventory bottlenecks.
- Fewer Emergency Orders: Improved visibility and alerts mean you reorder before stockouts occur. Companies report up to a 20% reduction in rush orders and expedited shipments.
- Space Optimization: Organising stock frees up valuable space. This can delay or eliminate the cost of expanding storage capacity.
- Error Reduction: By scanning items and using standardized workflows, inventory mistakes drop dramatically (often by 90% or more).
- Rapid Audit Cycles: Audits and cycle counts become quicker. Many businesses find they no longer need year-end shutdown counts and can rely on continuous spot-checks.
Putting numbers on the benefits, firms that switch typically improve fill rates and accuracy near 99%. One example: a plant that cut its emergency order volume by 30% found that the cost savings quickly offset the system’s investment. Another found that inventory carrying cost was reduced by 15% after decluttering through the map. Time savings also add up – if each picker saves an hour a week by not hunting for parts, those labor costs go straight to the bottom line.
Overall, the return on investment often comes within months. The new process pays for itself in reduced waste and higher productivity. Moreover, because the system is scalable, future expansions (new lines or sites) leverage the same platform without duplicating effort.
Getting Started with Modern Inventory
Rolling out a visual inventory system should be planned carefully:
- Assess Current Processes: Map out how parts currently flow through your facility (receiving, storage, picking, returns). Identify pain points and data sources.
- Define Locations: Survey your space and decide how detailed the map should be (buildings, rooms, aisles, shelves, bins). Label each location clearly in the physical space to match the software.
- Cleanse Data: Audit your parts list first. Remove duplicates, merge similar records, and standardize naming. Assign unique codes to each part and location before import.
- Pilot and Train: Start with one area or department. Train its staff thoroughly and resolve issues. Use their feedback to refine processes. Once stable, expand to other areas.
- Integrate Scanning: Distribute scanners or mobile devices and affix barcodes/QR codes to parts and bins. Test scanning and transfers in the system with a few mock transactions.
- Monitor and Adjust: After go-live, review system reports. Are on-hand quantities matching reality? Are low-stock alerts triggering correctly? Adjust workflows or thresholds as needed.
- Communicate Progress: Keep teams informed of successes. If a pilot reduces errors or delays, share the news. This builds momentum for wider rollout.
- Scale Gradually: Add more locations or product lines over time. For instance, after one warehouse is mapped, move on to production lines, then to other buildings.
- Iterate: Periodically revisit your setup. As layouts or processes change, update the map and procedures. The system should evolve with the business.
A phased approach minimizes disruption. Early visible wins (like easily finding a part on the map) provide motivation. With careful planning and training, your organization can transition smoothly from notebooks to navigation screens.
Overcoming Implementation Challenges
Introducing a new inventory system can bring hurdles. Here are some common challenges and how to address them:
- Data Cleanliness: Migrating data often reveals duplicate SKUs or missing info. Tackle this by cleaning your part database first. Remove obsolete SKUs and merge duplicates to ensure a smooth import.
- User Resistance: People comfortable with old methods may resist change. Involve key users early: let them help name locations or organize layouts. Show quick wins (e.g. finding parts in seconds) to build buy-in.
- Incomplete Scanning: Staff might skip scanning or make mistakes. Emphasize the “scan everything” rule in training. Use controls like mandatory reason codes for adjustments so missing scans stand out. Spot-check compliance regularly.
- Hardware Issues: Scanners and tablets can fail or lose connectivity. Mitigate this by having backups (extra devices, spare batteries) and ensuring strong Wi-Fi coverage across the site. Test equipment thoroughly before full rollout.
- Scale of Rollout: Mapping a large facility with thousands of parts can feel daunting. Simplify by starting with critical areas. Even mapping one warehouse can show big benefits. Then expand the map step by step.
- Leadership Buy-In: Without management support, projects stall. Secure leadership by demonstrating strategic benefits: lower costs, fewer delays, improved customer service. Share pilot results (like metrics on errors or stockouts) to get continued backing.
By anticipating these challenges and addressing them early, you can smooth the implementation. Break the project into manageable steps, maintain open communication, and adjust as you learn. Each successful step will build confidence and make the next one easier.
Conclusion
Modernizing inventory tracking on the production line is no longer a luxury – it’s a necessity for competitive manufacturing. By centralizing data and embracing real-time, map-driven tracking, organizations eliminate the blind spots that cause delays and waste. Key practices such as standardized scanning, consistent labeling and interactive maps provide a single source of truth for every part.
When procurement, warehousing and production all look at the same live inventory map, collaboration and efficiency take off. Production lines stay supplied without surprises, audits become trivial, and data-driven planning is a daily reality. Systems like CyberStockroom show how these ideas come together – turning the entire plant into one navigable blueprint. Inventory is no longer hidden in spreadsheets; it’s visible on screen for everyone to use.
Moreover, this foundation prepares the business for future demands. As products or processes change, the same system scales to accommodate them. In a world where every minute of uptime and every penny of inventory counts, this visibility is indispensable.
Modernising production line inventory tracking with a visual system supports lean, agile operations. Each move from clipboard to map makes your team more proactive and informed. Embracing visual inventory management is not just about smoothing today’s production – it lays the groundwork for tomorrow’s continuous improvement. Remember, each step of this journey brings valuable insight: by the time the first part is found by a tap on the screen, you’ll wonder how you ever worked any other way.









Leave a Reply