Most warehouse and stockroom improvement projects begin with labels, bins, reorder points, or a clean-up exercise. Those things matter, but they do not solve the deeper problem on their own. In manufacturing, the real failure point is often location clarity. A team may technically have the part on site, yet production still waits, maintenance still searches, purchasing still orders a duplicate, and quality still holds stock in an area nobody else can see clearly. Inventory visibility improves when the business knows what it has, where it is, and what state it is in, across every part-holding area, not only the main store.
A digital inventory map fixes that problem at the source. It turns the physical layout of a warehouse, stockroom, department store, staging area, inspection zone, shelf, rack, and bin into a shared address system. That makes the stockroom easier to navigate, easier to count, easier to slot, and easier to trust. Mapping also supports traceability, because a quantity in the system is no longer an abstract number. It is tied to a visible location that the team can find, verify, and manage.
That is why a warehouse stockroom organization digital inventory map approach is such a strong starting point for manufacturing environments. It aligns central stores, maintenance, production, engineering, quality, and purchasing around the same physical reality. It also gives you a practical way to manage raw materials, work in progress, finished goods staging, and MRO parts, all of which behave differently and need different levels of location control.
When the map comes first, the rest of the operating model becomes easier to design well. Slotting rules become clearer. Receiving and put-away flow improves. Line-side replenishment becomes less dependent on memory. Kitting and staging become easier to manage. Location-based cycle counting becomes more practical. Hidden cupboards, overflow cages, and unapproved sub-stores become visible instead of becoming silent sources of inaccuracy.
CyberStockroom fits naturally into this map-first operating model. It enables teams to build a live visual map from bins to buildings, break the site into locations and sub-locations, see quantities at a glance, move stock between locations on the map, view product distribution across multiple areas, and use activity history to understand what changed, where, and when. In practical terms, that means the inventory map is not just a reference image. It becomes the working surface for stock organisation, location tracking, and cross-department visibility.
The article below sets out a full best-practice model for warehouse operations teams that want stronger parts visibility across departments. It explains why the map should come first, how to design the floor plan and location hierarchy, what daily disciplines keep it accurate, how CyberStockroom supports the model, and how to roll the approach out in a controlled way without turning the project into a prolonged clean-up exercise.
| Focus area | Traditional approach | Map-first approach |
|---|---|---|
| Location control | Locations live in notes, labels, or memory | Locations are defined visually and hierarchically |
| Cross-department visibility | Each team sees only its own corner | All departments share the same physical view |
| Search and retrieval | People ask around or walk the floor | People navigate to a defined location |
| Counting | Large, disruptive counts | Smaller, location-based verification |
| Reorganization | Physical changes happen first, records catch up later | Layout changes are designed and reflected together |
| Stock trust | Frequent disputes about what is really on hand | Higher trust because quantity and location stay linked |
The quickest way to understand why stockroom organization often breaks down is to look at an urgent parts request. A machine fails. Maintenance needs a replacement item immediately. The store record says the part exists. Production says the line-side cupboard is empty. Purchasing cannot tell whether more stock is in engineering, in quarantine, in an overflow cage, or still sitting in a receiving lane. Someone places an emergency order, only to discover later that the item was already on site under a different location description or in a department sub-store that no one else could see. Disorganized storerooms lengthen downtime, and weak visibility encourages duplicate orders and avoidable stockouts.
What failed in that situation was not only stock control. It was the absence of a clear, shared model of the floor. When locations are vague, when temporary areas are not counted as real locations, and when every team describes the same space differently, the inventory record loses meaning. The stockroom starts to depend on local knowledge instead of a common operating picture. That dependency becomes a risk the moment a part is moved, reslotted, borrowed, staged for a job, or stored outside the main cage.
A inventory map is the practical answer. In warehouse operations, mapping means translating the physical building into a logical structure of spaces, zones, and addresses that can be used every day. The map should identify not just the main warehouse, but also the smaller details that often cause the most trouble, such as aisles, racks, shelves, bins, cabinets, inspection areas, staging lanes, overflow positions, and point-of-use stock points. Warehouse mapping is the process of structuring the floor into coordinates and labels so the business can execute work with traceability instead of guesswork.
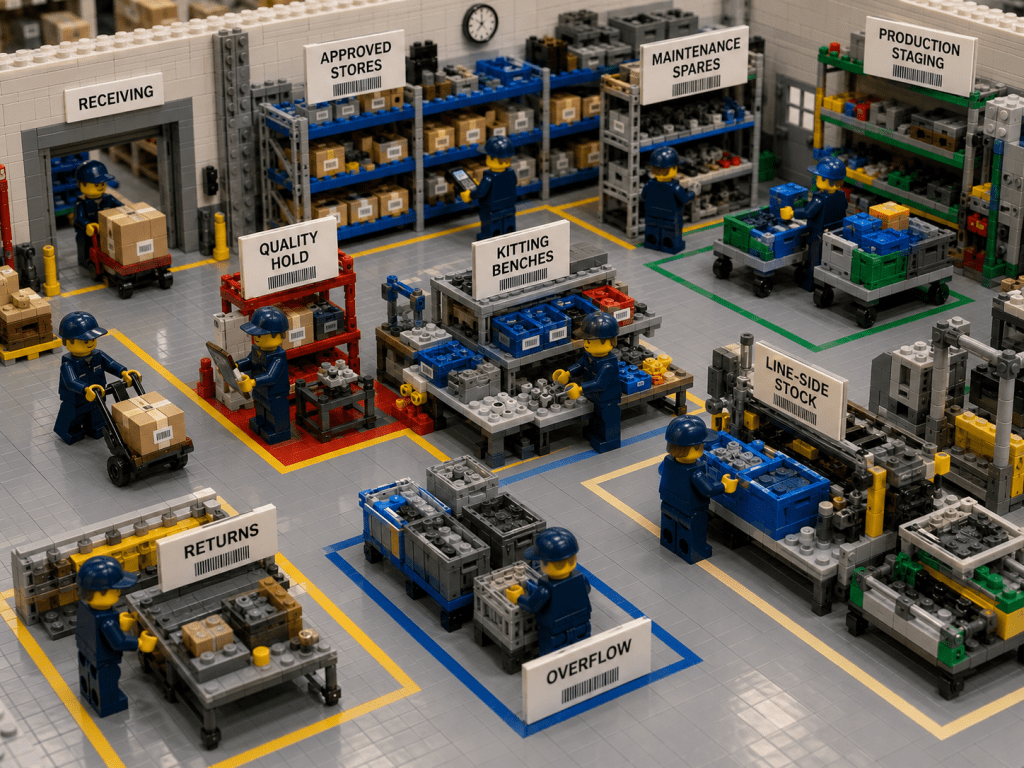
That is what makes the warehouse stockroom organization inventory map idea so useful. It shifts stockroom design away from a static shelving plan and towards an operating system for the plant. In a manufacturing setting, the map should show where raw materials are received, where quality checks happen, where approved stock is stored, where kits are built, where work in progress waits, where line-side stock sits, where returns go, and where non-conforming material is held. If the map does not reflect the way work actually moves through the site, the system will be visually impressive and operationally weak.
A good digital inventory map also improves communication between teams. Instead of passing vague instructions like “it is in the back room” or “check by assembly,” people refer to named, visible locations. That shared visual understanding matters in factories where maintenance, production, QA, stores, and procurement all touch the same parts in different ways and at different times. When location becomes a common language, cross-team hand-offs become cleaner and disputes over stock become easier to resolve.
Why an inventory map should come first
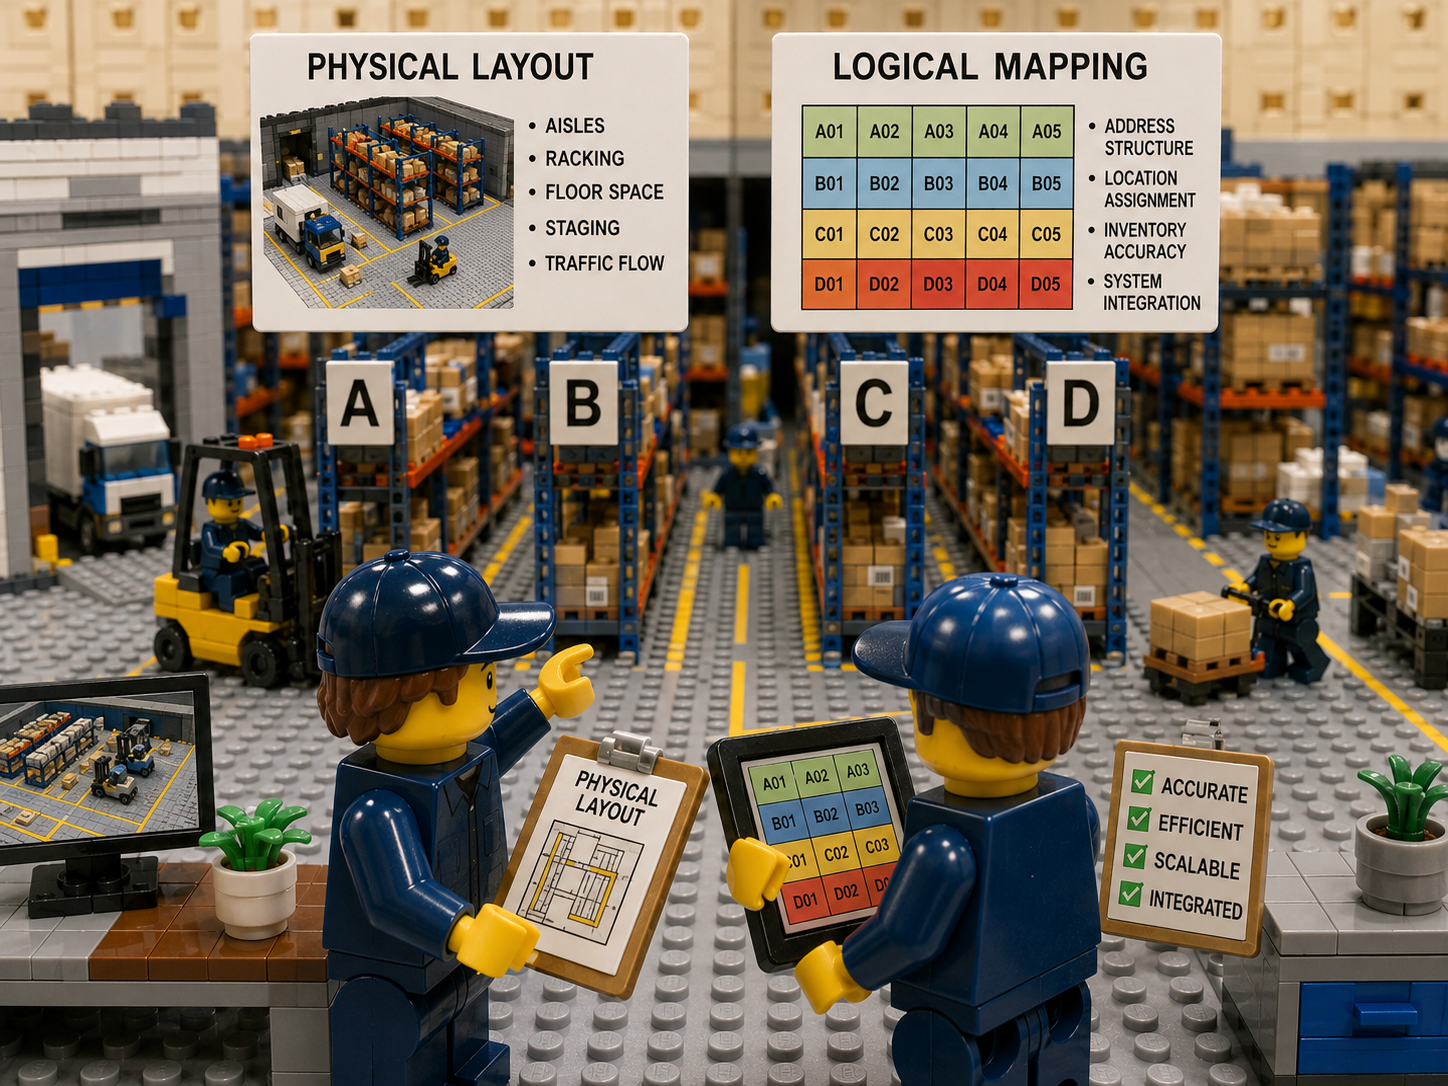
A warehouse or stockroom has two separate design jobs. The first is the physical layout, meaning aisles, racking, floor space, staging, and traffic flow. The second is the logical mapping layer, meaning the address structure that tells the business exactly where each item belongs. Many sites work on the first job and postpone the second. That is why they end up with well-installed shelving and poorly controlled stock. Layout creates the space. Mapping turns that space into an address system that inventory teams can trust and use.
This distinction matters because lists are not locations. A line in an item master can say “Bearing 6205, quantity 8,” but that does not tell the production planner whether the stock is in the approved store, still in receiving, staged for a shutdown, held in QA, or spread across three different departments. Mapping solves that by connecting the record to a visible place. It also forces useful discipline, because every stock-touching area has to be named and treated as part of the system rather than ignored as “temporary.”
That is one reason a digital inventory map should come before a broader stock rationalisation exercise. If you reduce stock levels before you understand the floor, you risk increasing search time, creating awkward replenishment routes, and pushing people into unofficial storage habits. If you map first, you can see where duplicate storage exists, where dead space sits, where stock is parked without ownership, and where high-demand parts are too far from the issue point or point of use.
Manufacturing sites also need the map to include spaces that a general warehouse drawing often leaves out. Dedicated receiving lanes, quality checking areas, put-away buffers, approved stores, quarantine zones, kitting benches, line-side supermarkets, WIP buffers, returns, and overflow all affect visibility. When these spaces are not mapped, inventory appears available when it is not actually issuable, or it disappears operationally even though it still exists physically. Dedicated zones create predictable flow and reduce backflow.
The choice of overall floor pattern also matters. Common warehouse flow patterns include U-shaped, I-shaped, L-shaped, and grid layouts. None is universally “best.” The right pattern depends on site shape, throughput, the separation needed between inbound and outbound activity, and how closely the stockroom needs to sit to production or service areas. The comparison below adapts those common patterns for a manufacturing stockroom context.
| Layout pattern | How the flow works | Where it works well in manufacturing | Main watch-out |
|---|---|---|---|
| U-shaped | Receiving and issue or shipping sit on the same side, with storage in the middle | Central stores with shared staging, strong supervision, and frequent inward and outward movement | Congestion can build if staging is loose or issue traffic overlaps inbound work |
| I-shaped | Receiving starts at one end, storage sits in the middle, issue or shipping leaves from the opposite end | Long buildings, cleaner separation of inward and outward traffic, high-volume linear flow | Longer travel distances and more dependence on good slotting |
| L-shaped | Receiving and issue sit on different faces of the building | Mixed-use plants that need separation between noisy or high-traffic areas | Can consume more space and may need extra handling equipment |
| Grid | Systematic aisles and repeatable rack structure across a large storage area | Deep parts catalogues, consistent cycle counting, clear zoning, scalable address logic | Poor slotting will still create long walks even in a neat grid |
The floor plan also needs a location hierarchy. Without that hierarchy, the map becomes decorative instead of operational. In practice, the hierarchy should work from the broadest level of the site to the point where misplacement becomes expensive. For some consumables, a broader bin-level address may be enough. For critical spares, calibrated items, highly similar components, or stock that moves between departments, the hierarchy often needs to go down to shelf, drawer, pocket, or exact bin. A practical rule is to design location precision to the level where losing the item would create real cost or delay.
The key is consistency. The same part should not be described as “maintenance cage,” “MRO room,” and “spares cupboard behind line 3” depending on who is asked. Warehouse location mapping works when it assigns unique addresses to storage areas, work zones, and travel-adjacent spaces in a systematic way. That common address logic becomes even more important when the same SKU exists in multiple physical locations. Everyone must know that multiple locations exist, and the controls have to account for them instead of letting them become a source of confusion.
Another design choice is how you group the stock itself. Some plants group by commodity, which keeps bearings with bearings, seals with seals, and electrical items with electrical items. Others group by equipment family, which keeps all the parts for a specific asset or line together. Both approaches have strengths and weaknesses. Commodity grouping supports control and comparison of similar parts, while equipment-family grouping makes it easy for line teams to find everything for one asset in one place. A mapped hybrid model is often the strongest option, because it combines precise locations and shared visibility with a deliberate rule for which parts should be centralised and which should sit close to use.
| Storage logic | Strength | Risk | Best use in a mapped stockroom |
|---|---|---|---|
| Commodity-based | Stronger control over similar parts and less duplication | Requires accurate equipment references and disciplined issue processes | Common items shared across multiple assets or departments |
| Equipment-family based | Easy for asset-focused teams to find what they need | Duplication risk and weaker visibility across the wider plant | Rare, asset-specific parts with low sharing potential |
| Hybrid mapped model | Balances control with ease of access | Needs clear rules and a strong location hierarchy | Most multi-department manufacturing environments |
The final reason the map should come first is behavioural. If locations do not match how people walk the site and think about the facility, the system will never be trusted. The floor plan should mirror reality, not force reality to fit a clever coding scheme that no one on the floor understands. Teams adopt better habits when the place they see on screen matches the place they see in front of them. That simple point is often the difference between a stockroom project that lasts and one that fades after the launch meeting.
The Best-practice Model for Multi-department Parts Visibility

Map every stock-holding and stock-touching space
If the goal is full parts visibility across departments, the map cannot stop at the main racking area. It has to include every place where inventory can be received, stored, staged, issued, inspected, held, returned, or temporarily parked. In a manufacturing environment that normally means receiving, quality hold, approved stores, maintenance spares, production staging, kitting benches, line-side stock, overflow, returns, and any departmental stock points that carry real quantities. Mapping these areas is what turns visibility from a store-only concept into a plant-wide operating practice.
This is especially important because manufacturers usually manage several categories of inventory at once, such as raw materials, work in progress, finished goods, and MRO stock. These categories behave differently. Raw materials need strong receiving and put-away control. WIP needs visibility through the production process. Finished goods need clear staging and shipping readiness. MRO parts need reliable location control so maintenance does not lose time when equipment fails. An invnetory map gives each category a visible home and keeps the categories from blurring into each other.
When teams fail to map these states properly, they create false availability. A planner sees stock “on hand,” but it may be in quality hold. A supervisor sees a part count in the system, but half of it may be staged for a shutdown. A buyer sees a low balance and places an order without knowing that overflow stock exists in another building. These are not software problems in the narrow sense. They are location-design problems. Once the floor plan treats every material state as a visible location, the accuracy of the wider process improves.
Standardize the language of parts and locations
An inventory map only works when the language around it is clear. Parts need meaningful descriptions. Locations need consistent naming. Units of issue need to match reality. If the stockroom says “box” but the department issues “each,” the count will drift even if the map is perfect. Clean location control begins with clean language. That means removing duplicate item names, archiving obsolete items, tightening vague descriptions, and making sure the team can identify a part without opening three extra screens or asking the longest-serving storekeeper.
Storeroom organisation guidance consistently points to the same rule: anybody should be able to find any part. That is only possible when description logic and location logic reinforce each other. If locations are precise but the item catalogue is messy, the user may still walk to the wrong shelf. If the item descriptions are clean but the locations are vague, the search still fails on the floor. Strong parts visibility comes from linking the two.
The same principle applies to labels. Bins, racks, drawers, and shelves need to use the same naming structure that appears in the system. Good slotting also depends on the wider storage environment being labelled and organised, because even strong slotting logic breaks down when aisles are cluttered, locations are unmarked, or stock overflows into unplanned spaces.
Slot by velocity, criticality, size, and handling constraints
Slotting is one of the clearest reasons to begin with a digital inventory map. The map shows where the work is happening. Slotting decides what should sit closest to that work. In practical terms, high-demand parts and frequently issued items should sit in accessible pick faces near the issue point, packing point, or internal customer they serve. Slow-moving items can sit deeper in the store. Heavy items belong in positions that reduce manual strain and handling risk, often on lower shelves or in easier-access base locations.
ABC logic remains useful for early slotting decisions. Items with the highest movement frequency belong in the locations that save the most travel. But velocity is not the only factor that matters. Size, weight, affinity, storage requirements, and handling method all affect the right location. Two parts may move at the same frequency, yet one belongs near a caged issue point and the other near a line-side replenishment zone. An inventory map makes those trade-offs visible because it places inventory against the real geometry of the site rather than in a flat list.
Slotting also needs to change over time. Demand patterns move. Product mix changes. Seasonality changes. Shutdown work creates temporary surges. New lines open. Old assets are retired. That means slotting cannot be treated as a one-time shelf allocation. It is a repeating discipline. The map should make reslotting easier by showing which locations carry the heaviest traffic and which zones are underused or overloaded.
A practical way to present slotting decisions for a manufacturing stockroom is shown below.
| Part type | Typical location rule | Reason |
|---|---|---|
| Fast-moving consumables | Near issue points or the departments that use them most | Cuts travel and queue time |
| Critical maintenance spares | Precise, tightly controlled locations with strong visibility | Misplacement cost is high |
| Heavy or awkward items | Lower shelves or floor-level controlled locations | Easier and safer handling |
| Similar-look components | Clearly separated bins with exact labels | Reduces picking mistakes |
| Staged shutdown stock | Temporary mapped staging locations | Keeps planned work visible |
| Slow-moving reserve stock | Deeper reserve positions | Preserves accessible space for high-use items |
Treat line-side stock and departmental stock as managed locations
One of the most common causes of poor parts visibility is the rise of unofficial stock points. A supervisor keeps a few “just in case” items in a cabinet by the line. A technician borrows stock and holds it in a toolbox. An engineering team stores project parts on a bench. A shutdown team claims a corner of the warehouse for several weeks. None of these practices is unusual, but all of them weaken visibility when the locations are not treated as legitimate parts of the address structure. Hidden stashes and remote locations are a known source of inaccuracy in storeroom control.
The answer is not to ban every remote stock point. The answer is to map them. Line-side storage, point-of-use stock, and department issue stock can all make sense operationally when they are visible, replenished, counted, and governed as real locations. Line-side storage exists to keep materials close to the production line and speed replenishment. That convenience becomes a strength instead of a visibility problem when the point-of-use location is part of the digital inventory map.
This is where the warehouse stockroom organization inventory map becomes more than a warehouse project. It becomes a plant visibility project. Central stores still matter, but full parts control depends on being able to see beyond central stores. When departmental locations are mapped, centralised oversight and decentralised access stop fighting each other. You can let stock sit where work needs it, without losing it operationally.
Use kitting and staging to remove search and waiting time
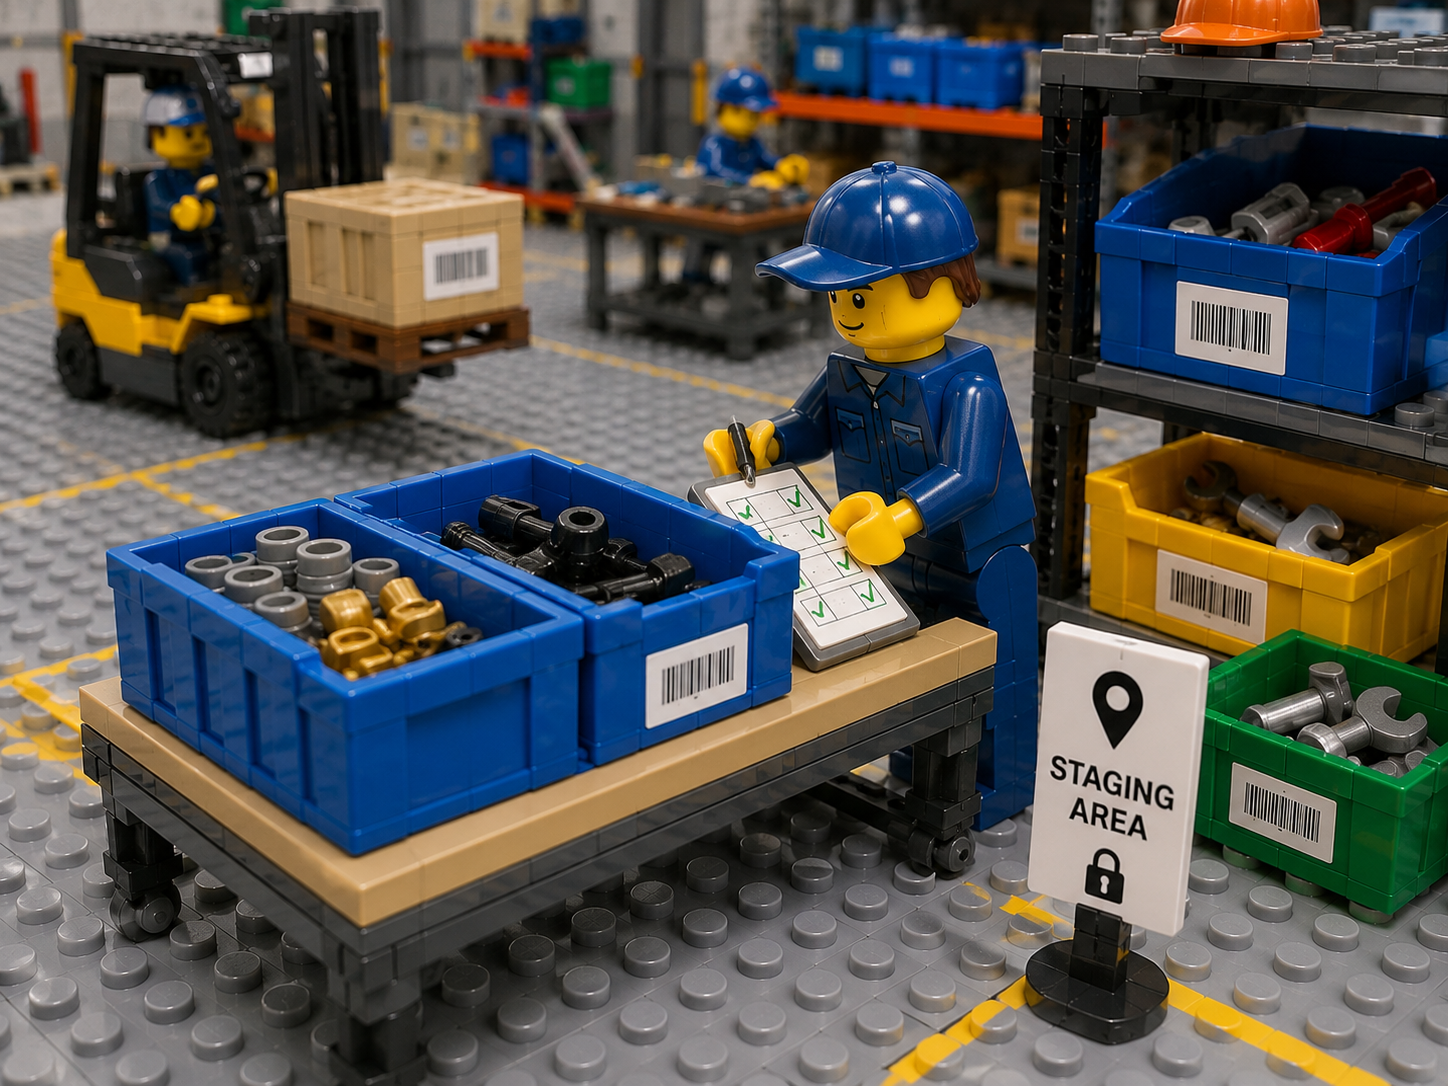
Kitting and staging are two of the most practical tools for improving cross-department parts visibility. Kitting means pulling the full set of parts, materials, and any required tools for a planned job. Staging means placing that kit in a designated secure location near the point of execution, ready for use. Done well, these practices reduce downtime, cut technician waiting, and lower the number of repeat trips to the stockroom.
The important point is that kits and staging areas need to exist on the map. If a work kit is built and then parked on a bench or left in a trolley without a real mapped location, visibility drops again. The stock is technically issued, but the people who need it may still not know where it is. A mapped staging area keeps planned jobs visible to maintenance, stores, and production at the same time.
This same logic applies to production jobs. If a manufacturing order requires a staged set of components for a line, the staging location should be visible and countable, not treated as a momentary physical fact that the system will catch up with later. Search time falls when the business stops thinking of staging as invisible transit and starts treating it as a named inventory state.
Build a cycle counting rhythm around locations
Full physical counts have their place, but they are not enough to support daily trust in a busy manufacturing stockroom. Cycle counting works because it breaks counting into smaller, more regular checks. Location-based cycle counting is especially useful in mapped stockrooms because it focuses on specific storage locations rather than trying to sweep the entire facility at once. That approach supports accuracy without forcing a large operational halt.
A good count schedule should reflect the value and consumption rate of the parts in each location. High-use or high-value zones need more frequent verification. Lower-risk zones can be counted less often. The map makes this easier because the business can assign count cadence to physical areas and track which zones are clean, which have recurring discrepancies, and which need layout or process changes instead of repeated recounts.
Location-based counting also improves root-cause analysis. If the same zone repeatedly fails count checks, the business can examine whether the issue is poor labelling, awkward slotting, uncontrolled transfers, or opportunistic temporary storage. Without a inventory map that connects counts to visible locations, those signals are much harder to interpret.
Make transfers simple and accountable
Accuracy drifts when a stock move is physically easy but systemically awkward. If the team moves inventory between receiving, QA, central stores, kitting, line-side, and returns several times a day, but the record is hard to update, people will postpone the transaction. That delay produces a false picture of stock, and the false picture then triggers bad decisions. A good operating model makes the physical move and the inventory update feel like one action, not two separate jobs.
That is why transfer discipline matters so much in multi-department environments. The issue is not merely whether stock moved. It is whether the destination location became the new visible truth fast enough for every other team. Production, maintenance, and purchasing do not need complex theory here. They need a system where moves are quick, clear, and recorded against the right destination.
Use the map to reduce onboarding time and operational dependence on memory
One underappreciated benefit of a inventory map is training speed. In an unmapped stockroom, the new team member learns by shadowing people and gradually absorbing local memory. In a mapped stockroom, the new team member learns the site visually. The layout itself becomes part of the training guide. This matters in manufacturing environments with multiple shifts, temporary labour during shutdowns, and cross-functional teams who do not spend all day in stores but still need to find or understand stock regularly. Visual layouts support navigation and simplify onboarding.
That is also why the floor plan should include naming that makes sense to the plant, not only to the inventory team. If the shop floor calls an area “Press Line Stores,” the map should not rename it into something nobody recognises. Precision matters, but so does natural fit with the language of the operation. The strongest stockroom systems are disciplined without becoming cryptic.
Use a simple diagnostic to spot visibility gaps
The table below is a useful way to diagnose whether your current stockroom problems are really layout and visibility problems in disguise.
| Symptom | Likely root cause | Map-first response |
|---|---|---|
| Stock shows on hand but cannot be found | Location not precise enough, or stock exists in unmapped sub-stores | Tighten location hierarchy and map all departmental stock points |
| Repeat duplicate purchases | Buyers cannot see all valid locations and statuses | Build one visible floor model across buildings and departments |
| Frequent part searches before maintenance work | Kitting and staging are weak or invisible | Add mapped staging locations and planned kits |
| Counts drift after reorganisations | Physical changes happen without map updates | Make map updates part of every layout change |
| New staff depend on one experienced storekeeper | Location logic exists in memory, not in the system | Use a visual map with clear naming and consistent labels |
| QA or non-conforming material gets mixed into available stock | Material states are not represented as real locations | Map inspection, hold, and quarantine zones explicitly |
| Line-side cupboards multiply | Point-of-use stock is convenient but unmanaged | Treat each point-of-use area as a counted location |
The central idea in all these best practices is simple. The map is not an extra layer of documentation. The map is the foundation of location truth. Once you accept that, the rest of the stockroom model becomes easier to design, easier to train, and easier to improve.
How CyberStockroom Enables Mapped Stockroom Control
A lot of inventory software still begins with product records and transaction lists. CyberStockroom takes a different path. It starts with the map. That matters because it keeps the most important operational question in view at all times: how many of what do we have, and where is it? CyberStockroom enables teams to build a live, interactive map of the operation, from bins to buildings, and to use that map as the working surface for inventory control.
A live map of locations and sub-locations
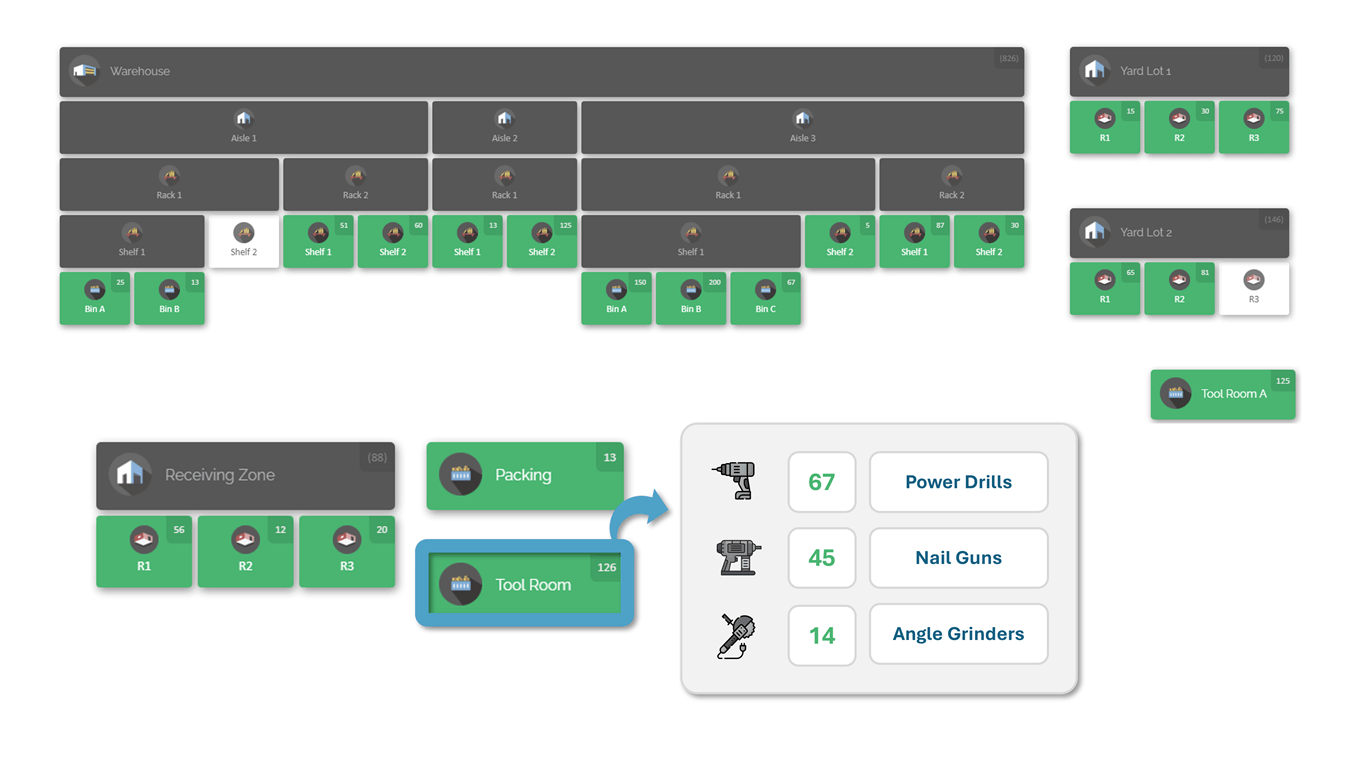
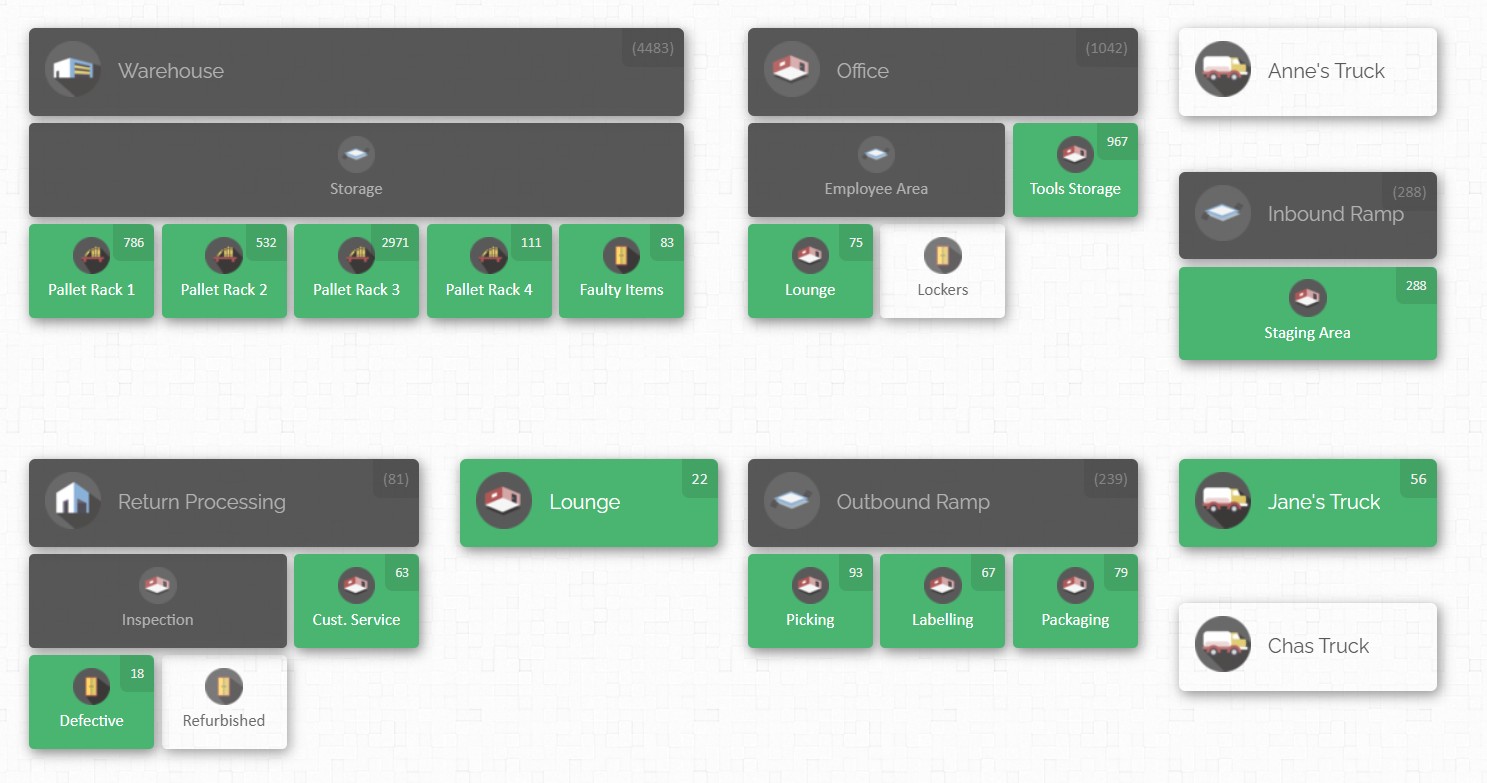
With CyberStockroom, you can break the business down into any number of locations and sub-locations, rearrange the layout to match how you see the business, and view product quantities at a glance. That is important for manufacturing sites because the operation rarely fits into one neat store. You may need visibility across warehouses, rooms, shelves, bins, staging areas, production support zones, or multiple buildings. CyberStockroom supports that kind of granular location model and is designed to reflect both major areas and the smaller locations that normally get overlooked.
The practical result is that central stores, maintenance cages, production support stock, QA-related locations, and temporary staging areas can all sit inside one visible structure. Instead of trying to reconcile separate local views, teams look at the same mapped layout. That shared visual understanding is exactly what multi-department parts visibility needs.
Exact location tracking
CyberStockroom is built around inventory mapping, so products are checked into designated locations on the map. Teams can define and label spaces such as warehouses, buildings, floors, rooms, shelves, bins, and other storage points, then assign stock to those locations. The system is designed so the map reflects the physical layout, which makes it easier to locate items and verify that stock is stored where the operation expects it to be.
That is a strong fit for manufacturing stockrooms because precision can vary by need. You can begin with major locations and add more detail where misplacement carries real cost. A broad reserve area may be enough for low-risk consumables, while critical spares or similar-looking components can be tracked at shelf or bin level. CyberStockroom’s map-first design supports that gradual refinement rather than forcing the entire site to be modelled at maximum detail from day one.
Visual stock organization that matches the floor
CyberStockroom is especially useful when layout matters as much as quantity. The map gives a bird’s-eye view of inventory and can be customised to align with the actual warehouse or stockroom arrangement. That means stores teams can organise the map around the real flow of the site, not around an abstract list structure. For plants trying to improve warehouse stockroom organization inventory map performance, this is a practical advantage, because the visual model can mirror the physical operation closely enough to support day-to-day decision-making.
It also supports space planning. Official CyberStockroom materials describe visual layouts that help teams identify storage locations, assess inventory levels quickly, and plan movement of goods more efficiently. In other words, the map is useful not only for finding parts, but for improving how the stockroom is arranged over time.

Faster, clearer transfers between departments and zones
CyberStockroom supports drag-and-drop transfers on the map, so teams can move items between locations and sub-locations visually. This matters because manufacturing stock moves constantly. Parts shift from receiving into stores, from stores into kits, from kits into line-side stock, from departments back into returns, and from one building to another as plant priorities change. If those moves are hard to record, the inventory picture starts to drift. If they are quick and visual, the record is more likely to stay current.
The map-first transfer model is especially useful for what might be called micro-transactions, those small, frequent location changes that people often postpone because traditional transaction screens feel slow for such a simple physical move. CyberStockroom’s drag-and-drop design is intended to reduce that friction. That makes transfer accuracy more practical in the real world, which is exactly what plants need if they want cross-team stock visibility to survive beyond audit day.
Product distribution visibility across departments
One of the strongest CyberStockroom capabilities for multi-department parts visibility is its product distribution view. The “X-ray vision” concept where a user can select a product and see its distribution across locations, locate items quickly, and assess product levels visually. Company materials for multi-building factory use show the same idea in practice, with a product highlighted across several site areas and quantities visible in each location.
That is highly relevant in manufacturing. If you want to know where all units of a gearbox, relay, motor, seal kit, or fastener family sit across central stores, maintenance stock, production support areas, and staged work, this kind of product distribution view answers the question visually. Instead of asking each department to check its own corner, the team can see the spread of stock on one map. This makes reallocation faster and reduces the risk of placing new orders while usable stock is sitting elsewhere on site.

Activity history that supports trust and accountability
CyberStockroom also includes activity history tied to inventory movement and change. Users can filter activity history by user, activity type, timespan, and location, and that the history works like a ledger of activity across the business. For stockroom control, that means you do not just see the current position of stock. You also have context around how it arrived there.
This is useful for more than audit work. In daily operations, activity history helps resolve disputes and recurring inaccuracies. If a count is wrong, if a department believes stock was moved without visibility, or if a staging area appears empty earlier than expected, activity history gives the inventory team a practical route to trace what happened. In a multi-department manufacturing environment, that kind of traceability is one of the main ways to rebuild trust in the record.
Why the CyberStockroom approach works in manufacturing
The reason CyberStockroom fits manufacturing stockrooms so well is that the platform treats layout and location tracking as the core of the inventory model rather than as an afterthought. It is designed for multi-location visibility, tracking inventory by department or team, organising stock visually, and supporting real-time awareness of where items are and how they move. That lines up directly with the operational problems discussed earlier in this article.
If your plant struggles with cross-department parts visibility, the answer is rarely “more lists.” It is usually better location structure, better visual context, and faster transfer discipline. CyberStockroom enables exactly that by making the map the central working environment. The result is a stockroom model in which location clarity, inventory visibility, stock organisation, and movement tracking reinforce each other instead of competing for attention.
The table below shows how the main CyberStockroom capabilities connect to common manufacturing stockroom problems.
| Operational problem | How CyberStockroom helps | Practical result |
| Parts spread across buildings or departments | Live map of locations and sub-locations | One visual view of the whole operation |
| Slow or missed location updates | Drag-and-drop transfers on the map | Faster recording of routine movements |
| Unclear where a specific part exists | Product distribution view across locations | Easier reallocation and item retrieval |
| Disputes about what changed | Filterable activity history | Better accountability and faster issue resolution |
| Unclear stockroom layout for new staff | Map mirrors the physical arrangement | Faster onboarding and fewer search errors |
Building the operating model and rollout plan
The safest way to introduce a inventory map is to treat it as an operating model project, not just a software setup. The early work is less about clicking through menus and more about deciding what the business is really trying to control. That means defining the scope in plain language, which spaces matter, which departments carry inventory, which temporary locations are real enough to map, and where accuracy matters most. Projects go wrong when they start broad and vague instead of narrow and specific.
A sensible first step is a physical walkdown of the plant. Do not start at the desk. Start on the floor. Identify every place where stock resides, even if it is only temporary or only active during specific jobs. CyberStockroom’s own map setup guidance follows this logic, asking teams to think about the physical places where inventory is stored and then define the map layout from that reality. In larger manufacturing operations this usually means more locations than people first expect, which is exactly why a digital inventory map is so useful.
The next step is location design. This is where you decide the hierarchy, the naming rules, the detail level, and the zones that will exist from day one. The strongest guidance here is simple: design locations to match the way people actually walk and use the site. If the structure feels alien to the operation, adoption will be weak. If it feels like a clear picture of the real floor, adoption becomes much easier.
After location design comes catalogue clean-up. This is the least glamorous stage and one of the most important. Duplicate items, obsolete parts, inconsistent units of issue, and vague descriptions weaken the map before it even launches. A practical clean-up pass should focus first on the errors that break daily execution, such as same-part-different-name duplicates, poor descriptions, and units that do not reflect how stock is actually issued or replenished.
The rollout itself should begin simply. CyberStockroom’s map-first implementation guidance is clear on this point: start with a map that is accurate and complete at the major-location level, train the team on core transactions, and then add sub-locations over time where extra precision pays off. That approach avoids long delays caused by chasing perfection in every drawer before the operation has gained any benefit from the map.
This “simple first” method is usually the right choice for manufacturing stockrooms. It lets the business secure early wins, such as visibility across buildings and departments, while deeper shelf-level precision is added selectively to high-risk zones. In other words, the map becomes useful fast, and then becomes more precise over time instead of waiting for a perfect launch that may never come.
A more detailed planning view is shown below.
| Phase | Typical focus | Key output |
| Scope and walkdown | Identify all stock-holding and stock-touching spaces | Confirmed list of real locations |
| Location design | Set hierarchy, naming rules, and zone logic | Clear address model for the site |
| Map build | Create the inventory map and major locations | Usable visual map |
| Data clean-up | Remove duplicates, align descriptions, verify units | Cleaner item catalogue |
| Initial counts | Reconcile physical stock with the new location model | Trusted opening balances |
| Pilot | Test receiving, put-away, transfer, issue, return, and count workflows | Process fixes before wider rollout |
| Go-live | Set the map as the working source of truth | Controlled launch |
| Stabilization | Review discrepancies, improve labels, add detail where needed | Higher trust and stronger adoption |
Pilot testing should focus on real workflows rather than feature curiosity. The team should test what it actually does in a week of normal work: receive, inspect, put away, issue, transfer, stage, return, and count. It should also test exceptions, because exceptions expose weak location logic quickly. Typical failure points include unknown items, stock found in the wrong zone, temporary overflow, and parts returned from jobs without a clear destination.
The handover into live use needs discipline as well. A common failure pattern in inventory projects is to let transactions continue in several places at once, such as the old spreadsheet, the old room-level label system, and the new mapped system. That creates competing truths. A stronger cutover defines a clear moment when the new map becomes the operational record, alongside a controlled freeze window, a final reconciliation step, and a day-one verification checklist of key items and locations.
Once live, the operating model needs maintenance. Location-based cycle counting should begin early. Layout changes should trigger map updates. Any new cupboard, bench stock point, project cage, or department store should be formally added rather than ignored. Continuous improvement matters because stockrooms are living environments. They change with product mix, line layout, staffing, and maintenance strategy. A inventory map stays valuable only if it stays current.
Actionable next steps and implementation checklist
If you want stronger parts visibility across departments, the best next move is not a major shelving purchase or another spreadsheet tidy-up. It is a location truth project. Walk the site, define the real inventory-bearing spaces, and turn those spaces into a inventory map that the whole business can see and use. Once the map exists, you can improve slotting, staging, counting, and governance with far more confidence.
A practical first month should focus on five outcomes. First, confirm the scope, which buildings, stockrooms, point-of-use areas, staging zones, and temporary stores matter. Second, design a clear location hierarchy that matches the physical site. Third, clean the worst item and location data problems. Fourth, build an initial map at major-location level. Fifth, pilot the core workflows with one department or one high-value area. This approach keeps the project grounded in real operations and creates momentum without waiting for a perfect end-state.
The longer-term aim is simple: a stockroom that anybody can navigate, a location structure that multiple departments can trust, and an inventory record that reflects the way materials actually move through the plant. That is the real promise behind the warehouse stockroom organization inventory mapapproach. It is not about making the stockroom look more digital. It is about making stock visible enough, organised enough, and traceable enough for the whole operation to work faster and with fewer surprises.
The checklist below is designed to be copied directly into an implementation working document.
| Implementation checkpoint | Why it matters | Status |
| All stock-holding and stock-touching spaces have been identified | Visibility fails when receiving, staging, line-side, or overflow areas stay off the map | ☐ |
| A clear location hierarchy is defined from building to bin or point of use | Prevents vague “back room” location language | ☐ |
| Location names match the language people use on the floor | Speeds adoption and reduces confusion | ☐ |
| Part descriptions have been cleaned for duplicates and ambiguity | Strong search and issue control depend on clean naming | ☐ |
| Units of issue match how stock is actually issued and counted | Prevents early balance drift | ☐ |
| Fast-moving and critical items have defined slotting rules | Reduces travel and search time | ☐ |
| Line-side and departmental stock points are mapped as real locations | Stops hidden inventory from growing outside central stores | ☐ |
| Kitting and staging areas are mapped and governed | Keeps planned work visible and ready | ☐ |
| Core workflows have been piloted end to end | Reveals weak points before wider rollout | ☐ |
| A cutover rule defines when the map becomes the operating record | Prevents competing sources of truth | ☐ |
| A location-based cycle count schedule is in place | Maintains trust after go-live | ☐ |
| Every layout change triggers a map review | Keeps the inventory map relevant over time | ☐ |
A concise next-steps plan for most manufacturing teams looks like this:
| Time horizon | Priority action | Expected result |
| This week | Walk the site and list every inventory location, including temporary ones | Clear project scope |
| This month | Build the first inventory map and label major locations | Shared location language |
| Next quarter | Add sub-locations where misplacement is expensive, then tighten cycle counting and transfer rules | Higher stock trust and better cross-team visibility |
A well-run stockroom does not rely on memory, habit, or heroic searching. It relies on a location model that makes the floor understandable to everyone who depends on it. Start with the inventory map, and the rest of your warehouse and stockroom organisation has something solid to stand on.


Leave a comment