Mapping Your Parts for Complete Visibility
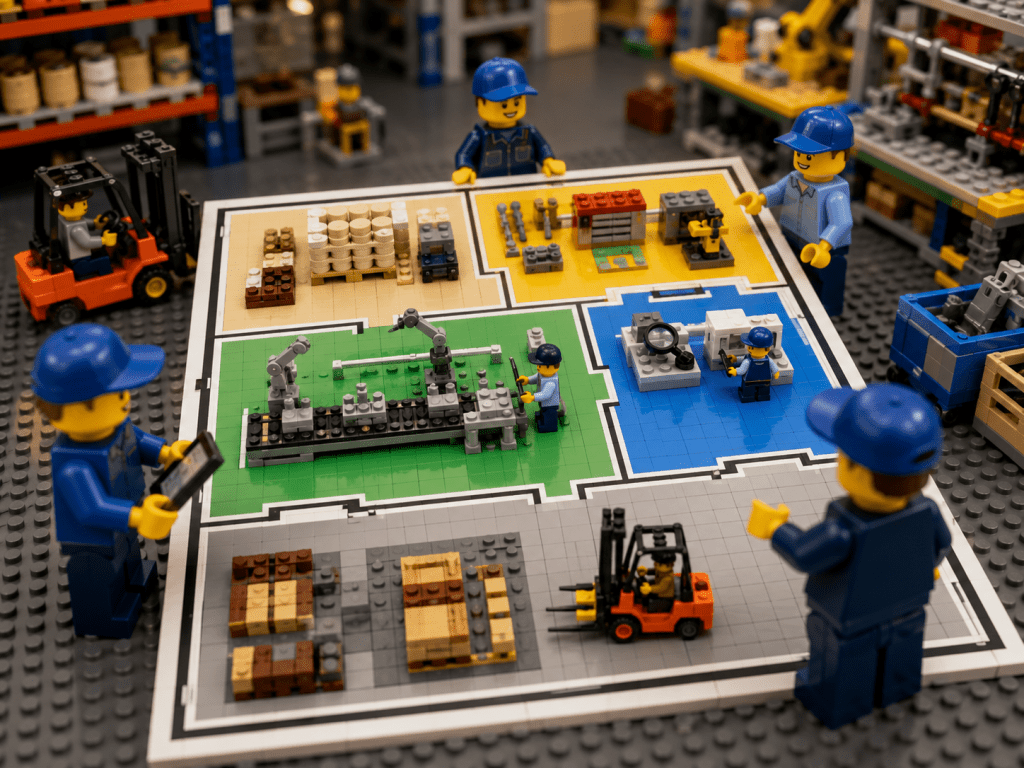
Inventory visibility is a critical challenge in manufacturing. A well-mapped inventory provides a detailed blueprint of where every part and material is stored — from raw stock to finished goods — so that everyone on the team always knows what we have and where it is. In a busy industrial plant or construction site, multiple departments depend on parts: maintenance crews need spare parts on the fly, procurement tracks incoming shipments, production lines require materials on schedule, and quality teams verify inspections and supplies. When each group uses a common, visual inventory map, you eliminate the guesswork that causes delays and frustration.
A live inventory map like the one above acts as a single source of truth. Rather than dozens of isolated spreadsheets or card-file cabinets, every stakeholder refers to this interactive layout. For example, an engineer needing a replacement bearing can look at the map to see it’s in Bin 1 of the Tool Crib.
A production manager about to start a build can confirm that all required components are available in the mapped storage areas. And a storekeeper can report real-time stock levels to finance or operations with confidence.
This guide explores what it takes to build and maintain a well-mapped manufacturing inventory. We’ll discuss the best practices that ensure parts visibility across every department, and share a practical example of how digital tools (like CyberStockroom) support these practices. Whether you manage a warehouse, a laydown yard, or a network of shops, the goal is the same: full parts visibility, tighter operations, and faster decision-making.
Why Inventory Mapping Matters
Manufacturing inventory is more complex than in many other industries. You’re tracking raw materials, semi-finished assemblies, spare parts, tools, and finished goods all at once. Without a clear visual map, common problems arise:
- Lost or Misplaced Items: Parts can “disappear” in a convoluted stockroom or between departments. Teams waste hours searching for a bolt or tool that’s actually sitting on the wrong shelf.
- Inaccurate Stock Levels: Manual systems and paperwork lead to errors. One department might think there are 100 bolts in stock while another system shows only 50, causing surprise shortages or excess ordering.
- Workflow Bottlenecks: If a critical component isn’t where production expects, an assembly line grinds to a halt. Missing parts at the wrong time trigger expensive downtime.
- Hidden Costs: Excess inventory ties up cash and space. Urgent rush orders or emergency shipments to cover a missing part spike costs.
A visual inventory map tackles these issues head-on. By creating a digital map or “floor plan” of your entire operation, you gain immediate visibility into stock locations. Each zone and bin on the map corresponds to a real place in your warehouse or plant. Instead of mental notes or memory, teams see a living diagram of inventory. This enhances efficiency and accuracy:
- Improved Navigation: Workers can navigate the facility quickly when they know exactly which aisle or room contains an item. No more aisle-by-aisle hunting.
- Better Collaboration: Clear maps foster communication. When everyone sees the information real-time, it’s easy to discuss issues.
- Efficient Space Use: A map reveals underused space. You might reorganize shelving, consolidate half-empty racks, or clear paths that were cluttered.
- Proactive Management: Visual cues (like color-coding low-stock bins) let you spot shortages before they happen. Teams can address potential stockouts or quality issues immediately.
By shifting from static records to interactive maps, a well-mapped inventory turns raw data into actionable insights. Every item’s location and quantity is recorded and refreshed, so you always see the true state of your inventory at a glance.
Key Elements of a Well-Mapped Inventory

Building a robust inventory map involves several core components. Think of it like creating a detailed blueprint of your storage and process flow:
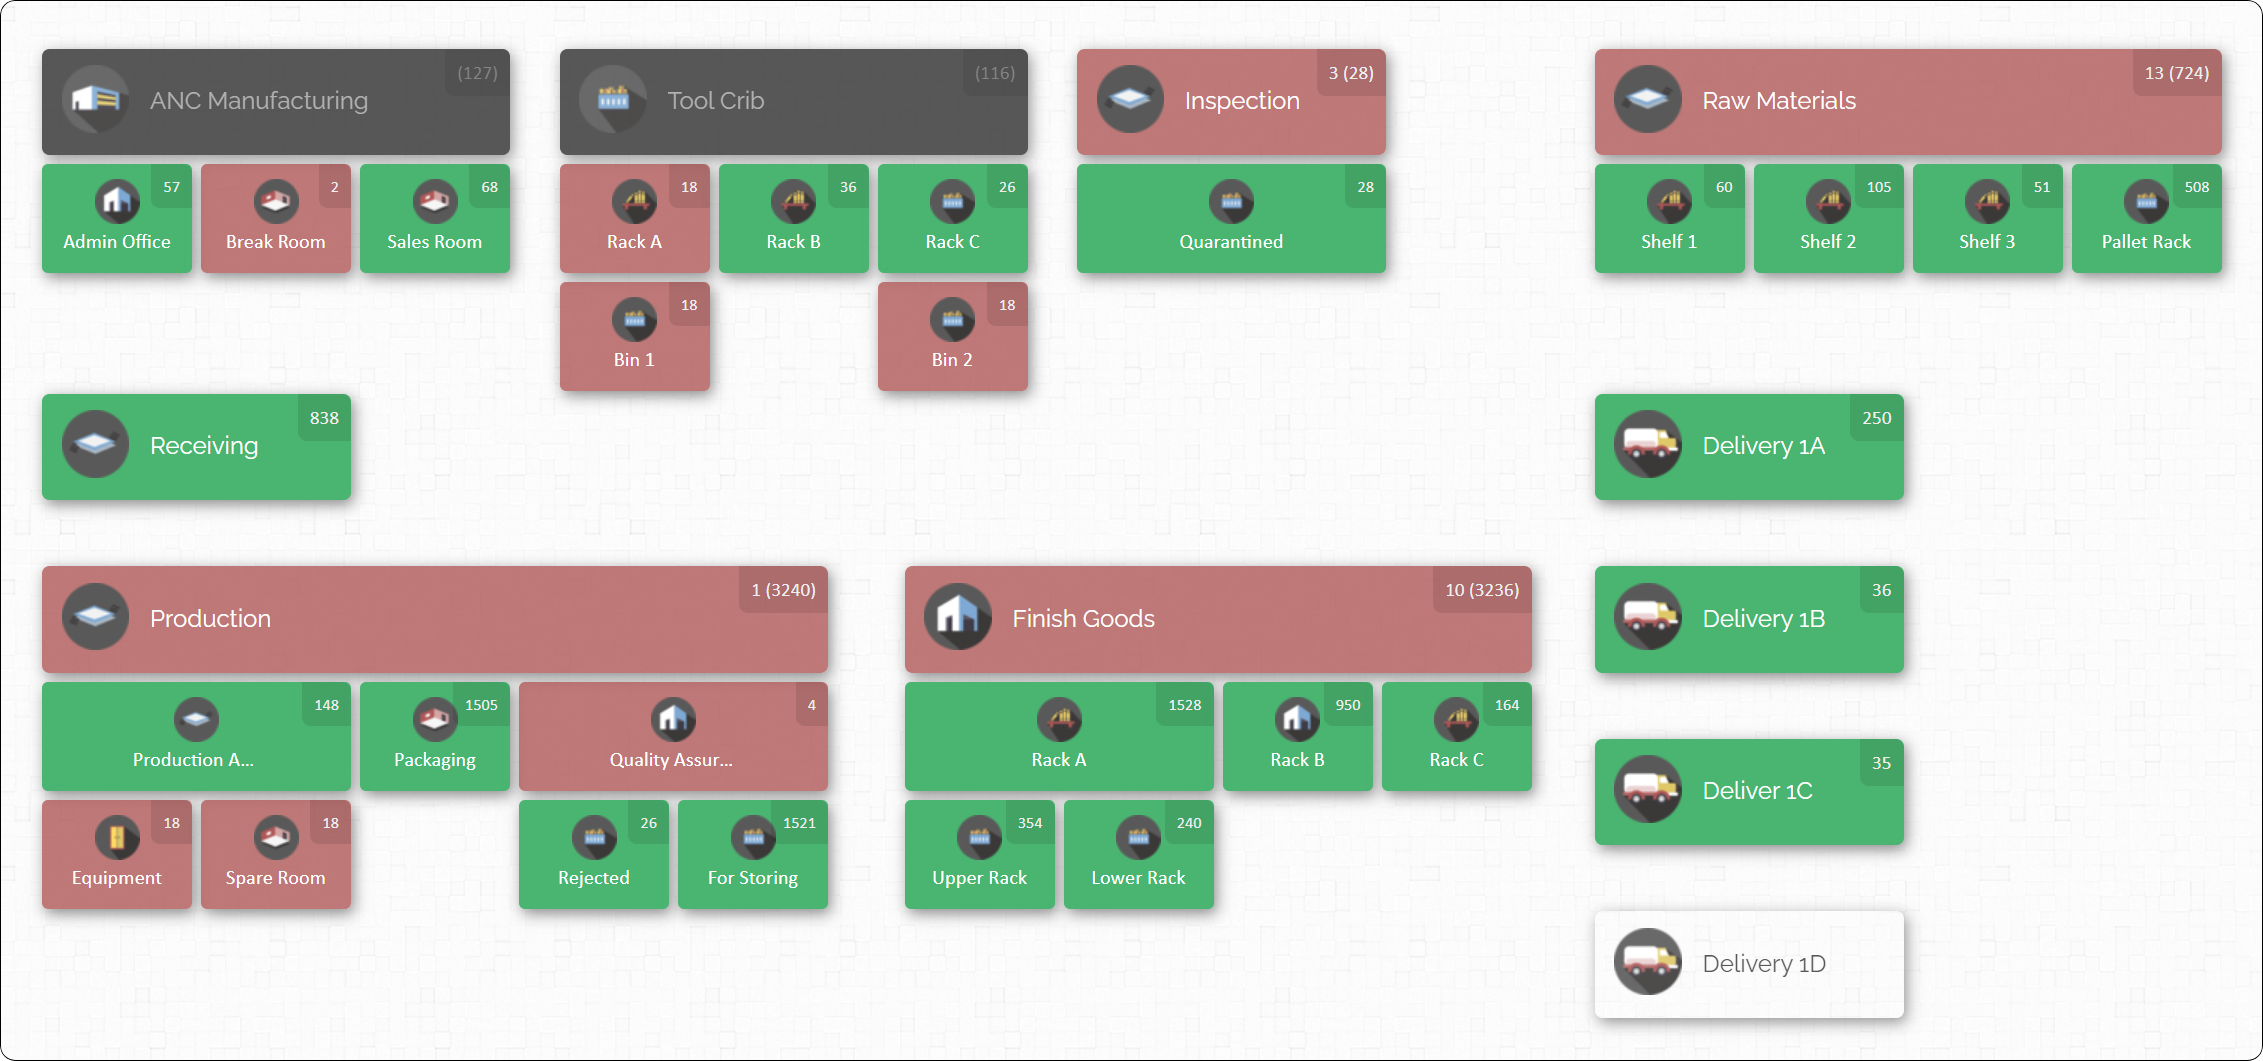
- Defined Zones and Locations: First, break your facility into major areas (zones) by function. In manufacturing these might include Raw Materials Storage, Tool Crib, Assembly Line 1, Quality Inspection, Finished Goods Warehouse, etc. On a map, each zone is labeled.
- Sublocations (Bins, Shelves, Racks): Within each zone, define specific storage spots. For example, the Tool Crib zone might have shelves numbered 1–5, each shelf having bins A, B, C. Each bin or rack gets a unique identifier. This hierarchy (zone → shelf → bin) allows you to pinpoint parts very precisely.
- Consistent Naming and Labels: Every zone and bin should have a clear name or code. For instance, “PROD-A2” might be Aisle 2 of the Production floor, and “RM-S3” might be Shelf 3 in Raw Materials. Standardize the format (like ZONE-SHELF-BIN) so anyone can read a location code. Physically label these locations with signs or barcodes that match the digital map.
- Current Inventory Quantities: The map is most useful when it shows not just where parts are, but how many. Each location or bin on the map can display current stock levels. So when you look at Shelf 2 of Raw Materials, you immediately see it holds 60 units of Steel Rods. This real-time quantity is updated by your inventory system.
- Item Details and Attachments: A sophisticated system allows you to click on any location and view the list of parts stored there, along with details like part number, description, pictures, or safety data. Attaching photos or data sheets to items (for example, an image of a critical spare part) adds context and helps training new staff.
Combined, these elements turn your inventory data into an easy-to-read visual representation. You can zoom out for a bird’s-eye view of the whole plant or zoom in on a specific bin for fine detail. The result is an “interactive blueprint” of your inventory that answers “What do we have, where is it, and how many?” at a glance.
Best Practices for Cross-Department Parts Visibility

Achieving true visibility across all teams takes not just mapping, but also disciplined processes. These best practices help ensure your inventory map stays accurate and useful:
1. Centralize Inventory Data in One System
Use a single inventory management system (IMS) or warehouse management system (WMS) that covers all departments. This single source of truth approach means everyone from stores to production to procurement is updating and reading the same database.
- Eliminate Spreadsheets Silos: Relying on multiple spreadsheets or disconnected records leads to discrepancies. Instead, record every receipt, issue, and transfer in one platform.
- Cloud-Based Access: A cloud-based IMS lets any department access real-time data. For example, a maintenance engineer can log in remotely to check part availability before leaving the shop, knowing the stock counts are up-to-the-minute.
- Consistent Updates: When any team performs a transaction (receiving goods, moving parts to production, scrapping a broken tool), they immediately update the system. This instant update ensures the map and stock levels reflect reality.
When all locations and departments feed into the same system, blind spots vanish. One warehouse no longer hoards stock while another runs out, because the system shows both stock levels simultaneously. Cross-team decisions (e.g. “We have surplus bolts here, let’s push them to the site that’s low on bolts”) become easy when everyone works from one view.
2. Standardize Labeling and Procedures
Chaos in labeling and process leads to confusion. To maintain visibility, standardize how you identify inventory and handle it:
- Unique Part Identifiers: Every item should have a unique SKU or part number. Attach a barcode or QR code label to each part whenever possible. This ensures each physical item corresponds to one entry in the system.
- Clearly Marked Locations: Label every shelf, rack, bin, and room with an ID (such as “A3-B2” for Aisle 3, Bin 2). This should match the map. Use durable labels so they remain legible in industrial conditions.
- Standard Operating Procedures (SOPs): Define and train on uniform processes for all inventory transactions. For example:
- Receiving: When goods arrive, they are checked against the purchase order, scanned into the system, and placed only into the location shown on the map.
- Moving/Issuing: Any time an item is picked or moved, staff should scan the item’s code and the destination location’s code. The system then automatically records the change of location.
- Returning Items: Return unused parts to the exact spot on the map where they belong. If items are returned to a different spot, record that move.
- Avoid Ad-Hoc Storage: Discourage “parking” parts in random spots. If temporary storage is needed, mark it clearly on the map (e.g. “Overflow Area”). This keeps every item traceable.
The goal of standardization is that inventory never “falls off the radar.” For instance, if one department borrows a tool from another, the transfer is scanned and updated, so the owner knows exactly where it went. Consistency also makes audits and training easier: new staff learn one method for every area, and you can quickly spot where procedures aren’t followed by analyzing map data for gaps.
3. Implement Real-Time Tracking with Scanning
Inventory accuracy depends on timely updates. Implement a scanning system for real-time tracking of parts movements. Barcode scanners allow you to capture transactions instantly:
- Scan Every Transaction: At receiving docks, production areas, or tool cribs, use scanners to log items in and out. For example, when a batch of bearings is received, the warehouse clerk scans the barcode on each pallet and the code of the receiving bay location. When a production operator takes bearings to use on the line, they scan the bearings and the destination location on the assembly floor map.
- Quick-Scan Tools: Use features like “Quick Scan” (available in some systems) to batch process many items rapidly. This is useful for consolidating stock moves or doing fast cycle counts.
- Location Scanning: Don’t just scan items—scan locations too. By scanning the code of each rack or bin, the system knows exactly where you are placing or taking from. This keeps the digital map aligned with reality.
- Eliminate Hand Counting: Scanning replaces manual entry. It reduces human error and saves time. In a large plant, it’s far quicker to scan 100 barcodes than to write them down or type them later.
For example, if each screwdriver drawn from the tool crib is scanned by maintenance staff, the system instantly shows the tool’s new location (a workbench or vehicle) or that it’s in use. This continuous feed of data means that the map’s stock counts are always “true”. When everyone knows that scanning is required for every move, missing parts and stockouts become far less likely.
4. Conduct Regular Cycle Counts and Audits
Even with excellent tracking, some discrepancies may creep in over time. Plan routine audits to catch and correct these errors before they grow. Cycle counting is the recommended approach for manufacturing inventory:
- Cycle Counting: Instead of shutting down for one big annual inventory count, count subsets of inventory on a rolling schedule. For instance, each month count all items in the tool crib and one aisle of raw materials. Over time you’ll cover everything regularly.
- Focus on Critical Items: Use an ABC approach – count the most critical or fast-moving parts most frequently (weekly or monthly), and less critical ones less often. This ensures accuracy where it matters most.
- Use the Map: A mapped inventory makes cycle counts systematic. Auditors can work down the map zone-by-zone, scanning each location and verifying counts. The digital map can even highlight which locations need counting, guiding the team through the process.
- Investigate Variances: When a count doesn’t match the system, investigate immediately. Was a transaction missed? Is a part wrongly categorized? Resolving these prevents the same error from repeating.
Regular audits keep your “digital twin” of inventory in sync with the physical reality. Accurate data is essential — a beautifully mapped inventory is useless if the numbers behind it are wrong. By routinely reconciling and correcting stock records, you build confidence in your system, which in turn supports sharp decision-making (e.g. knowing when to reorder or when production can proceed).
5. Leverage Visual Dashboards and Maps
Humans are visual creatures. It’s much easier for teams to understand inventory status when they see a picture instead of poring over spreadsheets. Employ visual dashboards and interactive maps wherever possible:
- Map-Based Dashboards: Use software that displays your inventory map on screen, with live indicators. For example, a dashboard could color-code zones by stock level. Clicking on a zone or shelf in the map brings up the list of parts there with quantities.
- Charts and Graphs: Alongside the map, include key metrics: inventory accuracy over time, fill rates, or parts on order. Trends on a graph can alert managers to recurring issues (e.g. a certain component frequently hitting “red” stock levels).
- Mobile or Remote Access: Make these dashboards available on devices such as tablets or shop-floor terminals. A supervisor on the floor can glance at a tablet to see if the incoming shipment of fasteners has been logged and put away. A procurement planner at headquarters can view overall stock levels across all plants.
Visualization bridges the gap between data and action. One glance at the dashboard might show, for example, that Bin C5 is nearly empty of a needed component, prompting a quick reorder. Instead of interpreting rows of numbers, teams can literally see where inventory sits in the layout, speeding up decision-making.
6. Foster Cross-Department Collaboration
A map is only as good as the collaboration behind it. Full parts visibility means getting all departments aligned:
- Shared Access: Ensure every relevant group uses the same inventory system. Stores, production, procurement, maintenance, even quality control and finance should be able to view (and where appropriate, update) the map. This breaks down silos where one department “owns” its data.
- Defined Roles and Alerts: Assign clear ownership and notification paths. For example, if a technician reports a missing part, the maintenance manager and warehouse manager might both be alerted. Or if stores runs a physical count, they coordinate with production planning to minimize disruption.
- Regular Review Meetings: Hold weekly or monthly inventory reviews across teams. Use the shared map as a meeting aid: walk through the map to discuss anomalies. These meetings keep everyone aware of stock issues (excesses or shortages) and ensure the map accurately reflects the plant’s needs.
- Training and Culture: Train all staff on the importance of accurate data entry and using the map. Encourage a culture where anyone who spots an error or inefficiency in the map speaks up. Cross-training workers on multiple areas also helps: a team member from one department may notice and correct a map mistake in another area before it causes trouble.
In essence, make inventory visibility a collaborative priority. When all stakeholders trust and rely on the inventory map, they are invested in keeping it accurate. Shared visibility turns inventory management from a turf battle into a cooperative effort, aligning goals like reduced waste, higher uptime, and on-time deliveries.
Building Your Inventory Map – Step by Step

Creating a well-mapped inventory is a project, but it can be approached in clear stages. Here’s a practical implementation guide:
- Survey Your Facility. Start by walking through the plant or yard and sketching the physical layout. Note major areas and storage units. Involve department leads: ask production, maintenance, quality, and stores to point out how they currently use space.
- Define Zones. On your sketch, draw boundaries around functional zones: raw material warehouse, assembly lines, tooling area, inspection zone, finished goods staging, etc. If you have multiple buildings or outdoor lots, include them too (label each warehouse or yard separately).
- Plan Sub-Locations. Within each zone, break down storage spots: shelves, racks, bins, cabinets, carts, even vehicles (e.g. service trucks or vans used on site can be mapped as “mobile locations”). Decide on a naming scheme – for example, “WH1-A3-B2” might mean Warehouse 1, Aisle 3, Bin 2. Assign location codes to every spot.
- Example: In the Tool Crib, you might number Tool Racks 1–4. Each rack has drawers labeled A–D. So one bin label could be “TC-Rack2-D”.
- Digitize the Map. Using inventory mapping software (or even a well-structured spreadsheet if needed), create a digital version of the zones and sub-locations. Make it match reality as closely as possible.
- Assign Inventory to Locations. Populate the map with what’s currently in stock. This can be done by:
- Spreadsheet Import: Export data from any existing system (ERP or store records) into a CSV. Format it as (Item, Quantity, LocationCode) and import to your new map system.
- Barcode Scan: For high-value or large-quantity parts, perform a scanning-driven put-away. Scan an item’s barcode and then scan its location label. The system moves that quantity onto the map at that spot.
- Label Everything Clearly. Print and attach labels or signs for each location according to your chosen codes. Also label items or shelves with barcodes as needed. Physically verify that each digital location on the map corresponds to its real-world label – this cross-check avoids confusion.
- Establish Workflows. Update your SOPs to integrate the new map:
- Receiving now includes scanning items to assigned locations on the digital map.
- Picking for production involves scanning items out of their locations.
- Transfers between departments involve choosing the “from” and “to” locations on the map.
- Define how cycle counts will be conducted using the map as the guide.
- Train Your Team. Show each department how to use the map system:
- Conduct a demo of finding an item on the map, scanning it, and moving it.
- Emphasize consistent labeling and scanning discipline.
- Provide quick reference guides (for example, “Receiving Walkthrough: Scanning Steps”).
- Monitor and Refine. In the first weeks, gather feedback. Are any areas missing from the map? Are team members avoiding updates because the process is cumbersome? Use this feedback to adjust zone definitions, streamline scans (e.g., consolidate two adjacent small bins), or add shortcuts.
- Scale as Needed. If you have multiple plants or off-site yards, repeat the process to create maps for each. A unified system can often link them, so a manager can click between Plant A’s and Plant B’s maps.
By following these steps, you’ll gradually build a comprehensive inventory map. Remember, a map is never truly “finished” – it should evolve as operations change. But once in place, it becomes an indispensable reference for all teams.
CyberStockroom: Unifying Inventory Visibility Across Teams
Implementing the above best practices is much easier with a purpose-built system. CyberStockroom is an example of a cloud-based inventory management platform designed around mapping and visibility. While the underlying practices are universal, CyberStockroom provides features that directly address each inventory challenge:
- Visual Mapping Interface: CyberStockroom lets you create a 2D digital twin of your facility, define zones, sub-locations, rooms, vehicles—virtually any place you store parts. For instance, you can map your main warehouse, each production floor, a maintenance tool crib, a laydown yard, and even a supply truck as separate locations on the map. The map view is fully customizable to match your actual layout and process flow.
- Centralized, Cloud-Based Data: All inventory data is stored in the cloud. This means no matter which department logs in (stores, production, procurement, etc.), they see the same live information. If a storekeeper in one building updates a stock count, a production planner anywhere can instantly see it. Cloud access also means managers can check inventory from any device with internet – whether in the office or on a mobile device on the shop floor.

- Integrated Scanning and Labels: Every part and location in CyberStockroom can have a barcode. Staff can use standard barcode scanners update inventory.
- Drag-and-Drop Movements: Beyond scanning, CyberStockroom offers a user‑friendly interface where you can also move inventory using a mouse or touch. In the map view, you can drag and drop items from one location to another, and CyberStockroom records the transfer. This feature is handy for occasional large adjustments or when scanners aren’t available, though typically each move is backed by a scan for accuracy.
- Quick Count and Audit Tools: The platform includes features for fast cycle counting. You can select a map zone and CyberStockroom will list all items stored there. As counters verify stock, they update quantities directly in the interface.
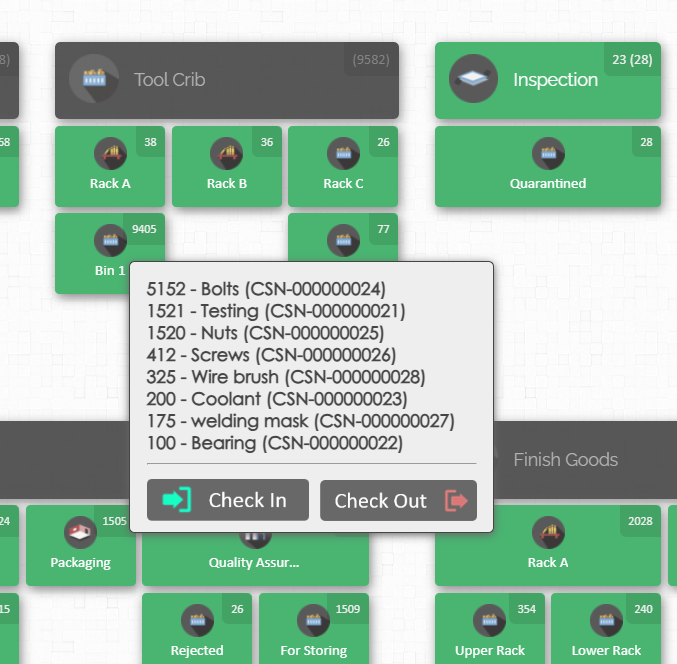
- X-Ray / Distribution Views: If you need to see where a particular part is located, CyberStockroom provides an “x-ray” or distribution view. Select any inventory item and the system highlights every location that holds it (across all mapped areas). This instantly tells you, for example, that all 250 screws of a certain type are spread over 3 bins, and it shows exactly which ones. It’s a quick way to verify whether you truly have enough of a part on hand and where they all are.
- Reporting and Analytics: Built-in reporting tools let you track inventory accuracy, turnover, or fill rates. You can see a log of all transactions by date, user, and location, which is useful for audits and understanding usage patterns. These reports can often be filtered by department or location, aiding in cross-team accountability.
- User Access Controls: Multiple users from different departments can use the same system, with roles controlling what each can do. For example, production supervisors might have access to view and pick parts, while only stores personnel can edit stock on hand. However, everyone sees the same map layout and data, ensuring all departments are literally on the same page.

In practice, using CyberStockroom feels like building a shared puzzle of your inventory. For instance, the stores team would map the warehouse layout and input initial stock. When purchasing brings in a new delivery, they scan it into the mapped location. Engineers or assembly workers then pick parts by scanning them out at their production area, immediately updating the map. Maintenance planners can look at the inventory map and know if the spare parts cabinet has what it needs, or whether to move parts from a less-critical storage bin.
All these activities happen in one system with a unified map, greatly improving collaboration. Because the map shows everything, one click can show the combined stock of an item across departments. This resolves the classic “one department has it, another runs out” scenario. CyberStockroom essentially embeds the best practices above into its workflow.
Practical Example: Building a Mapped Inventory Layout
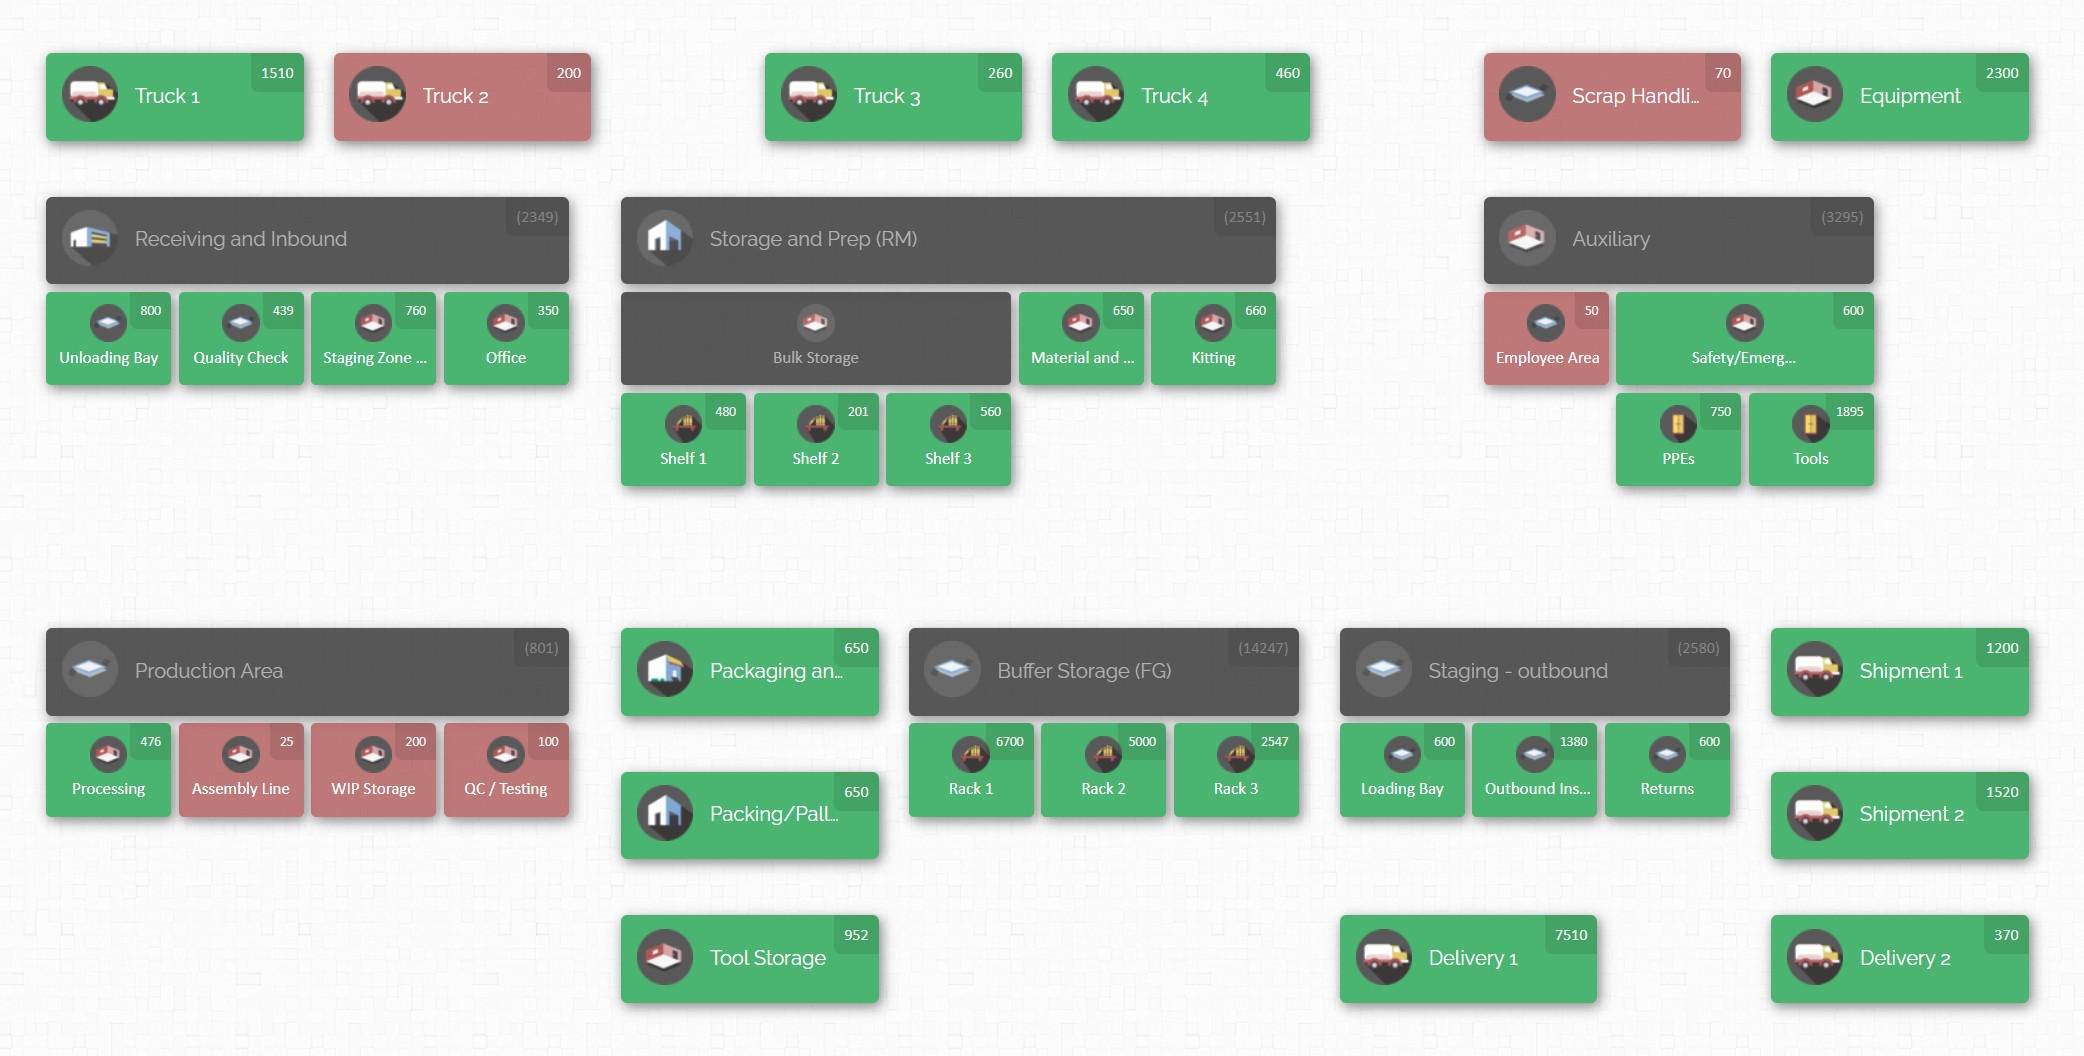
To illustrate these concepts, imagine a mid-sized factory with these areas: a Raw Materials Warehouse, a Tool Crib, two Production Lines (A and B), a Quality Inspection room, and a Finished Goods area. Here’s a simplified example of setting up a map and inventory:
- Zones: On the CyberStockroom map, create 5 main zones: “Warehouse (RM)”, “Tool Crib”, “Prod Line A”, “Prod Line B”, “Quality”, and “Finished Goods”. If the factory has two buildings, label them with a prefix (e.g. “Plant1 – Warehouse”).
- Sublocations: In “Warehouse (RM)”, draw aisles and racks. Suppose Aisle 1 has shelves S1–S3; Aisle 2 has S1–S3, etc. Label each shelf and bin. For example, shelf S1 in aisle 1 is “RM-A1-S1”. In the Tool Crib, maybe there are cabinets C1–C5 with drawers D1–D4. So a drawer code could be “TC-C3-D2” (Tool Crib, Cabinet 3, Drawer 2).
- Populate Inventory: Perhaps from existing records you know there are 120 steel bolts on Rack 1. Use the map to input that quantity into “RM-A1-S1”. If you have barcode labels on those racks, you could scan the bolt barcode and then scan the rack’s label to assign stock.
- Define Critical Items: Mark items like safety equipment, fasteners, or expensive components as high-priority in the system (for more frequent counts or alerts).
- Routine Use: Operators on Line A need a motor. They log into CyberStockroom’s map on the line computer, see two motors in “Warehouse – Shelf S3”, scan one out, and take it. They scan the motor’s code and the location code as they pick it. Instantly, the map shows 1 motor less in that location.
- Cycle Count Example: Once a week, the stores team opens CyberStockroom’s cycle count feature for the Tool Crib. The software lists all drawers (C1-D1, C1-D2, etc.). A team member scans each drawer label, then counts and updates the quantity of each item via the interface. Any discrepancy pops up in real time for immediate check.
This concrete example shows how a mapped approach unifies daily tasks. Everyone knows where to go by looking at the map, and every pick or put-away is recorded. Over time, the factory runs smoother: fewer emergency requisitions, less time lost searching, and inventory records that truly match the racks.
Conclusion
A well-mapped manufacturing inventory is one where every part’s location and quantity is clear to the whole organization. This requires thoughtful organization, disciplined processes, and the right tools. By centralizing your data, standardizing labels and procedures, using real-time scanning, and visualizing inventory on an interactive map, you unlock major benefits: higher accuracy, faster fulfillment, fewer delays, and better coordination across departments.
Tools like CyberStockroom put these best practices into action by providing a visual, map-based system that every team can use. With a map-driven platform, you turn your warehouse or plant into a transparent, cohesive operation. Building and refining your inventory map will take an upfront investment of time, but the payoff is enormous. Staff will spend less time searching for parts, finance can trust the stock reports, and production can meet schedules without surprises.
In summary, think of inventory mapping as creating a shared language for your parts. Once everyone — from the shop floor to the boardroom — is speaking that language via the map, your manufacturing operations will be more efficient, responsive, and aligned. Start by drawing your first map, label your first bin, and watch clarity spread across the plant. A well-mapped inventory isn’t just a guide; it’s a competitive advantage that keeps your teams productive and your customers happy.


Leave a comment