
In warehouse operations, and especially in manufacturing environments, inventory performance is rarely decided by the spreadsheet, the purchasing report, or the ERP screen alone. It is decided on the floor, in the moments when someone needs to find the right part quickly, confirm whether it is really there, and move it without creating confusion for the next department.
Inventory visibility is not a cosmetic improvement. It directly affects order fulfilment, production schedules, financial performance, stock levels, and the risk of line stoppages when the system says a part exists but the floor cannot produce it.
That is why a serious visual inventory vs list based system warehouse comparison has to focus on warehouse execution rather than on record keeping alone. A list-based system can tell you that ten items exist somewhere in the business. A visual inventory system is built to show where they are, how they are distributed, whether they are in the right place, and what the surrounding context looks like. That difference matters because warehouse work is physical, spatial, and time-sensitive. University research on warehouse operations shows that order picking is one of the costliest warehouse activities, and a large share of that effort is consumed by travelling and searching rather than by the actual act of taking the item.
Human beings also tend to remember pictures and stable visual layouts better than words alone. In interface design research, the picture-superiority effect and spatial memory both explain why people relocate information more easily when it is tied to visual boundaries and a stable arrangement. In warehouse terms, a map that mirrors buildings, rooms, aisles, racks, shelves, staging zones, and stockrooms is closer to how people actually think and work than a flat list of SKUs and bins.
This is the central case for visual inventory. It is not about making software look nicer. It is about reducing wasted motion, exposing abnormalities sooner, improving inventory accuracy, and giving multiple departments a shared operational picture of where parts live and how they move. Lean guidance on visual management and 5S makes the same point from a process angle: visual cues and standardised organisation reduce waste, help teams see normal versus abnormal conditions quickly, and support more consistent operational results.
For manufacturers, the stakes are even higher. Parts are not only stored in one tidy warehouse. They are often spread across receiving, raw material areas, maintenance stores, line-side locations, tool cribs, quality hold zones, project rooms, and dispatch areas. When each area has its own partial view, visibility collapses into hand-offs, assumptions, phone calls, and emergency purchases. When one shared visual layer sits across those locations, the business moves from searching to seeing.
The Visual Inventory vs List-based System Warehouse Comparison That Matters

List-based System
A list-based inventory model starts from records. It usually presents stock as item names, codes, quantities, locations, and transaction rows. That structure is useful for accounting, reporting, audits, purchasing, and exports. Warehouses have long relied on lists in the form of stock tables, spreadsheets, paper records, and pick lists. In fact, warehouse science texts describe how customer orders become pick lists that direct people through the warehouse. The weakness is not that lists are wrong. The weakness is that lists are detached from the physical picture of the operation.
That detachment becomes expensive on the floor. If an operator, storeperson, planner, or technician has to translate a line of text into a physical journey every time they need a part, the system is making the user do extra work. The more buildings, departments, and sub-locations you add, the more translation is required. A part might be “in stock” on paper, but a list does not instantly tell a person whether it is in the central stockroom, the line-side cabinet, a maintenance cage, a quality hold bay, or a project staging area. When visibility is poor, businesses hold unnecessary reserves, place avoidable orders, and expose production to shortages and idle labour.
Visual Inventory System
A visual inventory model starts from place. It treats location as a first-class operational fact rather than as a secondary text field. A visual map that represents the layout of the business, breaks it into locations and sub-locations, allows users to view the contents of any location, and shows product quantities at a glance. It also offers a product distribution view so teams can scan or select a product and see where it is spread across the operation. In practical terms, that means the warehouse interface reflects the warehouse itself.
This matters because much of warehouse waste is spatial waste. Order picking is usually a major share of warehouse operating cost, and within order picking, travelling and searching account for a large proportion of effort. Also, storage assignment, slotting, zoning, and layout all matter because they directly affect travel time, congestion, and picking delays. If travel and search dominate execution, then any system that makes location easier to understand has a direct path to better performance.
The comparison is also cognitive. A flat list forces people to read, decode, and mentally reconstruct space. A visual layout gives them the space directly. People remember pictures better than words and relocate information more effectively when it is tied to stable boundaries and consistent positioning. In a busy warehouse, that means less mental friction when staff need to answer questions such as:
- Where is the backup motor?
- Which shelf holds the left-hand bearing?
- Are all the line-side fasteners in one area or spread across three departments?
There is another difference that matters in real operations: list-based systems often hide wrongness until someone is already in trouble. A list can show the right quantity while the part is stored in the wrong place. That is why inventory record accuracy and location accuracy are not the same thing. Reliable warehouses need both the quantity to be right and the physical placement to be right. A visual system makes wrong placement more obvious because the user sees the expected location context along with the stock itself.
This does not mean lists should disappear. Lists still have a role in cycle count reports, part master work, procurement reviews, exporting data, and financial controls. But for warehouse execution, especially in a manufacturing setting with shared responsibility across departments, a list should be a supporting view rather than the main interface. The main interface should help people answer the operational question first:
“where is the part right now, and what is happening around it?”
That is why the phrase “seeing versus searching” captures the issue so well. Searching is what people do when the system tells them something exists but leaves the physical problem to them. Seeing is what people do when the system shows the operation in a way that matches the work. In any sensible visual inventory vs list based system warehouse comparison, that distinction is the one that affects labour, speed, and confidence every day.
Why List-based Visibility Breaks Down Across Departments

Manufacturing sites rarely fail because they lack a parts list. They fail because no single view reflects how parts actually move through the business. A component may be received by one team, checked into a stockroom by another, issued to production by a third, moved to a temporary hold area by quality, then borrowed by maintenance during a breakdown. The part still exists, but its operational truth changes every time it moves.
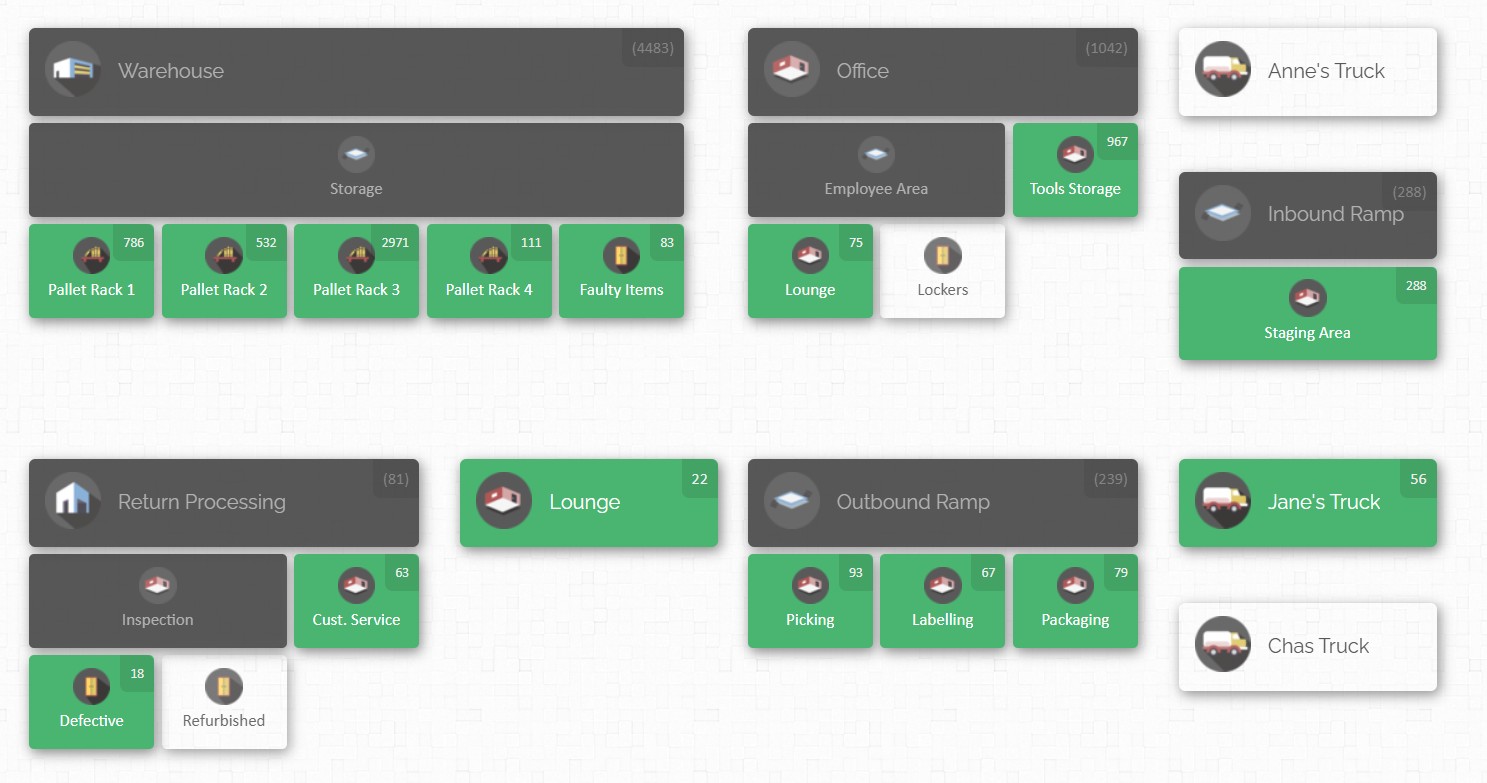
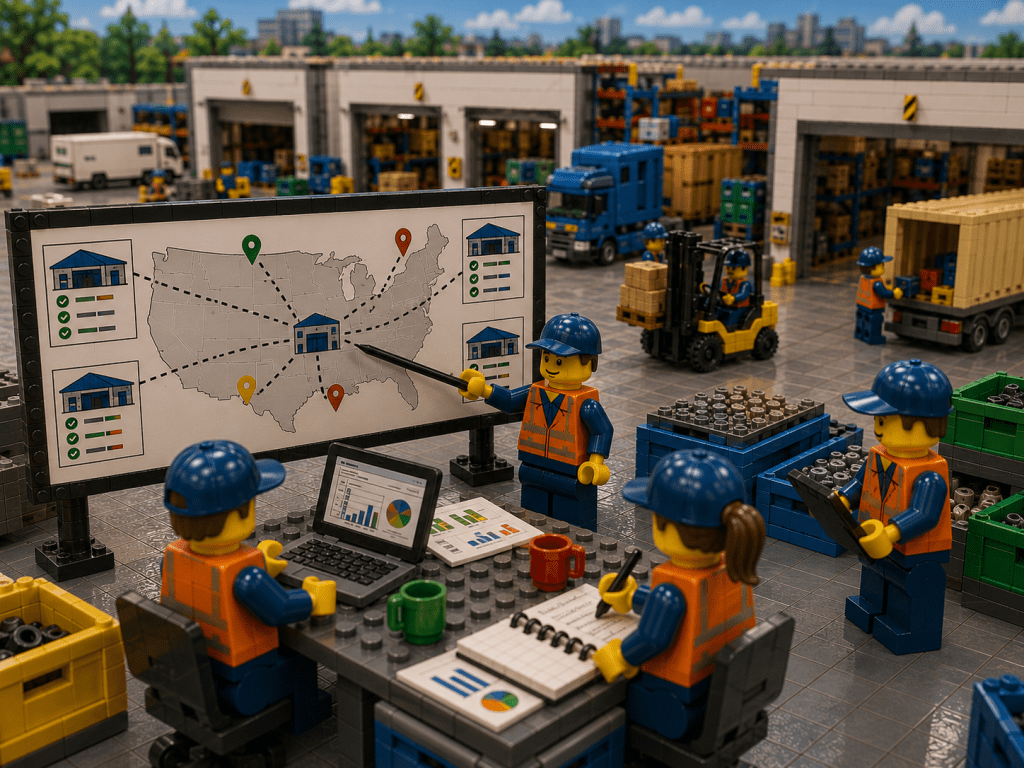
The first breakdown in list-based environments is structural. Departments organise stock according to local needs, but the system often reports it through a generic location code structure that makes sense to administrators more than to the people on the floor. A warehouse map, by contrast, can mirror the business as users see it, down to locations and sub-locations. With visual inventory system, businesses can break operations into any number of locations and sub-locations, rearrange and scale the layout to match how they see the business, and view each location’s contents directly on the map. When the interface matches reality, conversations across departments become clearer.
The second breakdown is transactional. When stock movements are frequent and the system is awkward to update, people postpone updates. That creates lag between the floor and the record. Academic work on inventory record inaccuracy shows that warehouse systems are dynamic interactions among people, processes, and information systems, and that inaccuracy harms picking productivity, drives lost sales, and contributes to inventory build-up that limits warehouse capacity. In plain terms, if your transaction discipline is weak, the business pays twice: once in uncertainty and again in cost.
The third breakdown is data quality. Spare parts environments often suffer from inconsistent naming, duplicate entries, and missing details. Also, spreadsheet and paper-based tracking led to errors, stockouts, missed opportunities, and poor synchronisation with demand. List-based systems are especially vulnerable here because duplicate or vague records remain hidden in text until someone tries to execute against them. A maintenance team may look for a part under a supplier name, while procurement knows it by a manufacturer code and stores know it by an internal stock number. Without shared categorisation, visibility is fragmented before any part is moved.
The fourth breakdown occurs when quantity and placement drift apart. A system may show ten units on hand while none are in the assigned location. In manufacturing, both inventory record accuracy and location accuracy matter constantly. The first measures whether the quantity in the system matches the physical count, the second measures whether items are stored where they are supposed to be.
For example, a line‑side rack can be empty while the warehouse still shows stock in the building. A useful system must make both conditions visible.
The fifth breakdown is operational timing. Poor inventory visibility affects production schedules and can increase the risk of line stoppages and idle labour. In a manufacturing plant, delays usually do not begin when stock is depleted completely. They begin when people can no longer trust the answer to “Where is it?” If that answer requires calls, escorts, memory, or a walk-around, the system has stopped serving the pace of the operation.
The sixth breakdown is organizational. People need to know what good looks like, what the standard is, and whether it is being maintained. A list can document a standard, but it is weaker at making the standard visible in context. In cross-functional environments, that matters because one department’s workaround quickly becomes another department’s problem. A parts cage that is “temporarily” used for overflow, a shelf that becomes mixed stock, or a quality hold zone that is not clearly distinguished from available stock can all look acceptable in a list while producing confusion in reality.
The seventh breakdown is space itself. Storage assignment and slotting research consistently shows that where items are stored affects travel time, congestion, and efficiency. Advanced storage assignment studies find that grouping related SKUs and placing highly demanded clusters in more accessible positions can reduce total picking time, although good design must also account for congestion. In other words, visibility is not only about finding what exists. It is about arranging the operation so that the flow of work makes sense. A list can record the result of that design, but it cannot show the logic of the design nearly as well as a visual map.
When departments rely on a list-only view, they tend to create local intelligence instead of shared intelligence. One shift knows where overflow stock is hidden. One technician knows which cabinet actually holds the backup seals. One storeperson remembers that a code labelled “Receiving Overflow B” now functions as a maintenance spare shelf. That is not visibility. That is dependency on memory. A visual inventory system replaces those private mental maps with a common operational picture. That is why it scales better across multiple departments, buildings, and teams.
Best practices for Improving Parts Visibility in Manufacturing

The strongest parts visibility programmes do not begin with software alone. They begin with operational design.
- Build one shared location hierarchy that mirrors the physical world. That means naming and structuring locations the way employees actually navigate them: building, room, zone, rack, shelf, bin, line-side cabinet, maintenance cage, or hold area. A good hierarchy reduces interpretation because everyone is using the same map of the site.
- Standardize part identity, not just part quantity. In practice, that means every part should have a consistent name, code, category, and minimum descriptive information that all departments recognise.
- Manage both quantity accuracy and location accuracy. Too many organisations focus only on whether the count is right. But the warehouse only works when the count is right and the item sits where the process expects it to sit.
- Reduce friction in day-to-day stock movements. Inventory accuracy usually erodes through small delays rather than dramatic failures. A fitter takes two items but updates the record later. A storeperson transfers a box to line-side and plans to correct it after lunch. Receiving stages material in a temporary area that never becomes the official location. Those small delays compound into uncertainty.
- Slot by use, not by habit. Proper slotting leads to faster picking, fewer errors, cut travel time, and better visibility because employees can locate items immediately and see when something is not in the right place. Research goes further, showing that storage assignment influences travel time, congestion, and overall warehouse productivity. For manufacturers, this means critical and frequently used parts should live in accessible places, and parts often used together should be positioned with workflow in mind. A visual system helps because it makes the physical arrangement visible enough to question, improve, and maintain.
- Divide the operation into meaningful visual zones. Dividing warehouses into smaller zones can improve efficiency when demand patterns make those zones operationally sensible. In manufacturing, zones are not only picking regions. They are responsibility regions. Receiving owns one zone, central stores another, maintenance another, quality another, and production support another. A strong visual model helps each department understand both its own area and how that area connects to the next one. That reduces the “not my location” mentality that often hides stock in plain sight.
- Use visual controls to reveal abnormalities quickly. Lean and 5S guidance both stress that visual cues reduce waste, reinforce standards, and help employees detect abnormal conditions sooner. In inventory terms, an abnormal condition might be mixed stock in a single bin, a shelf that should hold one class of item but contains another, a line-side location with no replenishment signal, or a quarantined part stored where available stock normally sits. A visual inventory system does not replace physical labels, floor markings, or shelf discipline. It amplifies them by giving the digital side of the operation the same “easy to see” logic as the physical side.
- Make parts visibility cross-functional by design. Training staff and fostering collaboration among maintenance, procurement, and operations, because spare parts management does not stay inside one department. Inventory visibility works best when each department sees the same current truth instead of maintaining shadow records. That shared truth should answer the questions each team asks most often: what is available, where is it, who moved it, what is reserved, and what is running low in the areas that matter to production. Cross-team alignment is not a by-product. It is the point.
- Preserve activity history and accountability. CyberStockroom’s activity history can be filtered by user, activity type, timespan, and location, with exportable reporting for review. This matters because visibility is not only about current stock. It is also about movement history. When a part goes missing, lands in the wrong zone, or triggers a count variance, teams need to know what changed and when. Without activity history, every discrepancy becomes detective work. With it, improvement work becomes faster and more objective.
- Treat visibility as a habit, not a project. The problem is dynamic and affects performance continuously, while cycle counting is useful because it creates a planned, repeated correction mechanism rather than a once-a-year event. The same logic applies to visual control. The map, the naming, the zones, the updates, and the review routines all need to become part of everyday operations. Visual inventory wins over list-based control when it becomes the routine way the organisation sees stock, not an additional view people ignore once the launch period ends.
How CyberStockroom Supports Multi-department Parts Visibility
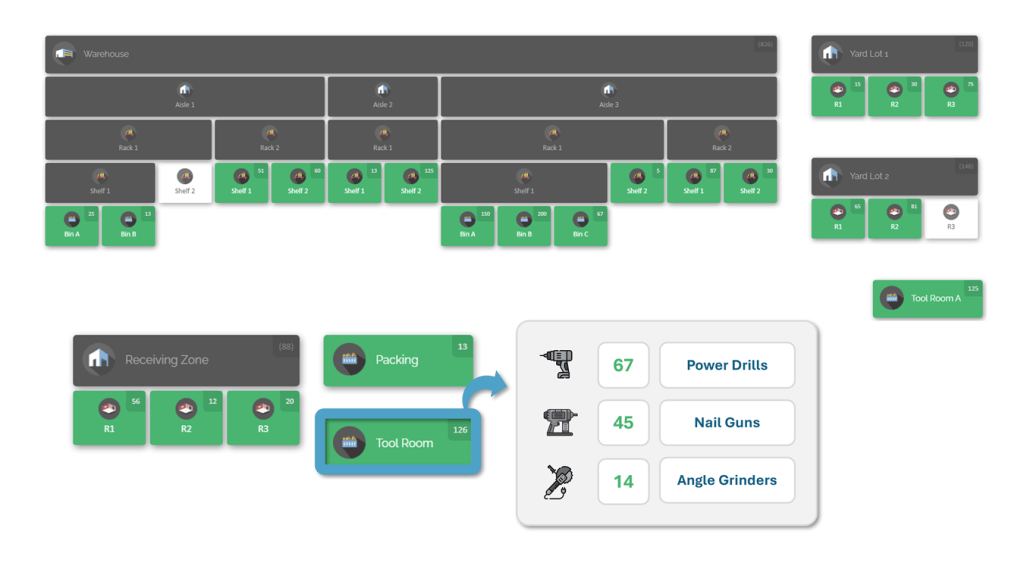
This is where CyberStockroom fits naturally into the warehouse comparison. Its core strength is not that it adds another list to the business. Its strength is that it turns locations into a visual operating model. CyberStockroom allows teams to create a map of the business, break it into locations and sub-locations, arrange the layout to match how they actually see the operation, and view product quantities at a glance. In a manufacturing setting, that means you can model the warehouse, the maintenance store, the line-side cabinets, the tool area, and the hold zones in one place instead of leaving them buried in separate location codes.
That matters because the biggest visibility failures in manufacturing are usually not caused by the absence of a count. They are caused by the absence of context. CyberStockroom’s map gives context back to the user. Instead of asking someone to decode where “B2-MAINT-OVR-03” is, the system can show the area visually within the wider operation. That is what lets teams move from searching to seeing. When a stores operator, planner, production supervisor, and maintenance technician are all looking at the same location picture, alignment becomes easier because the conversation is grounded in a shared layout rather than only a shared spreadsheet.
CyberStockroom also supports direct visibility into the contents of each location. Users can view the contents of any location and attach images, barcodes, and custom fields to items to help find them faster. That is useful in multi-department parts environments because stock identity often needs more than an item code. A maintenance spare may need a manufacturer field. A production consumable may need a category field. A quality-held part may need clear differentiation from available stock. The more clearly items are described inside their actual locations, the less room there is for ambiguity between departments.
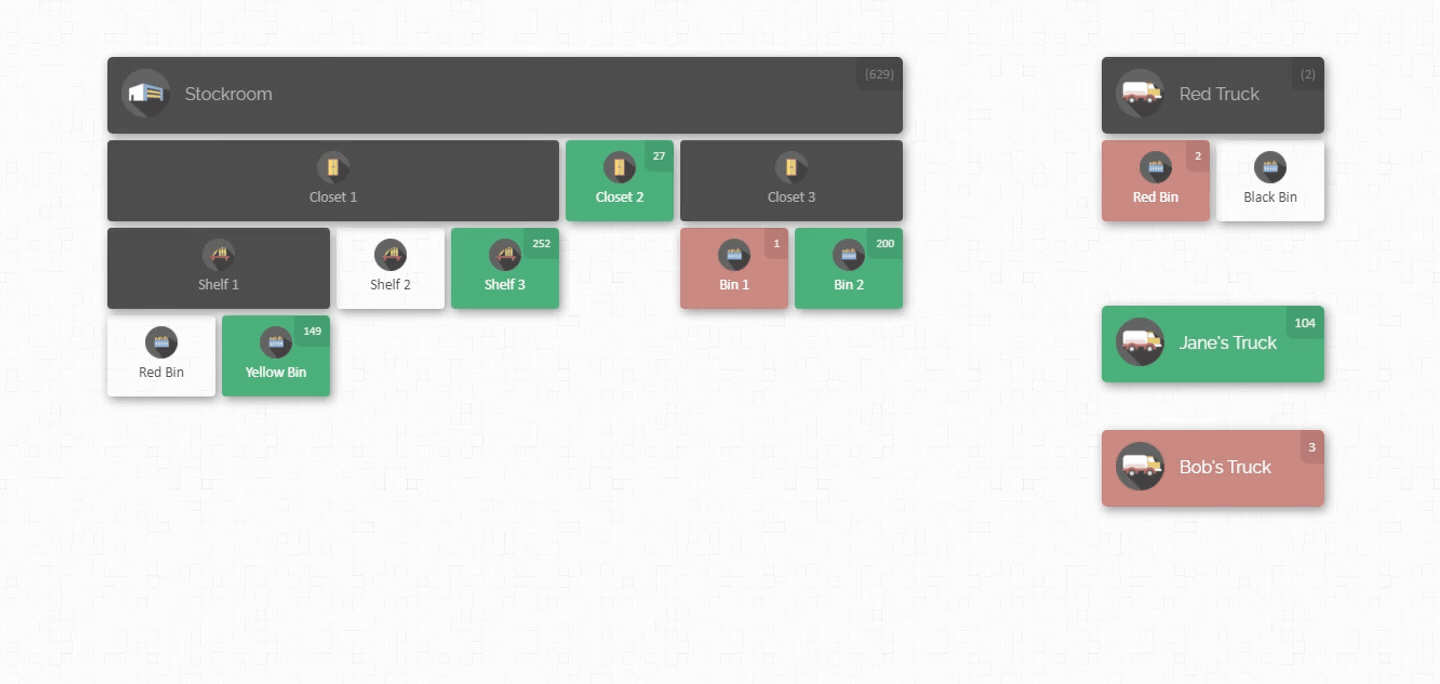
One of the most practical CyberStockroom features for day-to-day accuracy is its drag-and-drop transfer approach.The ability to move items between locations or sub-locations by dragging and dropping them on the map, and to carry out quick cycle counts and adjustments from that same visual context. This is valuable because many manufacturing stock moves are small, frequent, and operationally urgent. A box shifts from receiving to stores. A kit moves from stores to line-side. A spare goes from central inventory to maintenance. When those micro-movements are easy to record, teams are less likely to postpone updates and more likely to keep the system aligned with reality.
CyberStockroom’s product distribution view is particularly relevant to cross-department visibility. Its official copy explains that users can scan or select a product and see its distribution, quickly locate items, and visually assess product levels. For manufacturers, that is one of the clearest advantages of a visual system over a list-based one. Instead of running multiple location reports and reconciling them mentally, a planner or storeperson can ask a single operational question: where in the business does this part exist right now? That makes it easier to spot fragmented stock, duplicate holdings, under-served departments, or opportunities to rebalance inventory before shortages trigger disruption.

CyberStockroom also supports activity-level accountability. Its loss-prevention and history tools allow users to analyse past activity and filter that history by user, activity type, time span, and location. In manufacturing environments where multiple departments touch the same items, that is important for more than shrinkage. It supports root-cause work. If a location routinely drifts out of balance, if stock keeps appearing in unplanned overflow areas, or if a certain department is creating count variances during hand-off, the history gives the business something concrete to review. Visibility becomes traceable rather than anecdotal.
Another practical strength is the way CyberStockroom can be shared across teams inside the organisation. Map can be shared with team members or collaborators through user access permissions, enabling them to view and interact with the map as needed. That matters because multi-department parts visibility fails when the warehouse team is the only group with a usable view. Production needs to understand what is staged line-side. Maintenance needs to know what is in reserve. Procurement benefits from seeing how stock is really distributed before placing another order. Shared visibility reduces the need for each department to maintain its own shadow system.
CyberStockroom also supports a practical transition from list-based control because items can be added manually, by barcode scanner, or by spreadsheet, and the platform is built around organising inventory by map rather than by abstract list alone. That means a business does not have to treat the move to visual inventory as a theoretical redesign. It can start by modelling the operation, loading core items, and giving departments a better execution view of the stock they already manage. For manufacturers trying to improve parts visibility without adding unnecessary complexity, that is a meaningful advantage.

Set in the middle of this broader discussion, CyberStockroom’s position becomes clear. It is not being framed here as a generic software catalogue entry. It is being framed as a practical answer to the exact problems a list-based warehouse system struggles to solve: poor spatial understanding, delayed stock updates, fragmented cross-department visibility, weak location context, and time lost hunting for parts across multiple operational areas. CyberStockroom enables teams to organise stock by place, see distribution visually, move inventory quickly between mapped locations, and maintain accountability for what changed. In the context of a manufacturing warehouse comparison, that is what makes it useful.
How to move from list-based control to visual control
- The most effective transition starts with one honest decision: choose a visibility problem that the business feels every week. For some manufacturers, that is spare parts for maintenance. For others, it is line-side consumables, kitted production parts, or stock spread across several buildings. Starting with a real pain point matters because visibility projects fail when they are framed as software projects instead of operational improvements. Inventory visibility affects production, stock levels, and labour, so the strongest case for change is always operational, not cosmetic.
- Map the physical world before trying to optimize it. Build the location hierarchy the way the floor actually functions today. Include the awkward but real areas: overflow cages, temporary staging zones, repair shelves, quality hold points, and department-managed cupboards if they are operationally important. A visual inventory model only works when the map reflects reality closely enough that staff trust it. CyberStockroom’s location and sub-location structure is useful here because it is designed around representing the business visually rather than forcing everything into a flat folder of bin codes.
- Clean the part identity. Remove duplicates, align names, add useful fields, and agree how departments will refer to the same item. IBM’s guidance on poor spare-parts data is important here because inconsistent naming and missing details are not minor admin errors. They are visibility blockers. CyberStockroom’s custom fields, item images, and barcode support can help reinforce a cleaner part structure once teams agree the standard. The transition fails if people can see the map but still cannot trust the item identity inside it.
- Establish a count baseline. You cannot improve visibility on top of unstable records. Before moving a process into a new visual model, count the critical areas, correct the discrepancies, and decide how often each class of item will be checked. This is especially important for line-critical spares and high-movement consumables, where even small errors can ripple quickly into stockouts or downtime.
- Once the map and baseline are in place, redesign movement discipline. Every transfer between departments should have an easy, standard way to be recorded at the time it happens. This is where visual tools create a real behavioural advantage. CyberStockroom’s drag-and-drop transfer method reduces the effort needed to record small moves, and that helps close the gap between physical movement and system movement. Manufacturers should treat this seriously. If the update path is slow, labour will protect throughput by bypassing the system. The result is predictable: visibility degrades again.
- At the same time, review slotting and zone ownership. Layout decisions affect speed, accuracy, visibility, and congestion. This is the moment to move critical, high-use parts closer to the point of use, group related items where sensible, and clarify departmental ownership for each zone. A visual system makes these decisions easier to review because the arrangement is visible. Instead of arguing over abstract codes, teams can look at the layout and decide whether the current placement supports flow.
- It also helps to define a small set of success measures that matter to operations. Inventory record accuracy and location accuracy should both be tracked. So should cycle count variance, time spent locating critical parts, emergency buys, stockouts in key departments, and the number of transactions being corrected after the fact. The goal is not to admire the map. The goal is to reduce the business cost of uncertainty. Inventory accuracy literature shows clearly that discrepancies affect productivity, service, and decision-making, so the transition should be judged on those terms.
- Another important point is cultural: keep the list, but stop making it the primary warehouse experience. Reports, exports, procurement summaries, and formal counts will always involve lists. That is fine. The shift is about giving floor teams a better first view. In a mature setup, staff still have access to the data table, but the visual location model becomes the default way to navigate stock, investigate problems, and coordinate across departments. Lean visual management principles support exactly this kind of thinking because the standard is made visible rather than left hidden inside text.
- Finally, treat the rollout as shared operational change. Spare parts management requires cross-department collaboration, and that point should shape implementation. Production, maintenance, stores, and procurement should all help define the location structure, item standards, and exceptions process. That involvement is what turns a visual tool into a shared language for the business. Without that, a map is just a drawing. With it, the warehouse gains something more valuable: common visibility that survives shift changes, absenteeism, and departmental boundaries.
Conclusion
The case for visual inventory is straightforward once you look at warehouse work as it is actually performed. Warehouses and manufacturing stores do not run on part numbers alone. They run on movement, location, timing, and coordination. A list-based system can record those things, but it often makes people reconstruct them mentally. A visual system presents them in the form the work naturally takes: places, relationships, zones, and movement across the floor. That is why visual inventory beats list-based systems for warehouse execution, especially when parts visibility must span multiple departments.
The operational gains are equally clear. Better visibility supports productivity, stock control, production continuity, and faster issue resolution. Stronger slotting reduces travel and errors. Routine counting protects quantity accuracy. Visual controls expose abnormal conditions sooner. Shared access keeps maintenance, procurement, stores, and production aligned. These are not separate concerns. They are parts of one discipline: making stock easy to see, easy to trust, and easy to act on.
CyberStockroom fits this discipline well because it approaches inventory through mapped locations, visible stock distribution, quick transfers, clear organisation, and activity history. In a manufacturing environment where parts move across departments and visibility gaps create cost, delay, and frustration, that map-based approach answers the real warehouse question better than a list ever can. When teams stop hunting through records and start seeing the operation clearly, the warehouse becomes faster, more accurate, and far easier to align across the whole business.


Leave a comment