
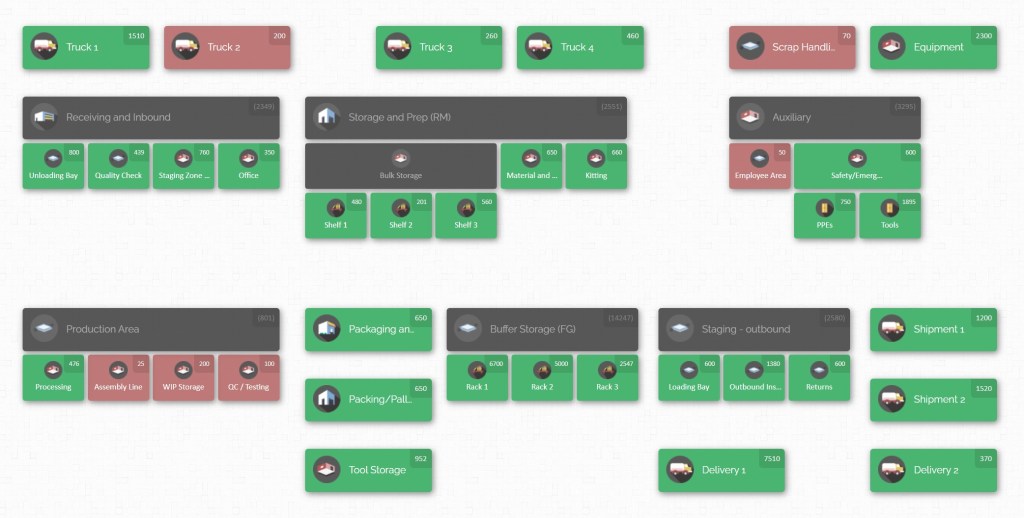
Imagine opening an interactive inventory map of your facility that highlights every rack and bin with real-time stock counts. In this demo section, a visual inventory map lays out the warehouse floor or laydown yard, clearly labeling aisles, racks, and bin locations. This map-based interface turns a complex warehouse into an intuitive diagram – your new “2D digital twin” of the space.
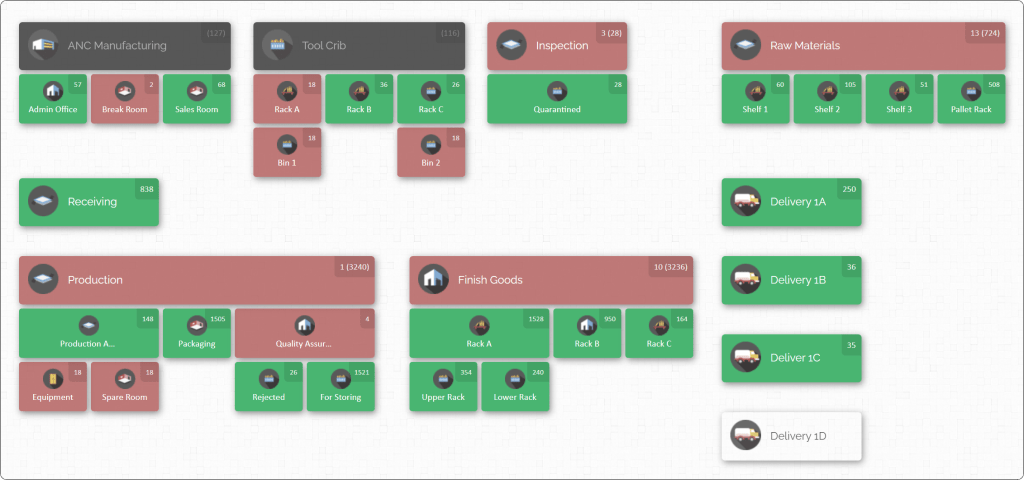
Such rack-level mapping changes everything for inventory teams. Instead of hunting through spreadsheets or roaming the shop floor, anyone from maintenance, production, or procurement can simply zoom into the map and see precisely where each part resides. This rack-level, bin-by-bin visibility ensures that as soon as you log into the system, you know how many of each component you have and exactly where it sits.
In a multi-department manufacturing environment, this shared spatial view prevents duplicate orders, cuts search time, and aligns teams on a single source of truth.This article will explain why bin-level inventory mapping is so powerful. We will explore common problems caused by poor visibility, outline best practices for organizing parts across departments, and show how a map-driven system transforms warehouse operations. Along the way, we’ll highlight how CyberStockroom’s visual inventory mapping solution brings these ideas to life – enabling your teams to literally see their parts in context.
The Challenges of Multi-Department Inventory Visibility
In many manufacturing companies, different teams stake claims on the same pool of parts and materials. For example, production may use raw materials and consumables, maintenance may need spare parts and repair kits, and tool-room personnel may manage specialized tools. When each department tracks inventory in isolation (spreadsheets, paper logs, or siloed systems), the result is poor coordination. One team might hoard stock “just in case,” while another runs unexpectedly short. Orders get duplicated or missed, and nobody has a complete picture of inventory levels.
Common symptoms of weak visibility include:
- Lost or Misplaced Items: When parts are stowed without strict location controls, they can end up in the wrong rack or pile. A maintenance worker might stash a bearing on Shelf B3 but mark it under C4, so later no one can find it.
- Excess Safety Stock: Departments over-order to guard against uncertainty. Without knowing that inventory already exists on site, teams inflate carrying costs by keeping double or triple the stock needed.
- Order Delays and Shutdowns: If a production line awaits a critical component that was actually in another stockroom all along, downtime and rush shipping create chaos and cost.
- Labor Wasted Searching: Technicians and warehouse staff spend valuable time opening bins and combing aisles. Every minute spent looking for a part is a minute not assembling products or maintaining equipment.
- Inaccurate Records: When each department maintains its own records, the “official” counts diverge from reality. Reconciliation becomes a nightmare, and routine audits uncover big gaps.
The root cause of all these problems is simple: people and spreadsheets alone cannot provide 100% clear, real-time visibility across the entire plant. When data is scattered, delays in updating inventories lead to blind spots. And as manufacturing operations scale up – with multiple warehouses, vehicles, and on-site storage areas – these gaps grow.
By drilling down to the rack and bin level, organizations eliminate the mystery. Every item is tied to a precise location, whether it’s a pallet in the yard or a fastener in a tool room drawer. This granular approach puts an end to “where is it?” questions and establishes a single source of truth that all departments share.
Rack-Level Inventory Mapping: What It Means and Why It Matters
Rack-level inventory mapping means creating a detailed visual layout of your storage spaces where every rack, shelf, and bin is mapped as a unique location. In practice, this involves:
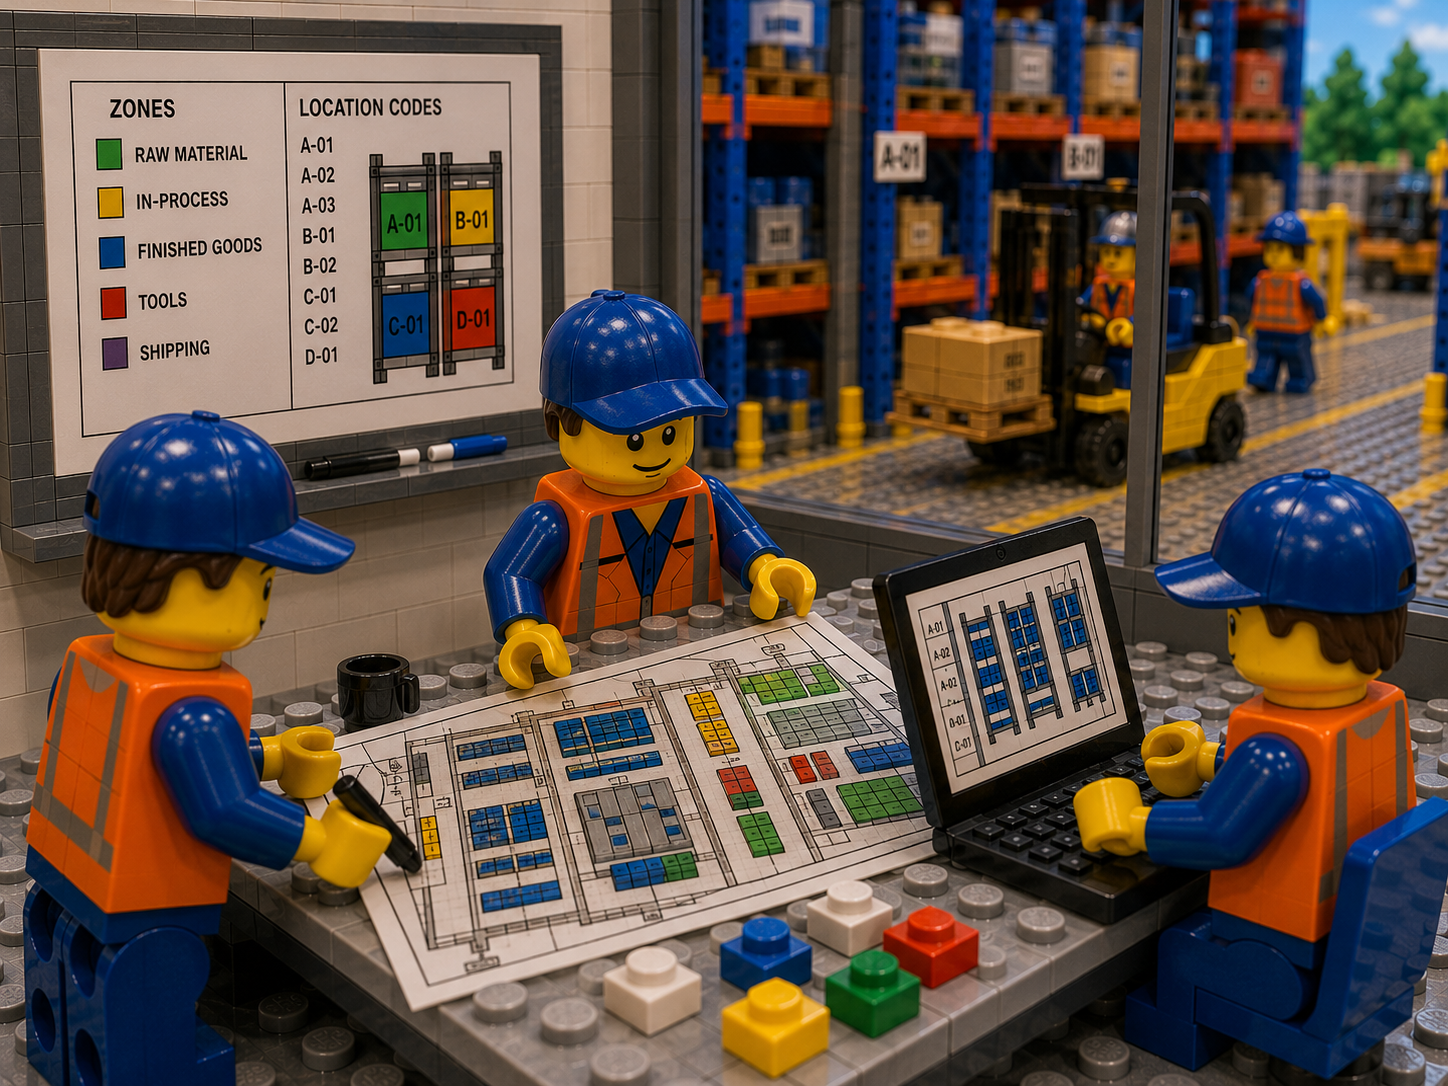
- Defining Locations: The warehouse or stockroom floor plan is drawn to scale, with areas like receiving zones, production staging, and outgoing docks. Within that space, each aisle and rack is labeled (for example: Aisle 5, Rack 12).
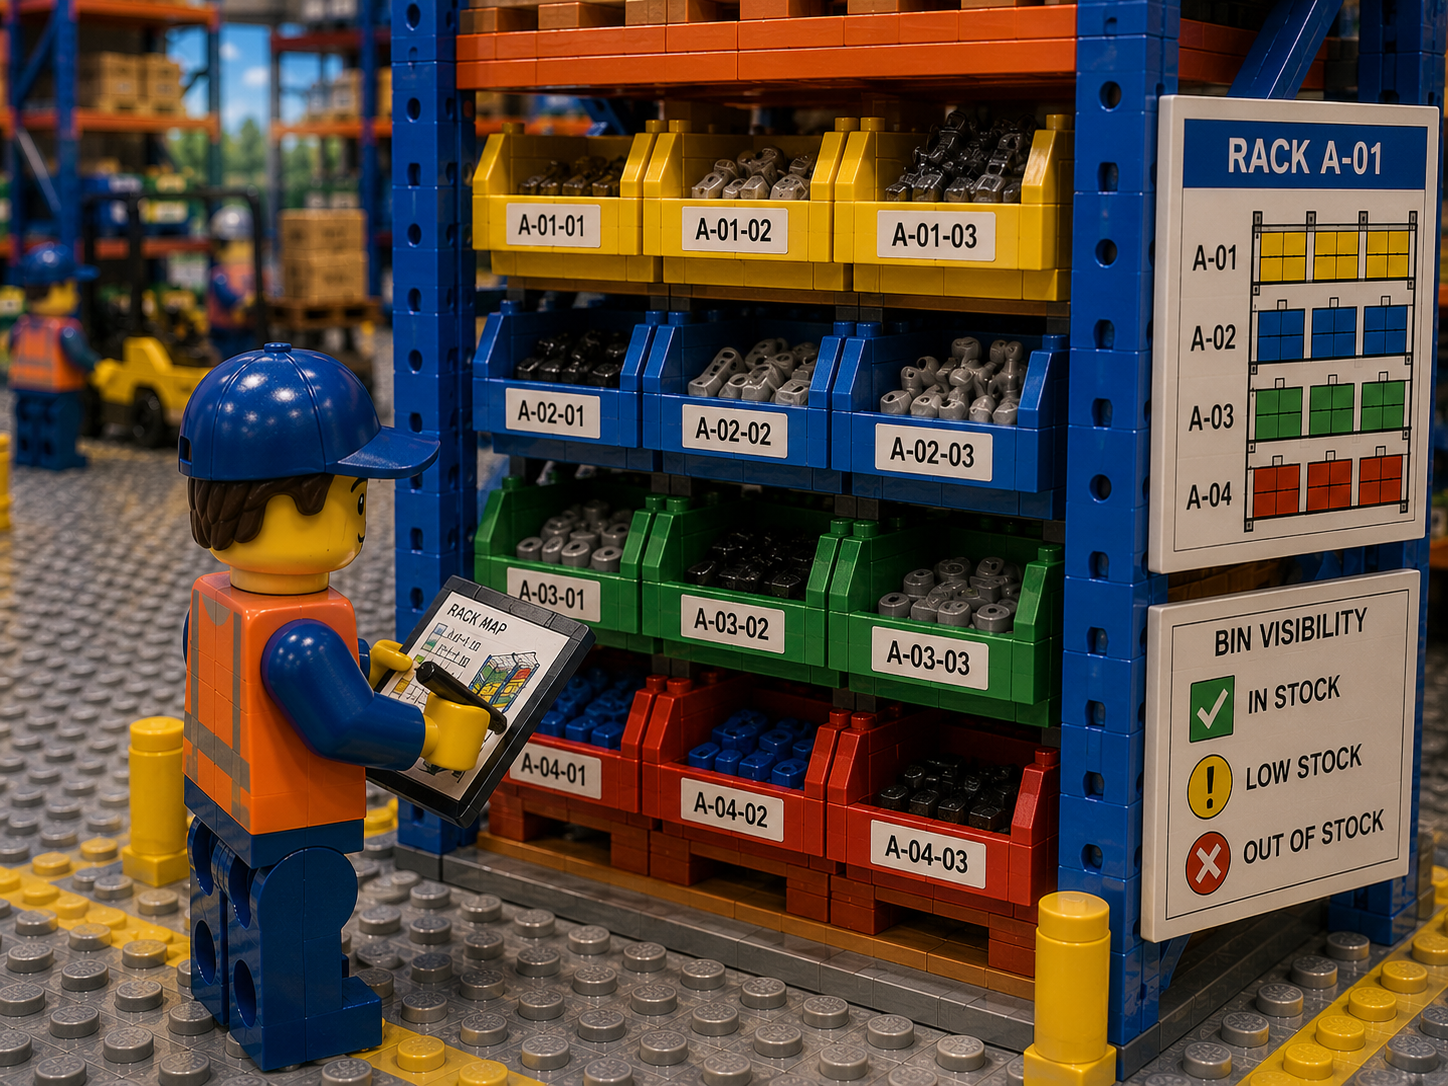
- Labeling Bins and Levels: Each rack often has multiple levels and bins or shelves. These too get identifiers (for example: Rack 12, Level 2, Bin 03). A common labeling scheme is Zone-Aisle-Rack-Level-Bin so that every location code is unique and hierarchical.
- Assigning Inventory to Map: Once the map structure is defined, every part or SKU is assigned to one or more mapped locations. The system knows that bolts are in A-5-12-02-03 (zone A, aisle 5, rack 12, level 2, bin 3) and steel beams are on A-3-07 (assuming beams are on an open rack without bins).
- Interactive Layout: The result is a navigable visual: you can click on a rack in the map to see what’s inside, or zoom in on a bin to view current stock counts. A color or icon can indicate low-stock items, overstock situations, or missing inventory.
Why it matters: Without this level of detail, companies effectively fly blind about where things are. By mapping everything down to each storage slot, you ensure that no part can ever “fall through the cracks” of your system. Benefits include:
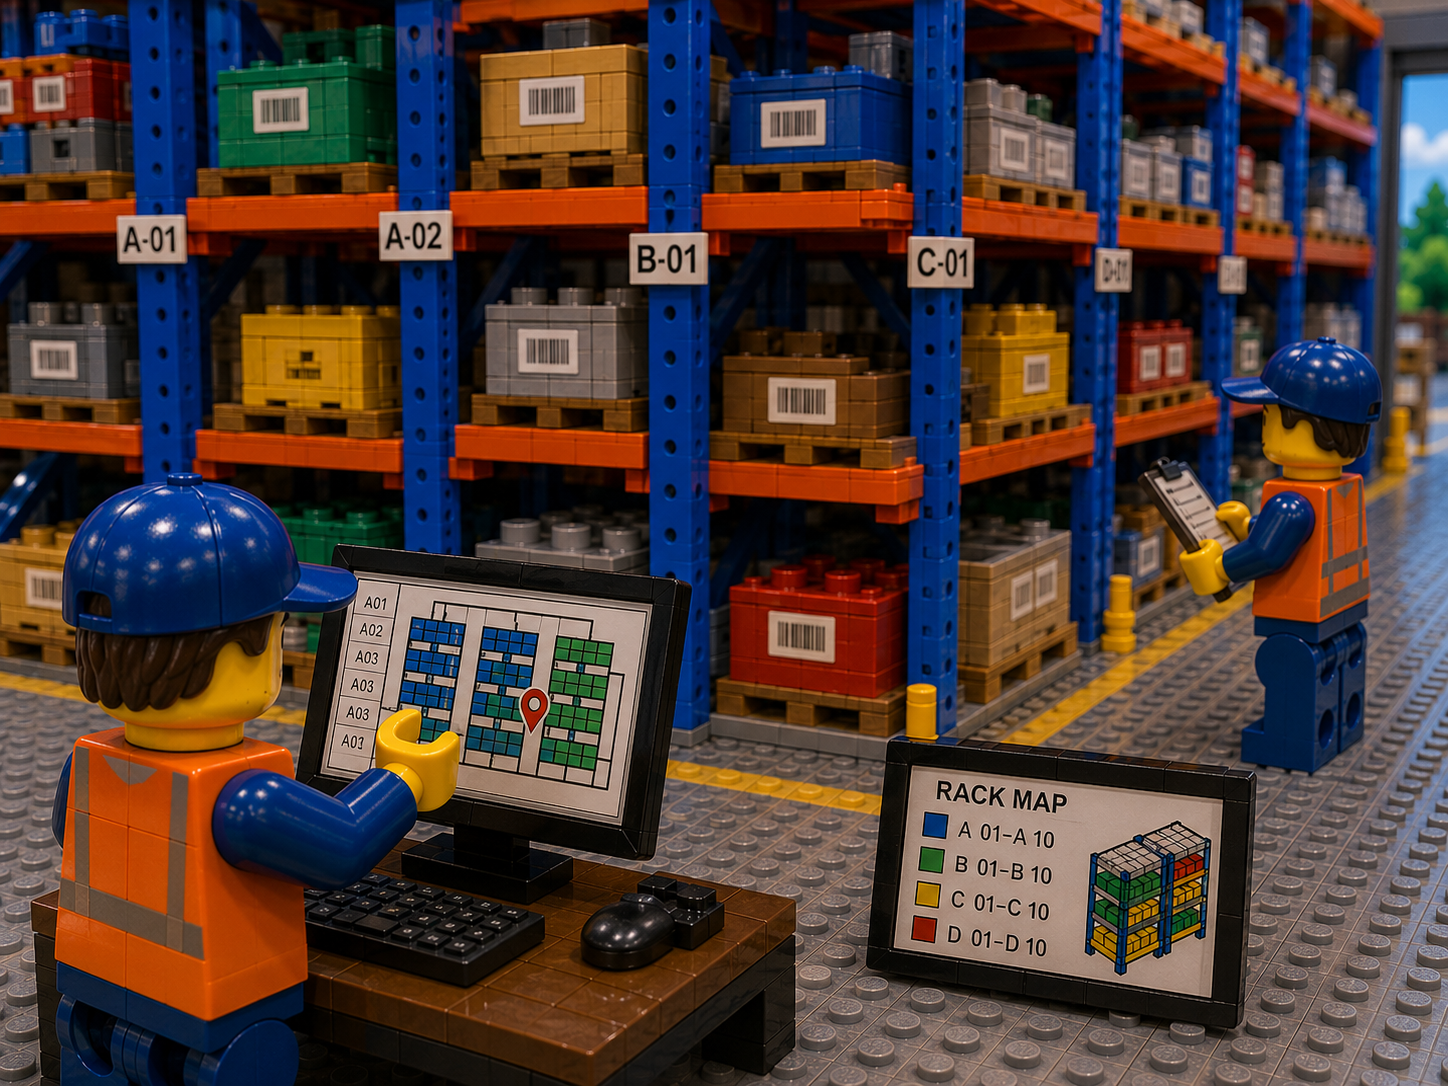
- Instant Location Lookup: Rather than combing shelves, staff can simply refer to the map and go directly to the correct bin. Maintenance crews find spares faster; pickers locate parts immediately.
- Reduced Search Time: Studies show that visual mapping can cut retrieval times dramatically. In a large facility, search time can be cut by half when people navigate visually instead of scanning lists.
- Error Reduction: When items have fixed mapped homes, the chance of misplacing them drops. Each bin has a known capacity and contents, preventing overstuffing or disorganization.
- Better Space Utilization: A map highlights unused or underused spaces. Managers can see at a glance which racks are half-empty and can reorganize inventory for better balance.
- One Truth for All Teams: Every department logs inventory movements into the same map system. If the production team withdraws bolts from a rack, the map updates and maintenance sees the new count immediately. This alignment prevents duplicate orders and confusion.
- Audit and Compliance: During audits or inspections, a map makes it easy to verify inventory. Auditors can physically compare map counts to a rack in seconds rather than laboriously matching spreadsheets to shelves.
An inventory map with rack-level bin detail turns your warehouse or yard into a transparent, manageable space. It gives everyone – from shop floor workers to planners – a unified, spatial understanding of where everything is. This is the foundation for the efficiency and accuracy that follows.
Best Practices for Achieving Full Parts Visibility
Reaching bin-level visibility is not just about buying software; it’s about adopting the right processes and culture across your teams. Below are industry best practices for improving parts visibility and inventory accuracy in a multi-department environment:
- Centralize Inventory Data in a Unified System: Use one platform (cloud-based if possible) for all inventory transactions. When receiving, transferring, or issuing parts, everyone from purchasing to maintenance updates the same database. This ensures all teams reference identical data, eliminating duplicated records. A centralized system means if Maintenance takes a part from Bin A, Production instantly sees the reduced count – without separate spreadsheets colliding.
- Label Everything Clearly: Every rack, shelf, bin, and even floor zone should have a unique identifier. Adopt a logical naming standard (for example, Building A – Aisle 2 – Rack 14 – Level 3 – Bin 01). Print durable barcode labels for each location and scan them during transfers. When workers scan an item into or out of the system, make it part of the procedure to scan both the item and its bin location. This discipline ensures the system “knows” exactly which bin the part left and arrived in, enforcing rack-level accuracy.
- Implement Real-Time Tracking Tools: Wherever feasible, use barcode or RFID scanning to update inventory instantly. For example, on receiving a pallet or pulling parts, have staff scan the part and the destination bin on a mobile scanner. The data should sync immediately to your inventory map. This way, as soon as an action occurs in the warehouse, the inventory counts on the map reflect it. Manual entry creates delays and errors; real-time scanning keeps the map live.
- Map Your Layout Before Storing Parts: Before labeling your first rack, create the digital map layout. Walk the space to define zones (e.g. raw material area, finished goods, tools). Draw out the aisles and mark each rack and shelf. Assign location codes on the map matching what you will label in reality. Populate the map with your initial stock counts. This pre-planning ensures the inventory map mirrors the real world, so that when someone clicks on “Rack 5, Bin 2” in the map, there really is a Bin 2 there with known contents.
- Prioritize Critical and Fast-Moving Parts: Use an ABC analysis (rank parts by value or turnover) to focus effort on high-impact items. For example, your top 20% most-used parts might deserve their own dedicated well-labeled bins with frequent cycle counts, while slow-moving spares might be stored in bulk. Highlight critical parts on the map (for instance, color-code bins that contain day-critical or safety-related components). This ensures that efforts to maintain accuracy concentrate where it matters most.
- Align Processes Across Departments: Standardize procedures so that every team handles inventory the same way. Create agreed workflows: e.g. Receiving Team scans all incoming pallets and places parts into designated bins on the map; Maintenance Team must scan parts out of the map when they withdraw for a job; Procurement reviews the live map before ordering new stock. When all groups follow the same steps, inventory never “goes off radar.” Train everyone in the process and include the map system as the go-to tool for information.
- Routine Cycle Counts and Audits: Even with a perfect system, discrepancies can occur (damaged goods, unscanned moves, etc.). Schedule regular cycle counts by location. For example, count one aisle or zone each week so that your entire facility is verified over a quarter. Reconcile counts to the map’s data immediately and investigate mismatches. Fix any systemic issues (e.g. missing scans, mis-picks). Consistent counting keeps your map truthful; and the map helps counting by telling you where each item should be.
- Visual Dashboards and Reporting: Beyond the floor plan, use dashboards that summarize key metrics. Show low-stock alerts, bin utilization, and department-specific inventories. A visual dashboard might display a pie chart of stock by category or a warning list of bins below safety stock. When teams can see charts or alerts tied to map locations, it drives proactive action (e.g. a red alert on Bin A5–03 means maintenance knows to reorder a part before it runs out).
Following these practices lays the groundwork for truly transparent inventory control. When racks and bins are consistently labeled and tracked, staff spend less time searching and more time moving operations forward. And because one updated map touches all departments, everyone stays in sync. Below is a quick checklist of key steps:
- Define zone/aisle/rack/bin naming convention.
- Draw or import your floor plan into the inventory system.
- Label every storage location to match the map.
- Enter existing inventory by location.
- Train all teams on scanning into/out of the map.
- Perform cycle counts and update any discrepancies.
Together, these efforts transform a warehouse from a chaotic black box into an organized, collaborative space.
Benefits of Rack-Level Bin Visibility
Implementing a warehouse inventory map down to the bin level yields concrete advantages for operations. Here are some of the biggest payoffs:
- Faster Item Retrieval: Staff navigate a visual map rather than guessing aisles. A technician can click on the part’s icon on the map and see “Rack B3, Level 2, Bin 5” and retrieve it instantly. This cuts search time dramatically – no more wandering or calling colleagues to find things.
- Fewer Lost or Misplaced Parts: With every bin’s contents recorded, you eliminate “mystery shortages.” If a scan or transaction is missed, the map highlights a discrepancy during cycle count. This means nearly all items have accounted locations at all times, so parts are rarely left wandering the floor.
- Higher Inventory Accuracy: Regular updates via scanning keep your digital inventory in sync with reality. Companies with strict location tracking often see accuracy rates jump from 80% to over 99%. High accuracy means when you order or commit a part, you can trust the map’s count.
- Improved Space Utilization: The inventory map reveals where space is free or overcrowded. Managers can reorganize storage based on data: moving fast-moving items to more accessible racks, and assigning rarely used parts to quieter zones. Optimizing the layout reduces wasted space and keeps aisles clear.
- Enhanced Cross-Team Coordination: All departments view the same map and data. If Production reserves a part in advance, Maintenance sees it. If Purchasing restocks a bin, Engineering knows. This shared visibility breaks down silos. A color-coded map can even show which department “owns” each item or which project it’s for, aligning priorities at a glance.
- Better Decision Making: With a visual overview, supervisors can quickly identify trends. For example, if certain bins consistently hit reorder points, it’s easy to adjust stocking levels. If one area always has excess, that insight is obvious on the map. Rather than reading long reports, one map glance tells the story.
- Streamlined Training and Onboarding: New staff get up to speed faster when they can see the warehouse layout visually. Instead of memorizing aisle numbers, they explore the map and physically recognize labeled locations. This reduces training time and errors by new hires or temporary workers.
- Centralized Multi-Location Control: If you have more than one facility or even company vehicles and yard storage, a map system can link them. Supervisors can view all sites from one dashboard. For instance, a branch warehouse in Site A and a remote yard in Site B both appear on the unified map. Dispatchers see where parts are without calling or emailing multiple people.
These benefits contribute directly to lower costs and higher efficiency. Fewer errors and lost parts mean less rework and emergency procurement. Quicker cycle times let your operations respond faster to customer demands or production needs. In short, mapping down to each bin brings order and accountability that permeates the entire supply chain.
CyberStockroom: A Map-Driven Solution for Visibility
Modern inventory systems can automate much of the mapping and visibility work. CyberStockroom is one such solution built around a visual map interface. Instead of text lists, it treats your warehouse floor plan as the primary dashboard for inventory. Here’s how it aligns with the best practices above and helps multi-department teams achieve full parts visibility:
- Interactive Digital Warehouse Map: CyberStockroom lets you create an interactive map of your physical space. Every aisle, room, rack, bin, container, and yard area can be drawn and labeled exactly as in real life. Once in place, this becomes your live interface. You can click or tap on any rack and see which parts (and how many) are stored there. The map is fully zoomable and customizable — if your plant has 10 warehouses or just one, each can be laid out independently or in combination.
- Real-Time Location Tracking: When parts move, CyberStockroom records that movement. For example, scanning a barcode at a bin instantly updates the count. The platform supports barcode scanning and batch receiving, so as soon as a part is scanned into a rack-bin location, everyone sees the new inventory on the map. If a maintenance tech drags an item from “Bin 4A” to “Bin 3C” on screen (the drag-and-drop feature), the system logs the transfer at that moment. This means all departments are always looking at up-to-the-minute data.

- Centralized, Cloud-Based Data: All inventory data lives in the cloud and ties back to the visual map. This unified system breaks down data silos. For example, if Production issues 20 bolts for manufacturing, the Inventory Manager in another department immediately sees “20 fewer bolts in Rack B5.” The reverse is also true: when Purchasing brings in new parts and places them on the map, other teams don’t have to ask; the counts refresh for everyone. Because it’s cloud-hosted, multiple locations or remote sites can connect to the same map or to synchronized maps, ensuring consistency across the organization.
- Drag-and-Drop Inventory Transfers: One standout feature is literally dragging items on the map screen. If 50 screws are moved from one bin to another, you can drag the item icon from Rack 1 to Rack 3, and the system records the change. This visual transfer replaces paper logs and makes shifting stock intuitive. In a busy manufacturing plant, even a glance can confirm that parts were moved correctly.
- Training and Onboarding: Because the map mirrors the physical layout, new employees learn the space quickly. Navigating the CyberStockroom map is like learning a GPS for your warehouse. Training focuses on how to navigate and update the map, rather than memorizing rack codes. This leads to fewer mistakes by new hires in their first weeks.

By tying together the elements of location labeling, real-time updates, and a shared interface, CyberStockroom directly implements the best practices we’ve outlined. It essentially makes the map your warehouse’s single source of truth. When one department updates a rack or reports an issue, the information propagates. Everyone else gains clarity: procurement sees what’s coming, production sees what’s ready, and maintenance sees which parts are available.
Importantly, CyberStockroom stays focused on inventory mapping and visibility. It allows teams to drag and drop parts between zones (even between separate warehouses or vehicles), tracks stock in detail, and keeps a complete audit trail of every movement. This means if an electrical part is scanned into Rack C2 today and later used in an assembly, the map timeline shows exactly when and where. In this way, the platform not only reflects the current state of inventory but also the history of each bin’s transactions.
In short, adopting a tool like CyberStockroom supercharges your efforts at bin-level visibility. It automates the consolidation of data, enforces location discipline, and presents a visual summary that all stakeholders can understand. The result is that your inventory map isn’t just a planning aid — it becomes the daily operations hub. Teams collaborate around it: procurement teams reorder from what they see, warehouse teams organize stock by what the map suggests, and management monitors KPIs by zone on the same screen. All of this happens seamlessly, simply by mapping your space and adopting the workflows we described.
Getting Started: Steps to Implement Rack-Level Inventory Mapping

Moving from manual systems to a rack-and-bin inventory map is a project that pays off quickly. Here’s a step-by-step guide to help you roll it out:
- Survey Your Space and Create a Plan. Walk through each storage area (warehouse floor, yard, tool room) and sketch a layout. Divide the space into zones (e.g., raw materials, finished goods, returns, etc.). Decide on an address format (Zone-Aisle-Rack-Level-Bin) and plan how you will label floors/areas if needed. Use this plan to draw the map in your inventory system or even on paper as a blueprint.
- Label Locations. Affix labels and barcodes to every rack, shelf, and bin. A common label might read “A3-R12-L2-B07” (interpreted as Zone A3, Rack 12, Level 2, Bin 7). Make sure labels are durable and placed where scanners can easily capture them. If you have open floor zones or yard storage, label those areas and containers too.
- Set Up the Inventory Map in Software. In your chosen system (e.g., CyberStockroom), build the digital map using the layout plan. Draw aisles and racks, assign the same identifiers you labeled physically. The map should mirror exactly what you see on the floor. Once drawn, start “placing” your stock on the map: assign each SKU to its correct bin in the system and enter the on-hand quantities.
- Establish Standard Operating Procedures. Define how inventory transactions will happen going forward. For example: Receiving Staff scan each received item and then scan the bin it is placed into; Assembly/Production must scan parts out of the map to use them; Transfers between locations require scanning both source and target bins. Document these steps and train all relevant staff. Ensure every inventory movement is recorded in the system through scanning or manual entry at the time of the move.
- Perform an Initial Audit. Once your map and stock are set up, do a one-time count of all bins to verify accuracy. Tally physical counts against what’s on the map, and correct any discrepancies immediately. This aligns your digital record with reality from day one.
- Monitor and Refine. As you operate, review the map regularly. Are some areas flagged as consistently low? Consider relocating inventory to better match demand. Are certain bins underused? You might consolidate items to free up space. Hold monthly reviews with representatives from each department (Production, Maintenance, Purchasing, etc.) using the map as a discussion point. Their feedback will improve map accuracy and workflow efficiency.
- Scale to Multiple Sites if Needed. If your company has more than one warehouse or off-site storage, repeat the mapping process for each and link them digitally. You can view them in a single global map or separate but synced instances. This gives a corporate-level inventory perspective while letting local teams manage their own zones.
By following these steps, you turn abstract inventory data into a living map. Each phase builds on the last: surveying establishes the plan, labeling enforces it, and software makes it accessible. After setup, the real gains come from disciplined ongoing use and collaborative refinement.
Best Practices Recap – Top Tips for Success
- Start with a Clear Naming Convention: Keep location codes intuitive and consistent. Train staff on what each part of the code means (e.g. aisle vs level).
- Make Scanning Non-Negotiable: Whenever an item moves, scanning at source and destination should be the rule. This habit keeps the map accurate.
- Communicate Across Departments: Hold briefings or newsletters explaining how the map works. When all teams see the same benefits (faster finds, fewer stockouts), adoption is smoother.
- Use the Map Daily: Encourage users to consult the map first for any inventory question – not paper or memory. The more you use it, the more reliable it becomes.
- Be Agile: As processes evolve, update the map. Did you add a mezzanine? A new machinery room? Reflect changes immediately so the map stays relevant.
Conclusion
Rack-level, bin-level visibility is a game-changer for warehouse and inventory operations in manufacturing and construction environments. Mapping every part down to its exact location brings clarity that spreadsheets alone can never match. The result is better inventory accuracy, faster operations, and smoother coordination between departments.
By following the practices outlined above and leveraging map-driven tools like CyberStockroom, inventory teams gain the control they need. Every search becomes a click, not a scavenger hunt. Ordering decisions are data-driven, not guesswork. And when the whole company sees the same live picture of inventory, teams naturally align their efforts.
Put simply, mapping down to the bin reshapes inventory management from the ground up. It creates a culture of accountability and efficiency: every part has a home, and every home is known. As you implement these changes, you’ll find that problems like lost parts, double orders, and delayed projects all start to fade away. Instead, you’ll have a lean, visual inventory system where tasks flow smoothly and everyone can answer with confidence: “Yes, we have that. It’s right here.”


Leave a comment