
Lean manufacturing is often reduced to a simple target: lower inventory. In practice, that target is too narrow. Lean works when materials, parts, and information move with less friction, less waiting, and less uncertainty. That is why parts visibility is not a side issue for inventory teams. It is one of the conditions that allows flow, standard work, point-of-use availability, and disciplined replenishment to function across receiving, stores, production, maintenance, quality, and shipping. If a plant cannot answer where a part is, how much of it is available, and which department currently owns it, lean improvement stalls very quickly. Value stream mapping is built around seeing the flow of both materials and information, and visual management methods are meant to make abnormal conditions obvious so teams can act early instead of firefighting late.
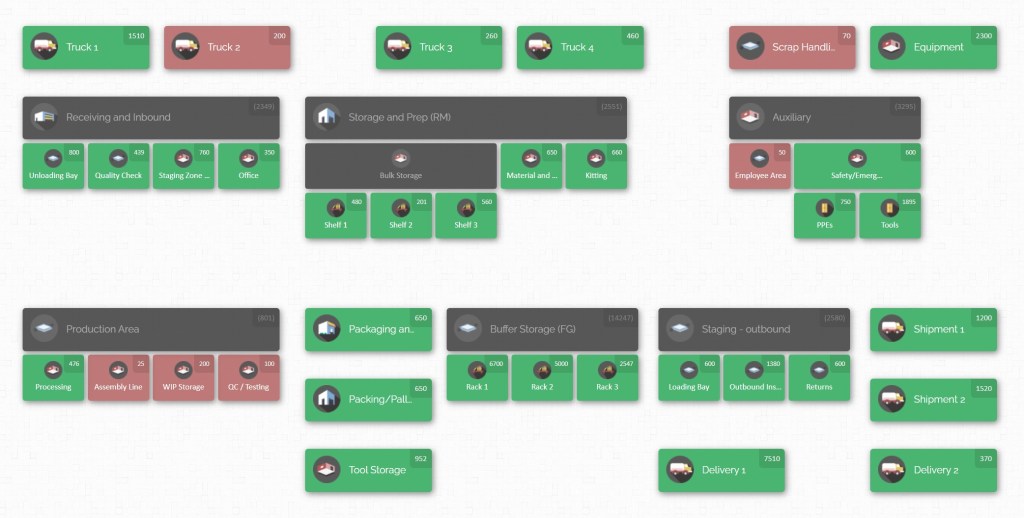
Another way to put it is this: the question is not whether a plant has inventory, but whether the plant can see inventory clearly enough to support reliable decisions. A visual inventory dashboard lean manufacturing support strategy is useful because it turns stock from a spreadsheet problem into an operational control system. When locations, handoff points, stock quantities, and usage patterns are visible in one shared view, the work of scheduling, kitting, replenishment, counting, and exception handling becomes easier to coordinate. When that visibility is weak, teams compensate with extra buffer stock, duplicate orders, urgent transfers, manual calls, and local workarounds that hide the real causes of delay.
Why Lean Manufacturing Needs Full Parts Visibility
Lean manufacturing starts from the customer and works backward through the value stream, aiming to deliver value with fewer resources and less waste. In day-to-day operations, that principle shows up as shorter lead times, smoother material flow, smaller batch behaviour, clearer standard work, and faster detection of problems. None of those outcomes is reliable if parts information is vague or delayed. A production line cannot maintain flow if a needed component is “supposed to be somewhere in stores.” A maintenance team cannot reduce downtime if critical spares are recorded in the system but misplaced on the floor. A buyer cannot replenish correctly if stock is spread across departments without a common view of where it sits and whether it is available for use.
This is where visual management matters. Visual controls are meant to support standard procedures, show the status of an activity so every employee can see it, and make it easier to notice problems. In lean terms, good visual control reduces the time spent interpreting, searching, and reconciling. It narrows the gap between what is happening physically and what the team believes is happening. When applied to parts and stockrooms, visual control means locations are organised, labelled, and easy to interpret; stock levels and abnormalities can be seen quickly; and movement rules are simple enough to follow without creating extra admin work.

That connection becomes even stronger when a plant uses 5S properly. 5S is not only about tidiness. It is a structured method for reducing waste and improving productivity through order, clear visual cues, and consistent routines. Its benefits include reduced unplanned downtime, lower in-process inventory, and less time spent looking for tools or materials. In other words, 5S creates the physical and behavioural discipline that makes an inventory map meaningful. If the floor is organised but the digital record is not, teams still lose time. If the system is tidy but the storage reality is chaotic, the dashboard still lies. Lean performance improves when the physical workplace and the inventory view reinforce each other.
Kanban adds another important layer. Visual inventory management system signals when more of a part or product should be produced, pulling inventory when needed and replenishing what has been consumed. The benefits include reduced inventory, improved on-time delivery, reduced lead time, and higher productivity. For kanban to work well across multiple departments, however, consumption and replenishment signals have to be linked to real locations and current stock positions. If departmental stock is hidden in side rooms, tool cribs, maintenance cupboards, or unmarked workcell bins, kanban becomes guesswork. A lean pull system only works when the plant knows what was consumed, where it was consumed, and where the replenishment should go.
Point-of-use inventory is another lean principle that depends directly on visibility. 5S and visual management reduce search time because operators have what they need at the point of use. The lesson for inventory teams is simple: if parts are stored closer to use, the location system becomes more important, not less. More local storage points increase convenience, but they also increase the risk of silent overstocking, duplicate buffers, and forgotten bins unless every location is mapped and governed consistently.
Value stream mapping makes the cross-functional side of this even clearer. It is also a way to visualise manufacturing processes and information flows, often as the first step in identifying waste, improving flow, and reducing lead time. It also notes that cross-functional teams are central to the method because different parts of the business see different facts, constraints, and pain points. Inventory is one of the clearest examples. Receiving sees containers and receipts. Production sees shortages and line stops. Quality sees holds and segregated material. Maintenance sees emergency spares. Purchasing sees reorder points. Finance sees carrying cost. If those departments do not work from a shared location logic, the plant gets multiple partial truths instead of one operational truth.
This is why full parts visibility directly supports lean goals. It reduces motion because people spend less time searching. It reduces waiting because departments can confirm availability faster. It reduces transport waste because materials are not moved twice due to confusion. It reduces over-ordering because hidden stock is found before new stock is bought. It reduces defects and schedule instability because the wrong part, expired part, or unavailable part is less likely to reach the point of use unnoticed. And it supports continuous improvement because teams can see abnormal inventory patterns by location, not just by total quantity.
When plants ask how a visual inventory dashboard supports lean manufacturing, the answer is not that a dashboard is attractive to look at. The answer is that a visual dashboard shortens the distance between problem and action. It lets supervisors, storekeepers, production leaders, and inventory planners interpret conditions quickly enough to act before waste compounds. In lean operations, speed of recognition matters almost as much as speed of movement. A map-based dashboard can support that recognition by showing quantity, location, distribution, and imbalance in a form that is easier to absorb than scattered tables and disconnected departmental files.
Where Multi-Department Parts Visibility Breaks Down
Most parts visibility problems do not begin with software. They begin with operating habits. A growing plant often accumulates stock in layers: a main stockroom, departmental shelves, maintenance cabinets, receiving areas, work-in-progress lanes, quarantine cages, tool cribs, field kits, project rooms, and temporary overflow spaces. Each layer is created for a sensible local reason. The problem comes when those layers are not governed by one shared structure. Then the same part may be visible to one department and invisible to another, even though both are working in good faith. The result is a plant that appears stocked on paper but behaves like it is frequently short.
A common breakdown is inconsistent location language. One team records “Assembly Line 2 shelf A,” another says “AL2 main rack,” another writes “Cell 2 bin,” and someone else uses an old room name from before a layout change. Without standard naming, the plant cannot easily aggregate stock by location, department, or handoff point. Searches become dependent on tribal knowledge. New staff struggle. Cycle counts take longer. Transfer history becomes hard to interpret. A visual map matters here because it forces a physical location model rather than a pile of informal descriptions. CyberStockroom’s location-based design reflects this principle by encouraging businesses to build a map that mirrors buildings, rooms, bins, and other real storage points, then use that map as a dashboard.

Another breakdown is inventory movement that is physically real but administratively invisible. Parts are moved to a line because production is under pressure. Maintenance borrows a component from stores to keep a machine running. Quality moves suspect stock into a hold area. A supervisor consolidates two bins into one during a clean-up. Receiving stages material near a work centre for convenience. None of these actions is the problem by itself. The problem comes when the move is not recorded immediately, or when the system is too awkward to update at the speed of work. Research on inventory record inaccuracy shows that inaccurate records affect picking productivity, lost sales, and capacity utilisation, and broader simulation work shows that eliminating inventory inaccuracy reduces costs and out-of-stock levels.
A third breakdown is the gap between quantity visibility and location visibility. Many businesses know total on-hand stock but struggle to answer where exactly that stock sits.
Departmental ownership also creates blind spots. Purchasing may believe an item is overstocked because the global quantity looks high. Production may believe it is short because usable stock is distant from the line or trapped inside another department’s local buffer. Maintenance may view a spare as critical and untouchable, while operations sees it as excess because it has low usage. Quality may hold parts physically in one area while the main system still treats them as generally available. Without a cross-department dashboard and clear storage rules, local optimisation wins and the plant loses. Value stream mapping exists partly to surface exactly these differences in perspective, because cross-functional teams often reveal conflicting assumptions that never appear in departmental reports alone.
Weak counting discipline makes matters worse. A set of factors linked to consistent and accurate counts, including accountability, written policies, an appropriate counting approach, frequency, segregation of duties, knowledgeable staff, supervision, research, and evaluation of results.
The final breakdown is cultural. In plants with weak visibility, people learn not to trust the system fully. Once that happens, they create protection. They keep shadow stock near their line. They write side lists. They call specific people instead of using the system. They order early just in case. They hold more than they need. They hesitate to return surplus because they fear not finding it again. None of this is irrational. It is a rational response to poor inventory trust. But once these behaviours spread, lean goals become harder to reach because standard work is replaced by personal workaround. Good inventory mapping is valuable precisely because it rebuilds trust by making the storage model easier to understand, the location logic easier to update, and the abnormal condition easier to see.
Best Practices for a Visual Inventory Dashboard That Supports Lean Manufacturing

A visual inventory dashboard works best when it reflects how materials actually move across the facility. To support lean manufacturing goals, the dashboard should do more than show stock totals. It should help teams locate parts quickly, reduce wasted movement, improve inventory accuracy, and keep departments aligned around one shared view of inventory.
1. Map Inventory Around the Way Parts Actually Move
The first best practice is to map inventory around the way parts actually move, not around the way the organisation chart is drawn. Start with the value stream. Trace how materials enter the site, where they are received, how they are staged, where they are stored, when they move to cell-side or line-side areas, how they return if unused, where blocked material goes, where maintenance holds spares, and how finished goods or kits leave the area. NIST describes value stream mapping as a visualisation of process and information flows and notes that it is often the first step in identifying waste and improvement opportunities. If your dashboard begins from the real flow, it will expose wasted transport, duplicate storage points, and missing handoff rules much earlier than a static inventory report.
2. Establish One Location Hierarchy for the Whole Facility
Every plant needs a single agreed grammar for location names and nesting. That might mean site, building, floor, room, area, rack, shelf, bin, or line-side point of use. The exact structure can vary by operation, but the principle should not. Each department must use the same logic, reserve certain naming patterns for certain uses, and avoid free-form local shortcuts. CyberStockroom supports this style of discipline because its map model is built around locations and sub-locations that mirror the real business layout, including warehouses, rooms, shelves, bins, and other storage points. The system becomes easier to trust when the location language is consistent enough that any trained person can follow it without local knowledge.
3. Use Designated Mapped Areas for Different Storage Purposes
The third best practice is to distinguish storage purpose through designated mapped areas rather than vague status labels alone. Lean operations need to know not just quantity, but usability and intent. Create visible, named locations for receiving, inspection, approved stock, quarantine, returns, rework, scrap staging, maintenance spares, point-of-use stock, and project-specific material where appropriate. Doing so reduces the risk that departments interpret “available” differently. It also supports standard work because everyone knows where to place material under each condition. Visual controls are meant to display status clearly enough for every employee to respond correctly, and mapped purpose-based locations do exactly that for inventory.
4. Make Every Storage Point Visible
Many plants only map major warehouses and overlook the places where inventory errors actually occur: cabinets next to machines, engineering benches, kitting carts, rework tables, maintenance rooms, temporary project areas, and overflow shelves created during busy periods. Those smaller spaces matter because they are close to use and therefore convenient, but convenience without visibility quickly becomes hidden inventory. NIST case material linking point-of-use inventory to lean improvement makes this clear: stock placed near use can improve flow, but it only stays lean when it remains ordered, standardised, and visible.
5. Use Barcodes for Both Parts and Locations
Most organisations think first about product barcodes, but location barcodes are just as important. Scanning the part alone confirms identity. Scanning the part and the location together confirms where that identity now resides. CyberStockroom supports barcode scanning for products and locations, accepts barcode scanner input across interfaces, and includes fast transaction handling for check-ins, check-outs, and transfers across multiple locations. That matters in manufacturing because the best inventory rule is the one people can execute under time pressure. The easier it is to record the movement at the moment of movement, the less opportunity there is for record drift.
6. Record Movements at the Moment They Occur
This sounds obvious, but it is one of the biggest gaps between policy and reality. Delayed updates create a silent zone where physical truth and system truth are different. That gap becomes dangerous during expedites, urgent maintenance work, or workstation replenishment, because one department acts on memory while another acts on the record. Research on inventory record inaccuracy shows that its effects extend to picking productivity and capacity use, while simulation work shows that aligning physical and system inventory reduces out-of-stock levels and cost. A lean inventory dashboard only supports flow if the data ages slowly enough to remain operationally trustworthy.
7. Replace Wall-to-Wall Correction With Continuous Accuracy Management
Use cycle counts strategically, by criticality, movement frequency, value, and location risk. Leading organisations set high record-accuracy expectations and treat accountability as a central part of the counting process. For manufacturing, that means critical A items, line-stoppers, scarce spares, and high-movement bins should be counted more often than low-risk stock. It also means count results should feed root-cause work, not just adjustment entries. If a certain workcell bin or maintenance cabinet generates frequent variances, the plant should investigate whether the cause is layout, training, poor labelling, unclear ownership, or unnecessary movement.

8. Segment Inventory by Operational Importance
ABC classification as a way to identify critical goods and focus management effort where it matters most. It also explains that ABC helps the wider supply chain understand which products should be prioritised and how different replenishment methods can fit different classes, including lighter two-bin methods for certain low-value items. For manufacturers, ABC is especially useful when combined with location mapping. It tells you not only which parts deserve tighter replenishment and counting discipline, but also which parts should be easiest to access physically and easiest to see on the dashboard. High-impact items should not be buried in the same visibility model as everything else.
9. Bring Point-of-Use Stock Under the Same Governance as Central Stores
Local line-side inventory should exist for a reason, with a defined owner, min-max rule or pull rule, replenishment trigger, and explicit mapped location. It should not become a one-way migration of stock away from central control. Kanban feeder lines and just-in-time replenishment can support workstation supply without disrupting flow, while 5S and visual management reduce the time operators spend searching for what they need. The practical implication is that point-of-use inventory should be designed, not improvised. If it is designed, it supports lean. If it is improvised, it usually becomes shadow stock.
10. Make the Dashboard Role-Based Without Fragmenting the Data
Every department should view the same underlying inventory truth, but their daily questions differ. Receiving wants to know what arrived and where it should be placed. Production wants to know whether line-side stock is sufficient and whether replenishment is pending. Maintenance wants fast visibility of critical spares. Quality wants to see materials isolated in hold areas. Inventory control wants variances, cycle count status, and unusual movements. Purchasing wants to understand which shortages are real rather than location errors. A good visual dashboard supports these distinct questions through one shared map and common location structure. CyberStockroom’s product pages explicitly position the platform as a way to track inventory across business units, teams, departments, and multiple locations while making the whole map visible in one place.
11. Design the Dashboard for Exceptions, Not Just Totals
Many plants have some form of on-hand quantity report already. What they lack is a quick way to see abnormalities by location. A useful visual inventory dashboard should help teams see empty critical bins, overfull point-of-use stock, material trapped in temporary areas, unusual distribution of one SKU across too many locations, and patterns of repeated transfer through the same bottleneck area. CyberStockroom’s “X-ray vision” product view is relevant here because it shows the distribution of a product across the map and helps users locate items and assess levels visually. That kind of distribution view supports faster root-cause work than a total quantity alone.
12. Use Custom Fields Carefully
In manufacturing, a part record often needs more than a name and quantity. Teams may need manufacturer, supplier, category, criticality, project, size, finish, equipment family, or usage notes. CyberStockroom supports custom fields and specifically notes that many businesses use fields such as manufacturer, supplier, style, colour, and category. The key best-practice point is not to collect everything. It is to collect what will help teams search, group, count, and decide. If a field will not support a daily decision, it probably does not belong in the front-line workflow.
13. Reduce Transaction Friction During Set-Up and Large-Scale Changes
One reason plants delay inventory clean-up is that correcting many products or many locations feels too slow. CyberStockroom addresses this through spreadsheet upload and batch processing, allowing businesses to import detailed item data and make bulk edits or move large numbers of items between locations. From a lean perspective, that matters because implementation should not consume so much clerical effort that teams abandon standardisation halfway through. The faster you can bring messy legacy data into a governed, location-driven structure, the sooner the dashboard can start improving decisions.
14. Use Visual Management in Daily Routines
The fourteenth best practice is to use visual management to support daily routines, not occasional audits only. Lean visual controls are effective because they are part of normal work. They are not a special event. A mapped inventory dashboard should therefore feature in daily production meetings, replenishment reviews, maintenance readiness checks, and continuous improvement conversations. Teams should review low-stock exceptions, count variances, blocked stock, unusual transfers, and recurring search hotspots. Standard work should define who reviews which signals and how quickly action should follow. EPA guidance on visual controls and standard work makes the same broad point: visual cues are most effective when they reinforce agreed procedures and are integrated into the routine work area, not stored separately as unread policy.
15. Align Layout Decisions With Inventory Visibility Decisions
The fifteenth best practice is to align layout decisions with inventory visibility decisions. For inventory teams, that means the dashboard should not be treated as a neutral mirror of any layout the plant happens to inherit. The map should help question the layout too. If a department needs frequent urgent transfers from a distant room, perhaps the point-of-use strategy is wrong. If one quarantine area causes excessive walking, perhaps segregation is correct but placement is not. If a part is counted accurately yet still causes waiting, perhaps its mapped location is technically correct but operationally poor. Visibility should improve storage decisions, not merely document them.
16. Treat Inventory Accuracy as a Trust Metric Across Departments
When the plant record is trusted, production does not hoard, purchasing does not overreact, and maintenance does not bypass the system casually. When trust is weak, every department starts protecting itself, and lean behaviour erodes. Accountability and measurable accuracy goals is helpful because it frames record accuracy as something to manage actively. For many manufacturing teams, a practical goal is not perfection first. It is a visible climb toward stable, repeatable accuracy in the places that matter most, supported by routine counts, fast movement capture, and clear location ownership.
How CyberStockroom Supports Multi-Department Parts Visibility
CyberStockroom fits naturally into this discussion because its core model starts from inventory mapping rather than from a flat item list. The platform is designed to help businesses build a live, interactive map of locations and sub-locations, showing inventory across warehouses, rooms, shelves, bins, processes, and other storage points. Its manufacturing-oriented use cases include mapping workflows and production stages, monitoring raw materials, parts, and finished goods, and tracking inventory by project, team, or department across multiple business units. That makes it relevant for plants where parts are spread across several departments but still need to be managed as one controlled environment.
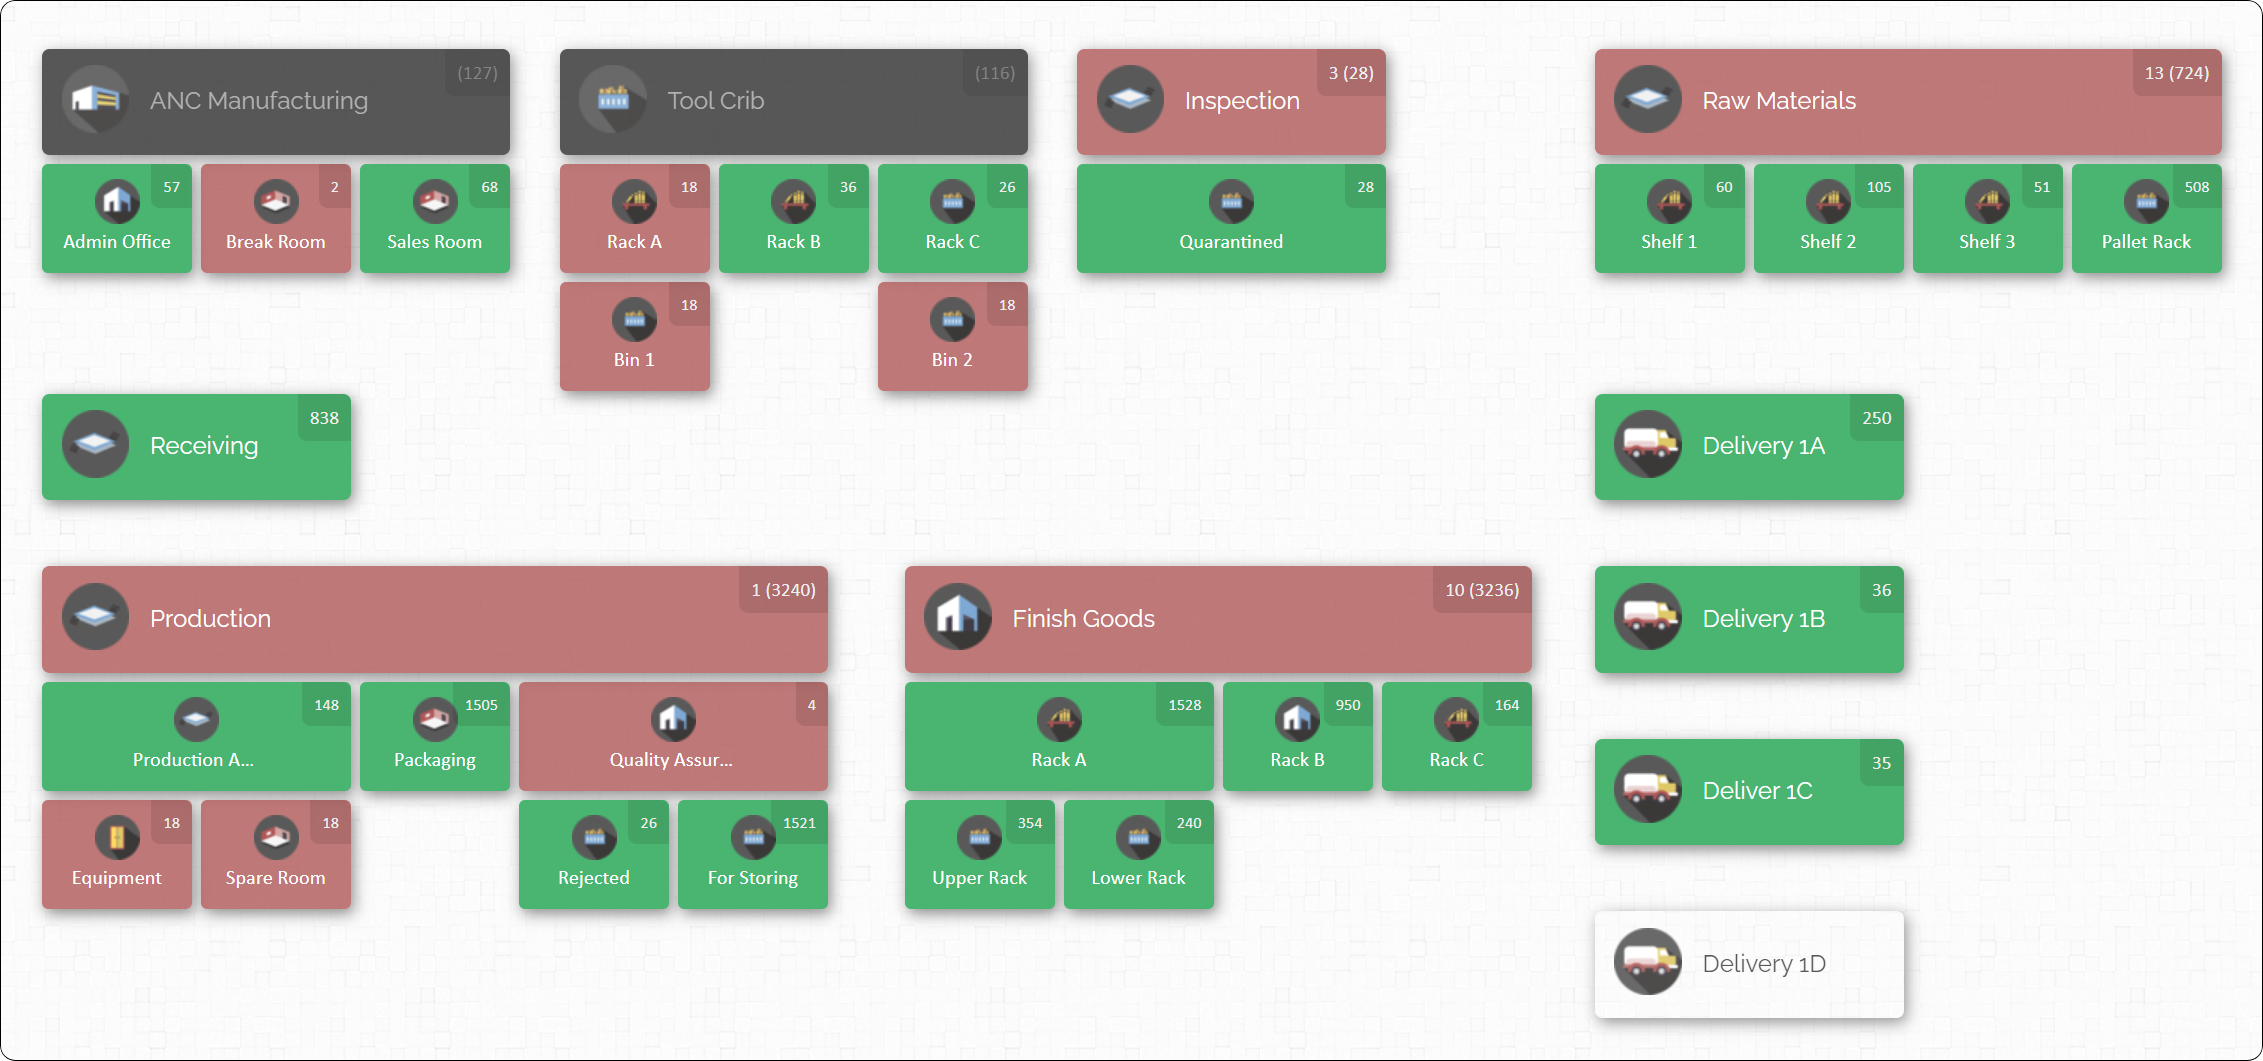
One of the most useful aspects of CyberStockroom for lean operations is that it treats location as a first-class part of inventory control. The map is not an afterthought. It is the dashboard. That matters because many stock issues in manufacturing are not quantity problems alone. They are location problems. CyberStockroom’s location structure lets teams build a layout that reflects the physical reality of buildings, rooms, bins, and other storage points, then use that layout to view quantities, check where products are stored, and drill into any location’s contents. For plants trying to improve parts visibility across departments, this turns the question “How much do we have?” into the more useful question “How much do we have, where exactly is it, and who can act on it?”
That same map-based approach supports lean handoffs. When inventory moves from receiving to inspection, from stores to line-side, from production back to stores, or from one department to another, the movement can be handled through location changes rather than informal side communication. CyberStockroom’s drag-and-drop transfer tools are designed specifically for moving items between locations and sub-locations through an intuitive visual interface, updating stock levels and simplifying relocation. For multi-department parts visibility, this is important because a transfer no longer has to feel like additional clerical burden. The movement itself becomes easier to record in the same visual model everyone is already using.

CyberStockroom also helps with one of the hardest visibility questions in manufacturing: where a given part is distributed across the facility. The product distribution view, described by CyberStockroom as “X-ray vision for your products,” lets users scan or select a product and see where it is distributed, locate items quickly, and assess levels visually. In a plant with departmental stock, this matters a great deal. It gives inventory control, supervisors, and planners a way to spot when one SKU is fragmented across too many storage points, when line-side buffers are drifting upward, or when a supposedly unavailable item is actually present in another mapped area. That kind of product-by-location visibility is especially useful when trying to reduce duplicate stock and standardise replenishment.
Barcoding strengthens this further. CyberStockroom supports barcode scanning for products and locations and notes that users can scan to add products, find them, move them, and perform high-volume transactions such as check-ins, check-outs, and transfers. In a lean manufacturing setting, that supports the best-practice goal of making transactions quick enough to happen at the moment of work. If departments can identify both the item and the destination location quickly, they are less likely to defer updates or rely on memory. That improves accuracy, which in turn improves confidence in the map.
The platform also addresses the problem of differing departmental data needs without breaking the shared view. CyberStockroom supports custom fields, which allows inventory teams to attach structured information that matters in their environment, such as manufacturer, supplier, category, or other attributes. In a manufacturing plant, that can help standardise searches and reporting across functions. Purchasing may search by supplier or manufacturer. Maintenance may group by equipment family. Operations may rely on category or line usage. The key advantage is that these extra details sit inside the same mapped inventory structure, so departments are not forced back into separate side lists.

CyberStockroom is also useful during implementation and expansion because it supports spreadsheet imports and batch operations. Plants moving away from spreadsheets often have a practical problem: the map concept is attractive, but nobody wants to re-enter every item manually. CyberStockroom allows detailed items to be imported from spreadsheets and supports batch edits or bulk location changes, including moving hundreds of items between locations. That capability is especially helpful when cleaning up a legacy stockroom, rolling the system into a second department, or re-mapping locations after a layout change. It reduces the labour required to keep the visual model aligned with the physical one.
For governance, CyberStockroom adds two features that matter in multi-department environments: shared access and activity tracking. The platform allows organisations to share the inventory map with team members and apply access permissions, while its reporting and activity-history capabilities support analysis of movements, stock counts, check-ins, check-outs, and other changes. This combination is valuable because visibility alone is not enough. Plants also need accountability. If a part repeatedly ends up in the wrong place, or if one area generates frequent count corrections, activity history helps identify the pattern instead of leaving teams to argue from memory.
All of this positions CyberStockroom less as a generic stock ledger and more as a practical operating layer for location-driven inventory control. It aligns well with lean manufacturing goals because it makes location clear, makes movement easier to record, makes distribution visible, and gives teams a shared map that matches the way the plant is actually arranged. In other words, it supports the behaviours lean needs: faster recognition, cleaner handoffs, fewer searches, better counting discipline, and stronger coordination across departments that touch the same parts in different ways.
Conclusion
Inventory mapping supports lean manufacturing goals because lean depends on clear flow, disciplined handoffs, standard work, and fast recognition of abnormal conditions. When parts visibility is weak, departments protect themselves with extra stock, manual workarounds, and urgent transfers. Those behaviours may keep work moving for a while, but they also hide waste, distort replenishment, and weaken trust in the system. A map-based, location-led approach corrects that by giving teams a shared view of where parts are, how they are distributed, and what needs action now.
That is why the idea behind visual inventory dashboard lean manufacturing support is so practical. It is not about adding another screen for the sake of reporting. It is about building a working model of the plant that helps inventory control, production, maintenance, quality, and purchasing operate from the same facts. When locations are standardised, movements are easy to record, count discipline is continuous, and critical stock is governed by clear rules, the plant gets closer to what lean is actually trying to achieve: less searching, less waiting, less overstock, fewer surprises, and stronger flow from one department to the next.
CyberStockroom is a strong fit for that goal because it centres inventory control on a visual map of real locations and supports the practical actions that keep multi-department visibility alive: mapped storage, location drill-down, drag-and-drop transfers, barcode-driven transactions, custom fields, product distribution views, reporting, and activity tracking. Used well, those features help inventory teams move beyond reactive stock control and into a more stable, more transparent, and more lean-ready operating system for parts visibility across the entire manufacturing environment.









Leave a Reply