
Managing stock across several buildings requires a blend of clear processes, real-time visibility, and the right tools. Imagine a map-based dashboard that shows each building and storage area, with icons indicating how much of each part or product is stored there. By attaching such an interactive inventory map to your factory plan, staff can instantly see where items are kept. In practice, workers might scan parts and supplies on-site (for example, as they are moved onto trucks or onto shelves), and the data immediately updates a central system.
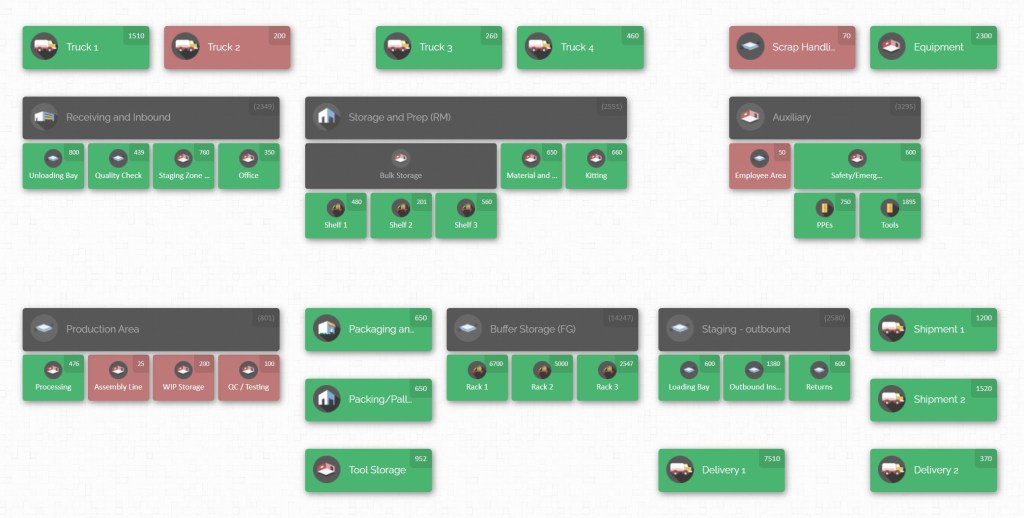
Using this approach, managers get a real-time bird’s-eye view of inventory across all locations. For example, scanning an item in one building instantly shows updated counts on the map, indicating which other building also holds that item and in what quantities. This visual method turns stock data into an easy-to-understand map of your facility, immediately answering questions like “How much do we have, of what, and where?”
Why Multi-Building Inventory is Challenging

When a factory spans multiple buildings or warehouses, managing inventory becomes more complex. Each building may serve different parts of production, carry different kinds of stock, or have unique storage layouts. Coordinating between sites adds layers of difficulty:
- Visibility Gaps: It’s hard to “see” inventory when it’s scattered. You need to know what is in Building A, Building B, etc., at all times. Without good visibility, duplicate orders or stockouts occur. As experts note, a key principle is that you “should know what you have, where it is, and how fast it moves.” Real-time visibility across warehouses (or factory halls) is essential to avoid blind spots.
- Transport Delays: Moving parts between buildings costs time and money. If one building runs low on a component, fulfilling its need from another building means internal shipping. Without careful planning, this can delay production.
- Complex Workflows: Different buildings might handle different production stages. This adds steps: raw materials may arrive at Building A, semi-finished parts go to Building B for machining, and finished goods get stored at Building C. Each transfer point must be tracked and logged.
- Inconsistent Procedures: Without standard procedures, each location might manage stock differently (naming, counting, replenishment rules), causing confusion. For instance, one building might store parts by shelf number, another by order date. Lack of standardization leads to errors and slows down staff.
- Demand Uncertainty: Estimating needs for each building is tricky. An unexpected surge in demand (e.g., a customer rush) or a delayed supplier delivery can cause shortages. Because “unexpected demand” and “supply chain interruptions” can ripple through a multi-building setup, extra safeguards (like safety stock) are often needed.
- Inventory Distribution: Some items may sit idle in one building while needed elsewhere. For example, a fast-moving part might pile up in Building B, while Building A frequently runs low. Without a unified view, it’s easy to have overstock in one place and a stockout in another.
Despite these challenges, best practice methods can overcome them. By applying solid inventory principles (accurate data, classification, forecasting, audits, and logistics planning), a multi-building factory can operate efficiently.
Core Inventory Management Principles

Before diving into multi-location specifics, it’s essential to master fundamental inventory principles. These are building blocks for any efficient system:
- Accurate Record-Keeping: You can’t manage what you don’t measure. Keep reliable data on inventory levels, movements, and usage. Whether it’s in spreadsheets or an inventory system, make sure counts are correct. As one guide puts it, “accuracy is everything”. In practice, use barcodes or IDs on parts, and update stock whenever items move in or out. Consistent data entry prevents “ghost inventory” and unknown shortages.
- Real-Time Visibility: Always know where stock is located. In a multi-building context, this means a central system (or map) that shows inventory by location. With real-time data, you avoid duplicated orders and can quickly see if a needed part is actually in another building. For example, if Production Line 1 in Building A needs 100 screws, a good system would instantly tell you, “Yes, 150 screws are in Building B, zero in A – initiate transfer.” This visibility “helps avoid duplication and keeps production flowing”. Modern tools provide dashboards or maps so managers can see inventory levels at a glance.
- ABC Classification: Not all items are equal. Use ABC analysis to categorize inventory by importance. Typically:
- A-items: High value or critical parts (e.g. expensive machine components). Manage these closely with tight controls and frequent counts. They might be only ~10-20% of item types but ~70-80% of inventory value.
- B-items: Moderate value/volume. These get standard review.
- C-items: Low value or low usage (e.g. cheap hardware). These make up many SKUs but little value. By focusing efforts on A-items (for example, placing them in easily accessible spots in each building and tracking them very carefully), you ensure the most business-critical parts are never missed. C-items can be given simpler controls to save effort.
- Demand Forecasting: Use sales history, production plans, and market trends to predict needs for each building. Base ordering on data, not guesswork. For instance, if a component has seasonal demand, increase stock in advance. Regularly review forecasts and adjust orders as demand or production schedules change. Good forecasts prevent overstocking some sites and understocking others.
- Economic Order Quantity (EOQ) & Reorder Points: Compute an optimal order size to minimize total costs. The EOQ formula balances ordering cost vs. holding cost, telling you how much to reorder at once. Similarly, set Reorder Points (ROP) and safety stock for each part:
- Reorder Point (ROP): The inventory level at which a new order should be placed. It’s based on lead time and demand, so you never run out.
- Safety Stock: Extra buffer stock. Especially in a multi-site scenario, shipments might take longer. If your supplier delays, the extra stock prevents an immediate stockout. Safety stock should be calculated from variability in demand and supply, not just a guess. For example, if Building B needs 500 units/month and lead time is 2 weeks, you might reorder when 250 are left (ensuring enough on hand for two-week delivery). Adding a safety cushion (say 50 units) handles surprises.
- Cycle Counting & Audits: Instead of shutting down operations for annual counts, regularly count small subsets of inventory (often starting with A-items). This keeps data accurate continuously. In a multi-building plant, schedule cycle counts in each building on a rotating basis. If discrepancies appear (e.g. the count doesn’t match the system), investigate immediately to correct processes. Regular audits across locations ensure accuracy and build confidence that the digital map reflects reality.
- Standardised Processes and Location Labelling: Create clear, documented procedures for how to receive, store, pick, and transfer items. Use consistent location codes. For example, identify each bin or shelf with a label like “BldgA-Rack3-Level2-BinA” so anyone can find it on a map. Standardizing reduces mistakes; when every worker follows the same method (no matter the building), errors drop and training becomes easier. In fact, one guide emphasizes that clear bin locations and procedures “reduce errors and speed up operations”.
- Supplier Relationships: Develop partnerships with reliable suppliers. When you trust your suppliers, you can lean on shorter lead times and flexible deliveries. Share your demand forecasts with them so they can plan (some modern factories even share inventory data with suppliers to auto-trigger replenishments). Strong supplier ties help avoid last-minute shortages. For critical parts, having multiple vendors can also reduce risk if one supplier has an issue.
Implementing these core practices builds a solid foundation. With accurate data and disciplined processes, you can layer on advanced strategies tailored to multiple buildings.
Multi-Building Inventory Strategies
Once fundamentals are in place, focus on strategies specific to a multi-building factory:
Centralized versus Distributed Stock
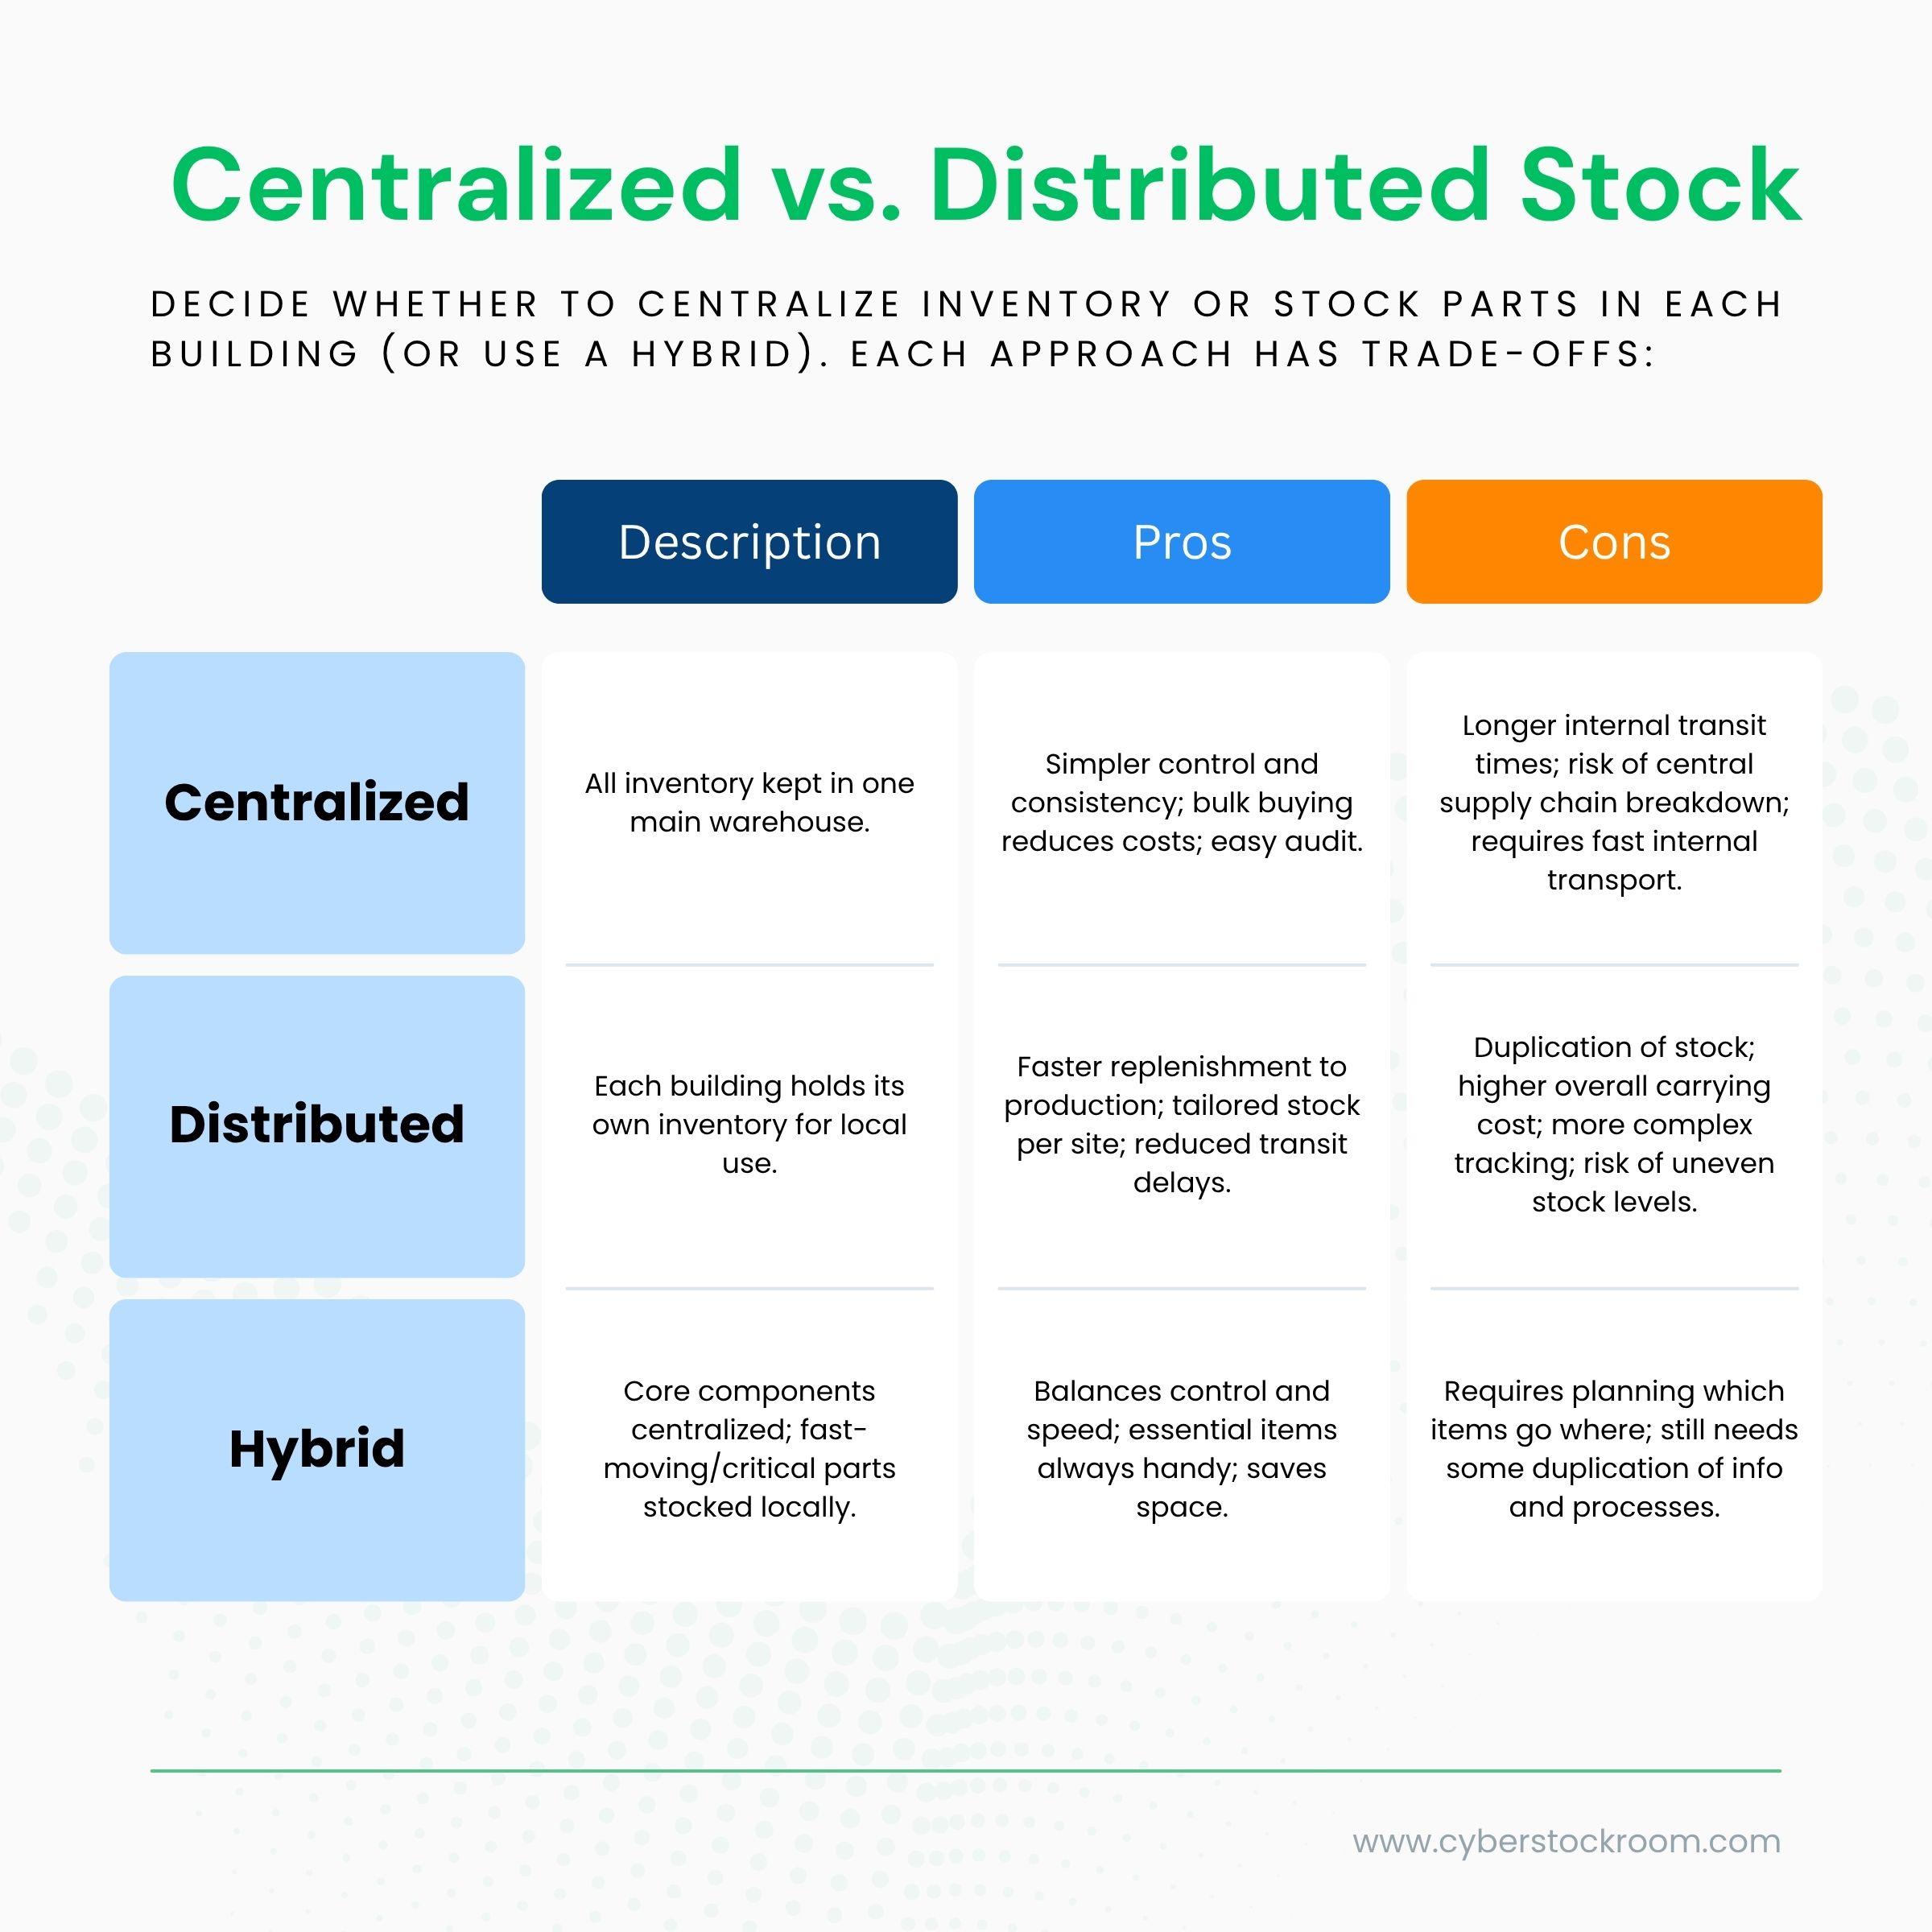
For example, a factory might keep all raw materials (sheet metal, chemicals) in one main warehouse, while storing final assembly parts (screws, motors) in bins inside each hall. The main warehouse issues bulk supplies to each building on a schedule. This way, major stocking is centralized (cost-efficient), but day-to-day usage items are distributed for quick access.
Inventory Mapping Across Buildings
Treat each building (and subarea within it) as a “location” on your inventory map. This logical map might list: Building A – Mezzanine, Building A – Floor 1, Building B – Storage Room, etc. By visualising these on one screen, staff can click on Building C and instantly see its contents (part numbers, quantities, pictures).
A map turns raw data into an intuitive layout of your site. If you need an obscure part, the map shows exactly which building to go to, eliminating guesswork.
Scheduled Transfers and Logistics
Coordinate internal supply runs. Common approaches:
- Milk-Run Deliveries: Set regular rounds where a truck (or forklift convoy) moves between buildings on a fixed route. It picks up needed stock from the central store, drops off parts at each workshop, and returns with returns or empties. This reduces random rush deliveries and spreads transport workload evenly. Plan routes to minimize travel time (e.g. always loop through buildings in a logical order).
- On-Demand Shuttles: For urgent needs, have a flexible system for a quick transfer (e.g. service requests in the inventory app). The map-based system can even show a dock location; once inventory is marked for transfer, a forklift operator is alerted to pick it up.
- Cross-Docking: If raw materials come in one door and directly feed a line in another building, avoid intermediate storage. Move these materials straight from Receiving to the consuming site, updating the inventory map en route. This quick flow saves space.
- Kanban Between Buildings: In lean setups, use Kanban cards or triggers. For example, when Bin A on an assembly line in Building 2 empties, it automatically signals a refill from the main stock in Building 1. The digital map can generate such alerts when counts drop below thresholds.
Each logistic method must be documented. Who moves what, and when? Use the system’s workflow or checklist: e.g., “When Building A signals low on Part X, Building B’s stockman must transfer Y units on the next run.” Clearly define which building replenishes which.
Space and Layout Optimization

Use each building’s space wisely:
- Dedicated Zones: Group similar items together. For example, chemicals in one building section, mechanical parts in another. Logical zoning makes counting and picking faster.
- Compact Storage: Especially in small buildings, use vertical shelving or high-density racks to maximise capacity. Keep aisle widths appropriate for equipment.
- Utilize Tracking Tools: Barcode or RFID tags on bins help locate items. Attach identifiers (like QR codes) on maps too so workers can match real shelves to digital locations.
By planning the physical layout – and reflecting it in the digital map – you ensure that what you see on screen matches reality. That alignment cuts down wasted motion and misplaced items.
Contingency Planning
Prepare for problems:
- Redundancy: For critical parts, consider holding extra buffer stock in a secondary building. If your primary storage is inaccessible, the backup kicks in.
- Alternate Sourcing: Know backup suppliers for key materials. If one line of your factory uses a special fastener and that supplier fails, have a plan to borrow stock from another building or use a substitute part.
- Regular Audits: As mentioned, schedule checks. For example, every quarter, randomly pick a few items across buildings and count them. If discrepancies are found, revise the process or retrain staff.
Leveraging Technology: CyberStockroom Inventory Mapping
A visual inventory management platform can tie all these strategies together. CyberStockroom, for instance, is a cloud-based tool built around a map dashboard. Its features illustrate what’s possible for multi-building inventory:
- Unlimited Locations & Sublocations: You can create any number of locations and sub-locations to match your facility’s layout. Treat each building, floor, aisle, or storage bin as a “node” on the map. This flexibility lets your digital map mirror the actual factory. You can even rearrange the map (drag areas around) so the on-screen layout matches how you think of your space.
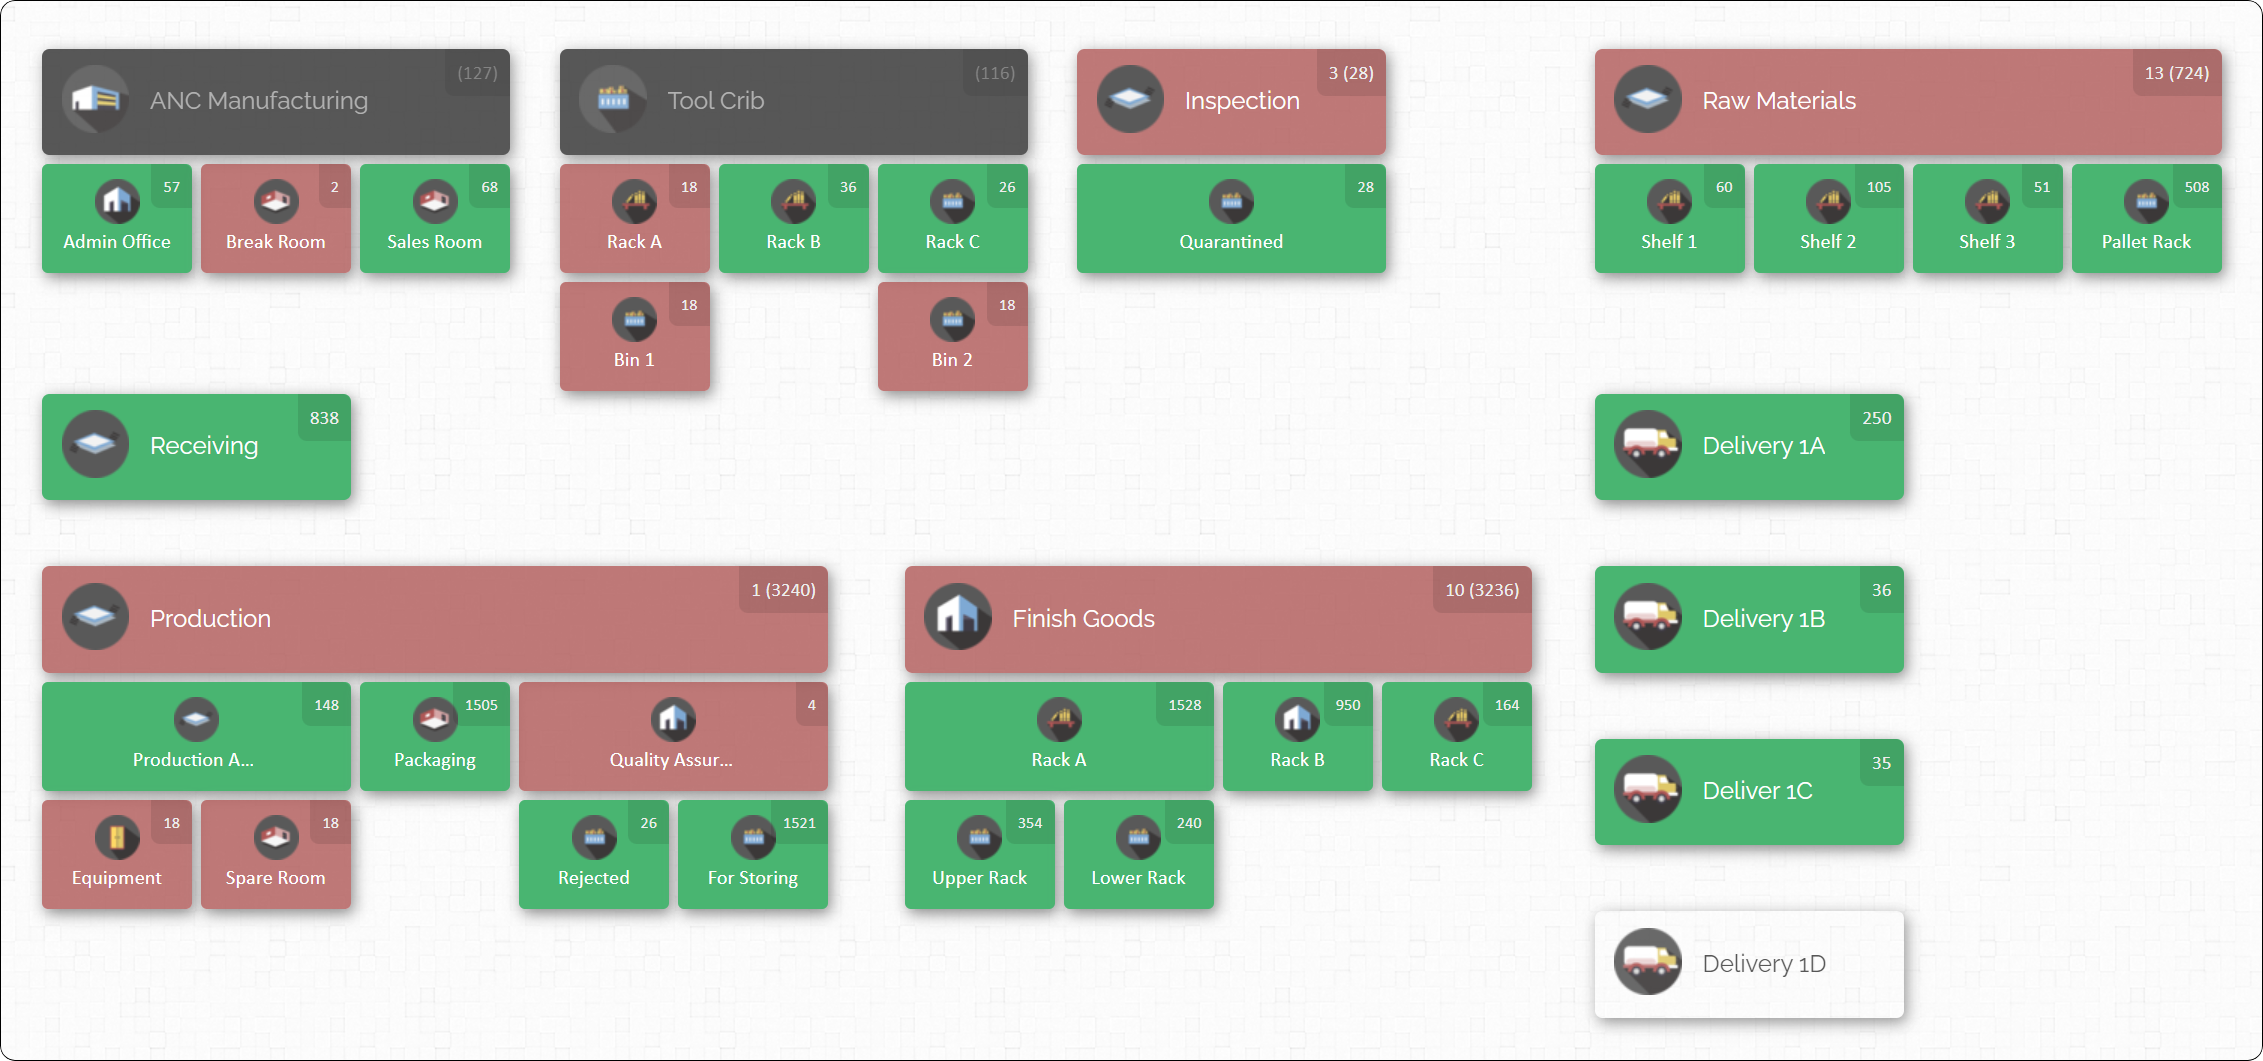
- Visual Inventory Map: Once set up, you “see your inventory like never before,” as a true bird’s-eye view. Clicking on a building icon shows all items and quantities there. This makes understanding stock levels intuitive. For example, it becomes obvious at a glance if Building 2 has plenty of Widget A while Building 1 is nearly empty, eliminating any need to consult spreadsheets.
- Drag-and-Drop Transfers: Moving stock is as simple as dragging it on the map. If someone moves items from Building A to Building B, an operator can just drag the product icon from A to B on-screen. The system records this transfer instantly. It also supports quick cycle counts: click an item in a location and update its quantity or scan new stock. The key is that your inventory levels update without paperwork – and you get a complete history of who moved what, when.
- X-Ray Product Distribution: A standout feature is the “X-ray” view: you pick a product and instantly see its distribution across all locations. Want to know “How many gearboxes do we have and where?” The map highlights every site with gearboxes and the count at each. This visual traceability helps managers balance stock – for example, reallocating surplus from one hall to a shortage in another in real time.
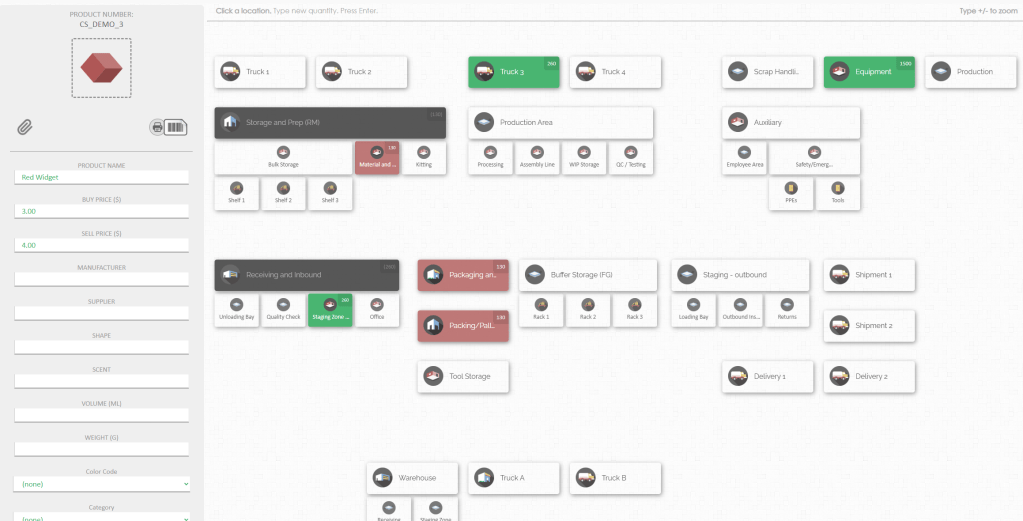
- Flexible Item Data: CyberStockroom lets you attach rich data to each SKU. You can scan barcodes to add parts, use spreadsheets to bulk import catalogs, and even attach photos or serial numbers for clarity. For instance, you might snap a photo of a custom tool and attach it so staff instantly identify it. Custom fields (like size, supplier, or batch) can be defined per item, making searches and filters easy.
- Cloud-Based Access: As a cloud solution, it is accessible from any internet-connected device. Floor managers or warehouse staff can log in via browser to update counts or review stock. The cloud architecture also ensures security and backups – your data is stored on a reliable server infrastructure.

By integrating such a mapping tool, the factory gains a “single source of truth” for inventory. Instead of Excel sheets per building, all locations feed one map. The data syncs automatically, so when goods move or counts change in one building, the map reflects it everywhere. This unified visibility greatly aids decision-making: managers see immediately if a part is stuck in stock in one building when needed in another, and can act before production is delayed.
Importantly, CyberStockroom is purely an inventory system – it doesn’t pretend to be a full ERP or maintenance tool. It keeps focus on mapping, counting, and tracking parts. (For example, it does not include a standalone accounting module, manufacturing scheduling, or an on-site mobile app. It simply organizes and visualises your inventory.) This clarity of purpose means it’s easier to adopt; you won’t be confused by unused features.
In summary, a visual map-based inventory platform ties in perfectly with multi-building best practices. It enforces location labeling, supports cycle counts with barcodes, tracks transfers with drag-and-drop ease, and always shows where each item is. As one customer put it, it makes it “easy to find parts…easy to check in and check out stuff from inventory”. When every building’s stock appears on one map, managing a sprawling factory becomes far more manageable.

Implementation Checklist and Timeline
Putting a multi-building inventory system into place takes planning. The steps below outline a practical rollout:
- Assessment & Planning (Weeks 1–4):
- Audit current inventory practices: how does each building receive, store, and issue stock? What systems (even spreadsheets) do they use? Note variations.
- Identify locations: List every building, warehouse, and storage area. Sketch initial maps/floor plans.
- Define goals: Decide which products to map first (e.g. start with high-turnover items), and what metrics (accuracy, stockouts) you aim to improve.
- Choose tools: Confirm that your chosen software (like CyberStockroom) supports the needed features and user count.
- Design & Setup (Weeks 5–8):
- Map Creation: Using the tool, create location hierarchies. For each building, draw a map or layout. Label areas (Receiving, Aisle 1, etc) to match the physical site.
- Data Import: Gather item master data (names, SKUs, barcodes, unit count). Import initial stock counts (via spreadsheet or scanner) to populate the system. Ensure consistent naming across buildings.
- Process Definition: Establish standard operating procedures: How will staff check items in/out? Where will transfers be logged? What triggers a reorder? Document these clearly.
- Permissions & Training Prep: Set up user accounts and roles. Prepare training materials (e.g. quick how-to guides or checklists) on using the map system.
- Pilot Rollout (Weeks 9–12):
- Staff Training: Train key personnel in one building or area first. Show them how to use the map, perform counts, and record movements.
- Trial Runs: Run a pilot for a subset of inventory (e.g. raw materials or a specific product line). Let staff work through actual tasks (receiving a delivery, transferring stock to another building, doing a cycle count).
- Feedback & Adjust: Gather feedback from users. Are map labels clear? Are counts accurate? Tweak processes, update map layouts, or correct data entry errors.
- Full Deployment (Weeks 13–16):
- Expand to All Areas: Gradually add the remaining buildings and product categories. Continue training staff in each location.
- Routine Integration: Make map updates part of daily routines. For example, include quick map checks in morning meetings. Encourage staff to record moves immediately (scanning barcodes or tapping in the app).
- Monitor Metrics: Track key indicators: inventory accuracy, number of stockouts, stock turnover rates. These will show the system’s impact over time.
- Review & Continuous Improvement (Ongoing):
- Regularly audit: Continue cycle counts as routine (e.g. monthly or quarterly). Use map reports to spot discrepancies.
- Optimize stock placement: After some months, you may see patterns (e.g. certain parts constantly moved). Consider reassigning stock locations (maybe move a fast-moving part’s stock to a more convenient building).
- Update reorders: Refine reorder points and forecasts based on new demand data.
- Gather user feedback: Keep an open channel for suggestions on the system or processes. The closer the system fits your factory’s way of working, the more effective it will be.
The Real Goal: Accessible Inventory

The biggest shift in multi-building inventory management is understanding this:
Inventory problems are rarely about quantity.
They are about accessibility.
If your team cannot quickly find and use inventory, it might as well not exist.
A well-structured system ensures that:
- Inventory is visible
- Locations are clear
- Movement is controlled
- Data is accurate
When all of these come together, the entire operation becomes more efficient.
Final Thoughts
Managing inventory across a multi-building factory is complex, but it does not have to be chaotic. With the right structure, clear processes, and a visual system that connects everything, inventory becomes easier to manage and easier to trust.
Instead of reacting to problems, your team gains control.
Instead of searching for inventory, they find it instantly.
And instead of guessing, they make decisions based on real, reliable data.
That is what effective inventory management looks like at scale.


Leave a comment