
Inventory is the lifeblood of any industrial operation – whether you run a manufacturing plant, a construction business, or a warehouse distribution center. Inventory management refers to the processes and strategies used to track, store, and control your stock of materials and products.
For industrial teams, mastering the basics of inventory management is crucial to keep production running smoothly, fulfill customer demand on time, and minimize costs. In this comprehensive guide, we’ll break down the fundamental terms and concepts of inventory management in an industrial context. By the end, you’ll have a solid grasp of inventory management 101 and how these principles apply to your operations.
What Is Inventory Management and Why Does It Matter?
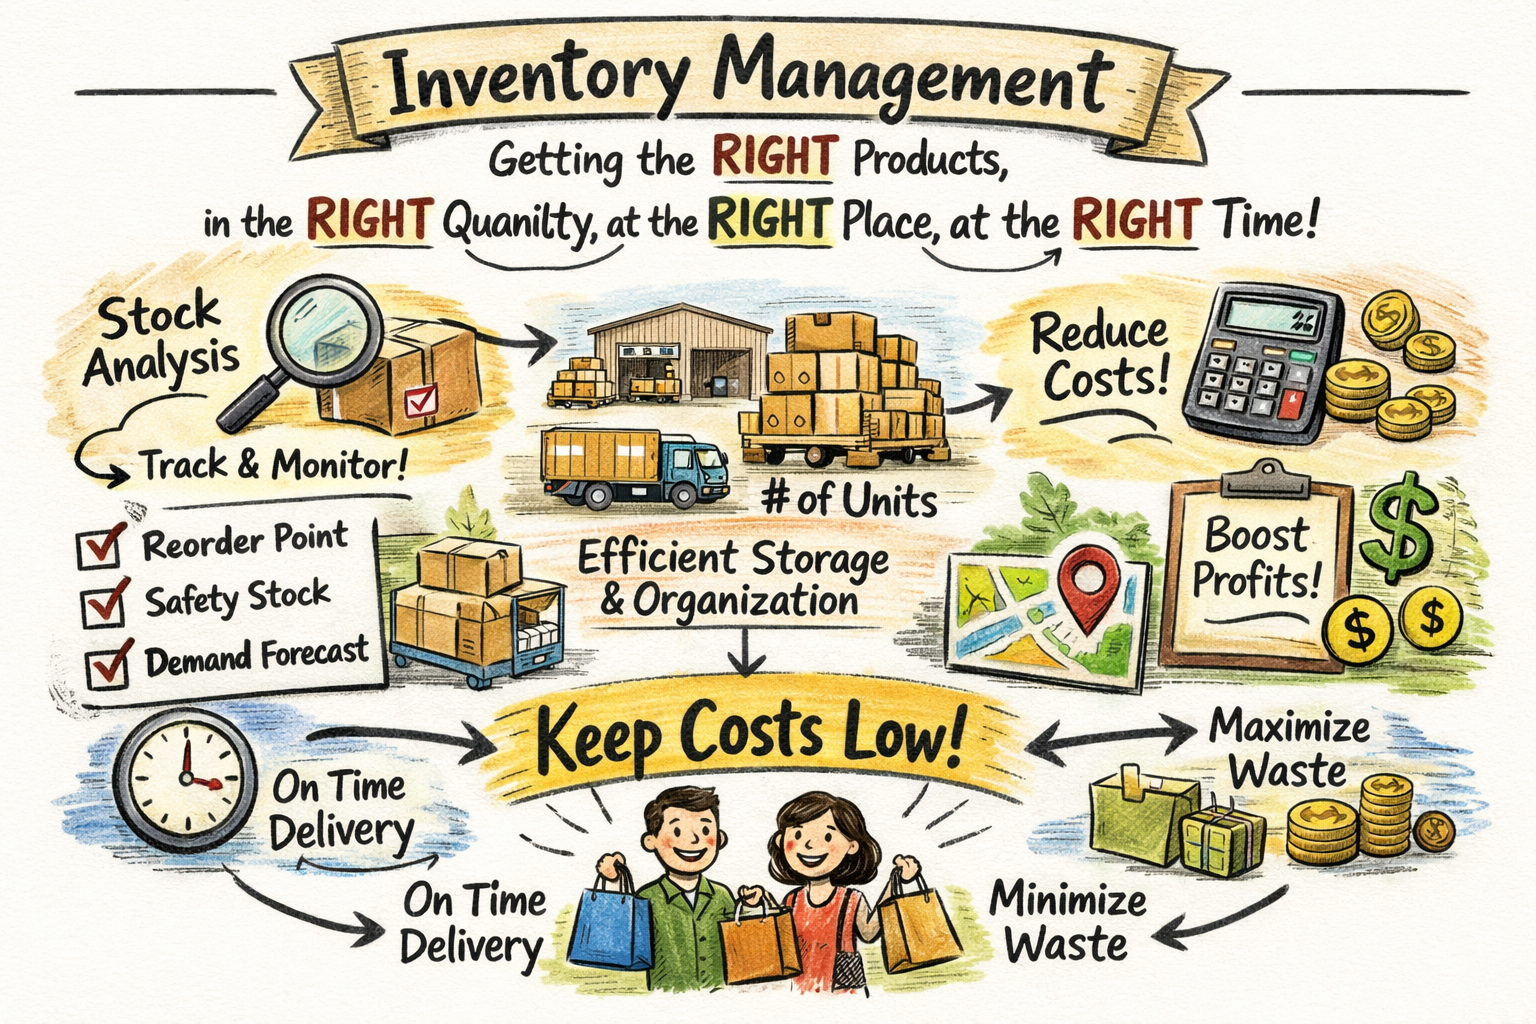
Inventory management is the practice of having the right products in the right quantity at the right place and right time – all while keeping costs as low as possible. It sounds simple, but it’s a balancing act that industrial companies must perform every day. Too much inventory ties up capital and incurs storage costs, while too little inventory can halt production or delay deliveries. Effective inventory management ensures that you can meet production schedules and customer orders without stockouts (running out of an item) or overstocking (piling up excess goods). For industrial teams, this means coordinating procurement, production, and warehousing so that materials flow smoothly through the supply chain.
Why is inventory management so critical?
Consider a manufacturing line waiting on a missing part – every minute of downtime is lost productivity and revenue. Conversely, imagine a warehouse overstuffed with unsold spare parts – that’s money gathering dust and risk of spoilage or obsolescence. Good inventory management strikes the optimal balance. It reduces stockouts that can stop operations, and avoids excess inventory that inflates carrying costs (the expenses of holding and storing stock). In short, mastering inventory management leads to lower costs, better cash flow, and the ability to deliver on promises to customers consistently. It turns inventory from a potential liability into a competitive advantage.
Types of Inventory in Industrial Operations
In industrial settings, “inventory” isn’t just finished products. It spans everything from raw inputs to work in progress on the factory floor. Understanding the different types of inventory will help you manage each appropriately:
| Inventory Type | Description | Examples |
| Raw Materials & Components | The base materials and parts used to manufacture your products. Raw inventory is acquired from suppliers and stored until needed for production. | Steel, lumber, chemicals, electronic components, fabric, fasteners. |
| Work-in-Progress (WIP) | Items that are currently in production but not yet finished goods. WIP inventory is the half-assembled or in-process materials moving through your shop or plant. | A circuit board mid-assembly, a vehicle on the assembly line lacking tires, baked goods in the oven. |
| Finished Goods | Final products ready for sale or delivery to customers. These have completed the production process (or were purchased finished) and await shipment or customer pickup. | Completed machinery, packaged consumer products, ready-to-ship spare parts. |
| MRO & Supplies | Maintenance, Repair, and Operations supplies – items not part of final products but necessary to keep the business running. This includes spare parts for equipment, tools, lubricants, safety stock of consumables, etc. | Factory machine spare parts, cleaning supplies, tooling, lubricants, light bulbs for the facility. |
| Packaging & Other | Packaging materials and other ancillary inventory that supports production or distribution. | Boxes, pallets, labels, packing foam, containers. |
Each type of inventory needs attention. Raw materials must be available when production needs them. WIP should flow without bottlenecks – too much WIP might signal a production slowdown, while too little might mean an idle line. Finished goods inventory should match customer demand: in manufacturing B2B contexts, this might be kept low and made-to-order, whereas in distribution you might stockpile popular items. MRO supplies ensure you don’t suffer downtime waiting for a replacement part or tool. Knowing your inventory categories helps you apply the right controls and optimize each stage of your operations.
Fundamental Inventory Terms and Definitions
Industrial teams often encounter a lot of jargon when managing inventory. Let’s demystify some key inventory management terms you should know:
SKU (Stock Keeping Unit)
SKU is a unique identifier for each distinct item in your inventory. It’s typically an alphanumeric code that your company assigns to a product or part. Think of SKUs as the fingerprint of an item – no two products have the same SKU if they differ by any attribute (size, color, model, etc.). SKUs are used to track inventory levels and organize stock. For example, a 2-inch steel bolt might have SKU ST-BOLT-2IN, while a 3-inch bolt is ST-BOLT-3IN. By using SKUs in combination with barcodes or QR codes on labels, warehouse staff can quickly scan items, update counts, and locate products. Why it matters: SKUs enable accurate tracking of thousands of items, help avoid confusion between similar parts, and allow for efficient reordering and reporting on a per-item basis.
Lead Time
In inventory speak, lead time refers to the time it takes from initiating a purchase order to receiving the goods. This includes the supplier’s processing time and transit time to your facility. For instance, if it takes 2 weeks for a new batch of raw material to arrive after you place an order, that product has a two-week lead time. Lead times are critical when planning your inventory levels – long lead times mean you need to order well in advance and possibly keep more safety stock on hand. Short lead times allow more agility. Lead times can vary widely: locally sourced components might arrive in days, whereas overseas shipments could take months. Managing and reducing lead time where possible (through closer suppliers, faster shipping, or better supplier relationships) is a common goal to help you respond quickly to demand and avoid production delays.
Reorder Point (ROP)
A reorder point is the stock level at which you should trigger a replenishment order to restock an item. Think of it as the minimum acceptable inventory before you need to get more. The reorder point for each item will depend on its consumption rate (demand) and its lead time. For example, imagine you use 100 units of a part per week and the lead time to get more is 2 weeks. You’d set a reorder point a bit above 200 units (2 weeks * 100 units/week), perhaps adding some buffer – so maybe at 250 units you reorder. When inventory drops to that threshold, it’s time to purchase or produce more. Why use an ROP? Because it helps ensure you replenish before you run out, accounting for the fact that while new stock is on the way, you’ll still be using what’s left. Each product’s reorder point will differ. Fast-moving items or those with lengthy lead times will have higher ROPs than slow movers or quick-delivery items. Calculating and monitoring reorder points is fundamental in preventing stockouts in an industrial setting.
Safety Stock
If your forecast says you need 500 units for the next month, you might keep 600 units by having 100 as safety stock. That way, if a supplier shipment is late or production outputs fall short, you have some cushion. Safety stock is especially important for critical items that would halt operations if depleted (e.g. a specific component with no substitute). While maintaining safety stock does tie up a bit more capital and storage space, it is a small price for avoiding the huge cost of a line-down situation or unfulfilled customer orders. The trick is to set the right safety stock level – enough to cover variability, but not so much that it becomes excessive inventory. This often involves looking at historical usage fluctuations and supplier reliability. For industrial teams, safety stock provides peace of mind that you can weather the unexpected blips in supply or demand.
Stockout
A stockout occurs when you completely run out of a particular item. In other words, demand (or usage) has exceeded supply on hand, and there’s none left in inventory. Stockouts are something every inventory manager tries hard to avoid, because they can have serious consequences in industrial operations. If you stock out of a raw material or component, production might grind to a halt while you scramble to expedite more. If you stock out of a finished product that customers are waiting for, you’ll face delayed shipments, unhappy customers, or lost sales to competitors. Stockouts typically happen due to factors like underestimating demand, not reordering on time, supplier failures, or inaccurate inventory records. Preventing stockouts is a core goal of inventory management. Strategies like setting proper reorder points and safety stocks (discussed above), as well as maintaining accurate real-time inventory tracking, all help minimize the risk. It’s worth noting that the opposite problem – overstock (having too much inventory) – is also a concern, as it ties up funds and storage space. Effective inventory management is about avoiding both extremes by planning and monitoring stock levels carefully.
Work-in-Progress (WIP) and Cycle Counts
While not a single term, it’s important to highlight how industrial teams keep track of partially completed goods and ensure inventory accuracy over time:
- Work-in-Progress (WIP): As mentioned in the inventory types, WIP refers to items on the production floor that are between raw and finished. Managing WIP is about knowing what’s currently being built, assembled, or processed. Clear visibility into WIP inventory helps production managers identify bottlenecks and understand how close items are to completion. It’s an often overlooked aspect of inventory – you don’t want too much money tied up in half-built products that sit idle. Techniques like kanban boards or production tracking software can help monitor WIP stages.
- Cycle Counting: A cycle count is a periodic counting of a subset of inventory, rather than a full wall-to-wall physical inventory count. Instead of shutting down operations once a year to count everything, many industrial teams do cycle counts of a few items each day or week on a rotating schedule. Over time, every SKU gets counted, just in smaller chunks. For example, you might count 5 different parts every weekday such that each part is verified at least once a quarter. Cycle counting helps catch discrepancies (due to misplacement, theft, or recording errors) early and keeps inventory records accurate without big disruptions. It’s less disruptive than an annual inventory audit and can be focused on high-value or fast-moving items more frequently. If discrepancies are found, you can investigate and correct root causes (such as retraining staff on transaction procedures or fixing system errors). Regular cycle counts are a best practice to maintain high inventory accuracy, which underpins all other inventory management efforts.
Dead Stock (Obsolete Inventory)

Dead stock refers to items in your inventory that haven’t sold or been used in a long time and are unlikely to ever be used. These are essentially obsolete or expired items that just sit on shelves, taking up space and capital. In an industrial context, dead stock could be spare parts for a machine you no longer use, old-version products that have been replaced by newer models, or raw materials for a discontinued product line. Dead stock is problematic because it ties up money and storage, and it may eventually have to be written off as a loss if it cannot be repurposed or sold at a discount.
One of the goals of effective inventory management is to minimize the creation of dead stock – by forecasting properly, managing product lifecycles, and occasionally doing clearance of slow movers. Keeping an eye on inventory reports for items with zero or very low usage over months can help identify potential dead stock. You can then decide whether to scrap them, find alternative uses, or implement a sale to recover at least some value. The presence of a lot of dead stock often signals poor inventory planning or lack of agility in responding to market changes.
Carrying Costs (Holding Costs)
Every item in your warehouse has a hidden cost beyond its purchase price – these are the carrying costs (or holding costs) of inventory. Carrying cost is the total expense of storing and maintaining inventory over time. It typically includes: warehousing space and utilities, insurance, security, labor for handling, and the cost of capital tied up (opportunity cost), as well as depreciation or spoilage. In many industries, carrying costs can run about 20–30% of the inventory’s value per year. For example, if you hold an average of $1,000,000 in inventory, you might be spending $200,000+ annually to keep it stored. That’s significant! Reducing unnecessary inventory directly reduces these carrying costs. This is why lean inventory approaches (like Just-In-Time, discussed later) are popular – less inventory on hand means less money spent holding it. However, if you cut too deep and don’t have enough stock, the cost of stockouts could outweigh the savings. So again, it’s a balancing act. Knowing your approximate carrying cost percentage can help in decisions like: should we produce/buy in bulk (and incur holding costs) to get a volume discount, or order smaller batches more frequently? It also underscores the importance of eliminating excess and obsolete inventory – since they silently drain resources. In short, carrying cost is a key concept connecting inventory levels to financial performance.
Inventory Management Techniques and Strategies
Now that we’ve covered fundamental terms, let’s look at some popular techniques and strategies industrial teams use to control inventory efficiently. These concepts guide how you manage stock levels, fulfill demand, and optimize the flow of goods:
First-In, First-Out (FIFO) vs. Last-In, First-Out (LIFO)
These two terms describe strategies for the order in which inventory is used or sold, especially when dealing with multiple batches of the same item:
- FIFO (First-In, First-Out): Under FIFO, the oldest inventory (first in) is used first (first out). This is the most common approach in both accounting and practical storage for perishable or time-sensitive goods. In an industrial setting, FIFO ensures that items don’t sit so long that they expire, become obsolete, or degrade. For example, imagine you have batches of lubricating oil drums received in January and again in March. Using FIFO, you would use up the January batch before starting on the March batch. This way, the oldest stock clears out first. FIFO is especially important for anything with an expiration date (chemicals, food ingredients, pharmaceuticals) and is generally a sound practice to keep inventory fresh.
- LIFO (Last-In, First-Out): Under LIFO, you assume the newest inventory is used first. This method is not commonly practiced in physical flow (except maybe in a stack where you load new items on top and use from top). It has been used in some accounting systems for valuation during inflation (since newer costs are matched against current revenues), but many countries do not allow LIFO accounting anymore. From a practical standpoint in industrial operations, LIFO could lead to older stock never getting used and going bad. Unless there’s a specific reason (like a deliberate financial accounting strategy or storage limitation that forces last-in usage), FIFO is generally preferred in actual inventory handling. In short: know the terms, but in day-to-day operations, FIFO will usually be your friend to maintain product quality and accurate rotation.
(One related concept is FEFO (First-Expired, First-Out), a variant of FIFO focusing on expiration dates – ensuring the item with the earliest expiration is used first, even if it wasn’t the very first in. This is crucial in industries like food & beverage or chemicals.)
Just-In-Time (JIT)
Just-In-Time is a strategy where you aim to keep as little inventory on hand as possible, receiving goods right when you need them for production or sales. The philosophy of JIT, which originated in Toyota’s manufacturing system, is to reduce waste by not holding any surplus – materials arrive “just in time” to be used. For industrial teams, implementing JIT means very tight coordination with suppliers and finely tuned production schedules. For example, if you assemble machines and adopt JIT, you would schedule deliveries of parts to show up maybe daily or weekly in the exact quantities needed for that period’s production, rather than buying them months in advance and stockpiling. The benefit is drastically lower inventory holding costs and less risk of obsolete stock, as well as quickly identifying any process issues (because a delay immediately impacts production). However, JIT comes with risks: if any part of the supply chain falters – a late truck, a quality issue, a sudden spike in demand – you can face immediate shortages since there’s little buffer. Essentially, JIT trades inventory buffer for efficiency and cost savings. Many manufacturers use elements of JIT (keeping inventory lean) without going to extremes. A successful JIT implementation usually requires reliable suppliers, strong contingency plans, and sometimes technology like automated inventory alerts and vendor-managed inventory. It’s a powerful concept to know, illustrating the ideal of running super-lean, but it must be managed carefully to avoid leaving your operation high and dry.
ABC Analysis

Not all inventory is equally important. ABC analysis is a method of categorizing inventory items into three groups (A, B, and C) based on their importance, usually measured by value or usage frequency:
- “A” items – the most valuable items or those that make up the bulk of your inventory value, even if they are smaller in quantity. These could be high-cost components or top-selling finished products. Typically, A items might be the top 20% of items that account for 80% of the value (the classic 80/20 rule).
- “B” items – moderately valuable or middle-of-the-pack items. They’re important but not as critical as A items. Perhaps the next 30% of items that account for, say, 15% of value.
- “C” items – the low-value or plentiful items. Individually, they don’t cost much and might be things like screws, nuts, or inexpensive MRO supplies. They could be 50% of your item count but only 5% of total inventory value.
Why categorize this way? Because it helps focus your attention and resources. A-items might warrant very tight control – frequent cycle counts, secure storage, detailed forecasting – since any issue with them has big impact. C-items, on the other hand, can be managed with simpler methods (maybe bulk orders and a larger safety stock since they’re cheap, or fewer cycle counts) because the risk associated with them is lower. B-items get moderate attention. ABC analysis essentially tells you where to prioritize: for example, a $10,000 machine part (A-item) needs careful monitoring, whereas a $0.10 bolt (C-item) can be stocked in large volume with a simple bin system. Many inventory software systems allow tagging items by A/B/C categories for reporting and control purposes. This concept helps industrial teams manage time and effort efficiently by not treating a high-value engine and a box of gloves with the exact same rigor.
Economic Order Quantity (EOQ)
The Economic Order Quantity is a classic formula-based concept that answers the question: “How much should we order at a time to minimize total costs?” The EOQ model finds the ideal order size that balances two opposing cost forces: ordering costs (the fixed cost each time you place an order or set up a production run) and holding costs (the carrying cost of inventory we discussed). If you order very frequently in small batches, your holding cost is low but you incur a lot of ordering costs. If you order in huge batches, you minimize ordering frequency but incur high holding costs. EOQ gives the sweet spot mathematically where the sum of ordering and holding costs is lowest.
Without going deep into math, the EOQ formula is:
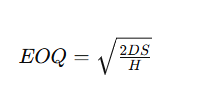
Where:
- D is the annual demand (units per year),
- S is the cost of placing one order (or setup cost for production),
- H is the annual holding cost per unit (often the unit cost * carrying cost rate).
The result is the number of units you should order each time. For example, if you consume 10,000 units a year of a part, it costs $50 each time to place an order, and holding one unit for a year costs $2, EOQ would be √(21000050/2) = √(500000) ≈ 707 units. So you’d order in lots of 707 units ideally. Why care about EOQ? For industrial operations ordering raw materials or parts, EOQ provides a data-driven starting point for order size that minimizes waste. It might suggest, for instance, that ordering very large shipments (to get bulk discount) isn’t actually cheapest overall if carrying costs are high – or conversely, that you shouldn’t order too tiny batches either. Many companies use EOQ as a baseline and then adjust for practical considerations (e.g. supplier lot sizes, storage constraints, or fluctuating demand). Even if you don’t calculate it exactly, understanding the principle helps you appreciate the trade-off between ordering more often versus holding inventory longer.
Min-Max System and Two-Bin System
These are simple yet effective inventory control practices often used on the shop floor or stockroom:
- Min-Max (Level) System: For each item, you establish a “min” (minimum) and “max” level. The min is effectively like a reorder point – when stock falls to this level, it triggers an order. The max is the target stock level you replenish up to. For example, you might set a min of 50 and max of 150 for a certain bolt. When inventory drops to 50, you reorder enough to bring it back to 150. This system gives a straightforward rule for replenishment and prevents over-ordering beyond what you can use within a cycle.
- Two-Bin System: This is a visual version of min-max commonly used for inexpensive C-class items (like screws, gaskets, etc.). You keep inventory in two bins. Items are consumed from one bin until it’s empty; at that point, you trigger a reorder and start using from the second bin. The empty bin gets refilled and becomes the backup when the second bin (now in use) empties. Essentially, the first bin’s quantity is set equal to the amount you expect to use during the lead time plus safety stock. By the time you finish the first bin and move to the second, a new order is placed to refill the first. The two-bin system is simple and requires no complex software – just discipline. It’s basically a physical representation of a reorder point system, ensuring continuous supply for small components on an assembly line or in maintenance crib stock.
These techniques highlight that inventory management isn’t one-size-fits-all. You might use advanced software signals for your A items, and a humble two-bin card for your C items, and that’s perfectly fine. The key is to have a system that fits each inventory segment’s needs.
Important Inventory Metrics and Key Performance Indicators

To know if your inventory management is effective, you’ll want to track some metrics. These KPIs (Key Performance Indicators) help quantify how well you are managing stock. Let’s look at a few of the most important ones for industrial teams:
Inventory Turnover
Inventory turnover measures how many times your inventory is sold or used up over a given period (usually a year). It’s calculated as:
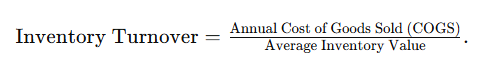
A simpler conceptual way: turnover = how many times you cycle through your inventory. For example, if you had $1,000,000 in average inventory and your COGS for the year was $4,000,000, then $4M/$1M = 4. That means you turned your inventory over 4 times in the year (roughly one turn every 3 months).
A higher turnover generally indicates efficient inventory management – you’re selling/using items quickly rather than letting them languish. A low turnover (say 1 or 2) might signal overstocking or slow sales, meaning items sit around too long.
The “ideal” turnover rate varies by industry. Fast-moving consumer goods have high turnover (10+), while heavy machinery might turn slower. Monitoring turnover helps you identify issues: if turnover is dropping, you might have excess inventory or declining demand. Increasing turnover without hurting availability is a common goal because it means less money tied up. Just be careful: extremely high turnover might also indicate you’re operating too lean and risking stockouts. The sweet spot is having inventory move promptly but not so fast that shelves are bare when needed. This metric ties together sales, production, and inventory investment in one number that management often pays close attention to.
Days of Inventory (DIO or DSI)
Days Inventory Outstanding (DIO), also called Days Sales of Inventory (DSI) or simply Days in Inventory, is another perspective on inventory efficiency. It tells you the average number of days it takes to sell or use the inventory you have on hand. In formula terms:
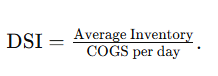
If we use the example above with turnover 4 per year, the DSI would be about 365/4 ≈ 91 days. That means on average, items sit in inventory for 91 days before being used or sold.
A lower DSI is generally better – it means inventory moves quickly (e.g., a DSI of 30 days would be quite lean for many industries, indicating you only hold about a month’s worth of stock). A high DSI (e.g., 180 days) means half a year’s inventory is piled up, which could be a red flag for overstock or slow sales.
DSI is essentially the flip side of turnover; some managers prefer thinking in terms of “days”. It’s useful for planning: If your DSI is 90 days, you know you have roughly three months of supply on hand. If the industry norm is much lower, maybe you have room to improve. If it’s much higher, you might be too lean. DSI can also be tracked over time as a performance indicator – if your initiatives (like better forecasting or JIT ordering) are working, you should see DSI decrease, meaning you’ve reduced how long inventory stays on the shelf.
Inventory Accuracy
For industrial teams, inventory accuracy is a vital metric often expressed as a percentage. It’s the measure of how closely your recorded inventory matches the actual physical inventory. For example, 98% accuracy means 98 out of 100 items checked in the system match the physical count. High accuracy is crucial because all the fancy analyses and automated reordering in the world won’t help if your data is wrong. Inaccuracies can lead to nasty surprises – you thought you had 10 units left but actually have 0 (stockout!), or vice versa, you reorder something you already have plenty of. Regular cycle counting (as discussed) is the tool to maintain and measure accuracy. A world-class operation might strive for 99%+ accuracy. Tracking this KPI involves counting a sample of inventory and comparing to system numbers, then calculating the percentage correct. Improvements in accuracy often come from process fixes: better training for staff on transaction logging, improved barcode scanning systems, tighter security to prevent theft, and eliminating manual paperwork where errors creep in. By keeping this metric high, you ensure the rest of your inventory management system can function properly on trusted data.
Fill Rate (Service Level)
Fill rate is a customer-service-oriented metric: it measures what percentage of orders can be filled immediately from stock on hand. For example, if a customer (or a production order) asks for 100 different parts and you had 95 available without delay, your fill rate is 95%. A high fill rate indicates you’re able to meet demand readily and are not encountering stockouts on items that customers want. Industrial suppliers and warehouses often track fill rate to gauge performance – a common target might be 98% or higher for top customers or critical parts. If your fill rate is low, it means too often you’re missing items and possibly delaying production or shipments while you wait for inventory to come in.
Improving fill rate can be achieved by better stocking of the right items (often informed by ABC analysis – ensuring A items rarely stock out) and by forecasting demand to have adequate stock. Fill rate is basically a direct measure of how well your inventory management aligns with actual needs. It can be measured at various levels: line fill rate (percent of line items fulfilled complete), order fill rate (percent of whole orders fulfilled without backorder), etc. For internal use (like supplying production), you might measure how often production orders had all components available when needed. This metric connects inventory management to the end result: keeping operations running and customers happy.
Return on Inventory (ROI) and Other Financial Metrics
For completeness, another concept to be aware of is Return on Inventory Investment, sometimes measured as part of a broader working capital analysis. Essentially, management might look at how much profit is generated per dollar of inventory held. While this is more of a finance measure, it underscores that inventory is capital tied up – and they want to maximize the returns on that capital. A related metric in retail/wholesale is GMROI (Gross Margin Return on Inventory), which looks at gross profit earned for each dollar of average inventory investment. In manufacturing, you might simply track inventory as a percentage of assets or as days (as we did with DSI). The key takeaway is that inventory levels have a direct impact on company financials – and metrics like turnover, DSI, and carrying cost all feed into how inventory affects profitability and cash flow.
By keeping an eye on these metrics, industrial teams can quantify their performance, set goals (e.g. “increase turnover to 6” or “achieve 99% inventory accuracy”), and measure improvement over time. Metrics turn the abstract concept of “good inventory management” into tangible targets and results.
CyberStockroom: A Visual Approach to Inventory Management Basics
We’ve covered a lot of concepts – now how do you apply them in the real world? This is where having the right inventory management system makes all the difference. One innovative tool in this space is CyberStockroom, which takes a visual approach to help industrial teams implement these inventory management basics with ease.
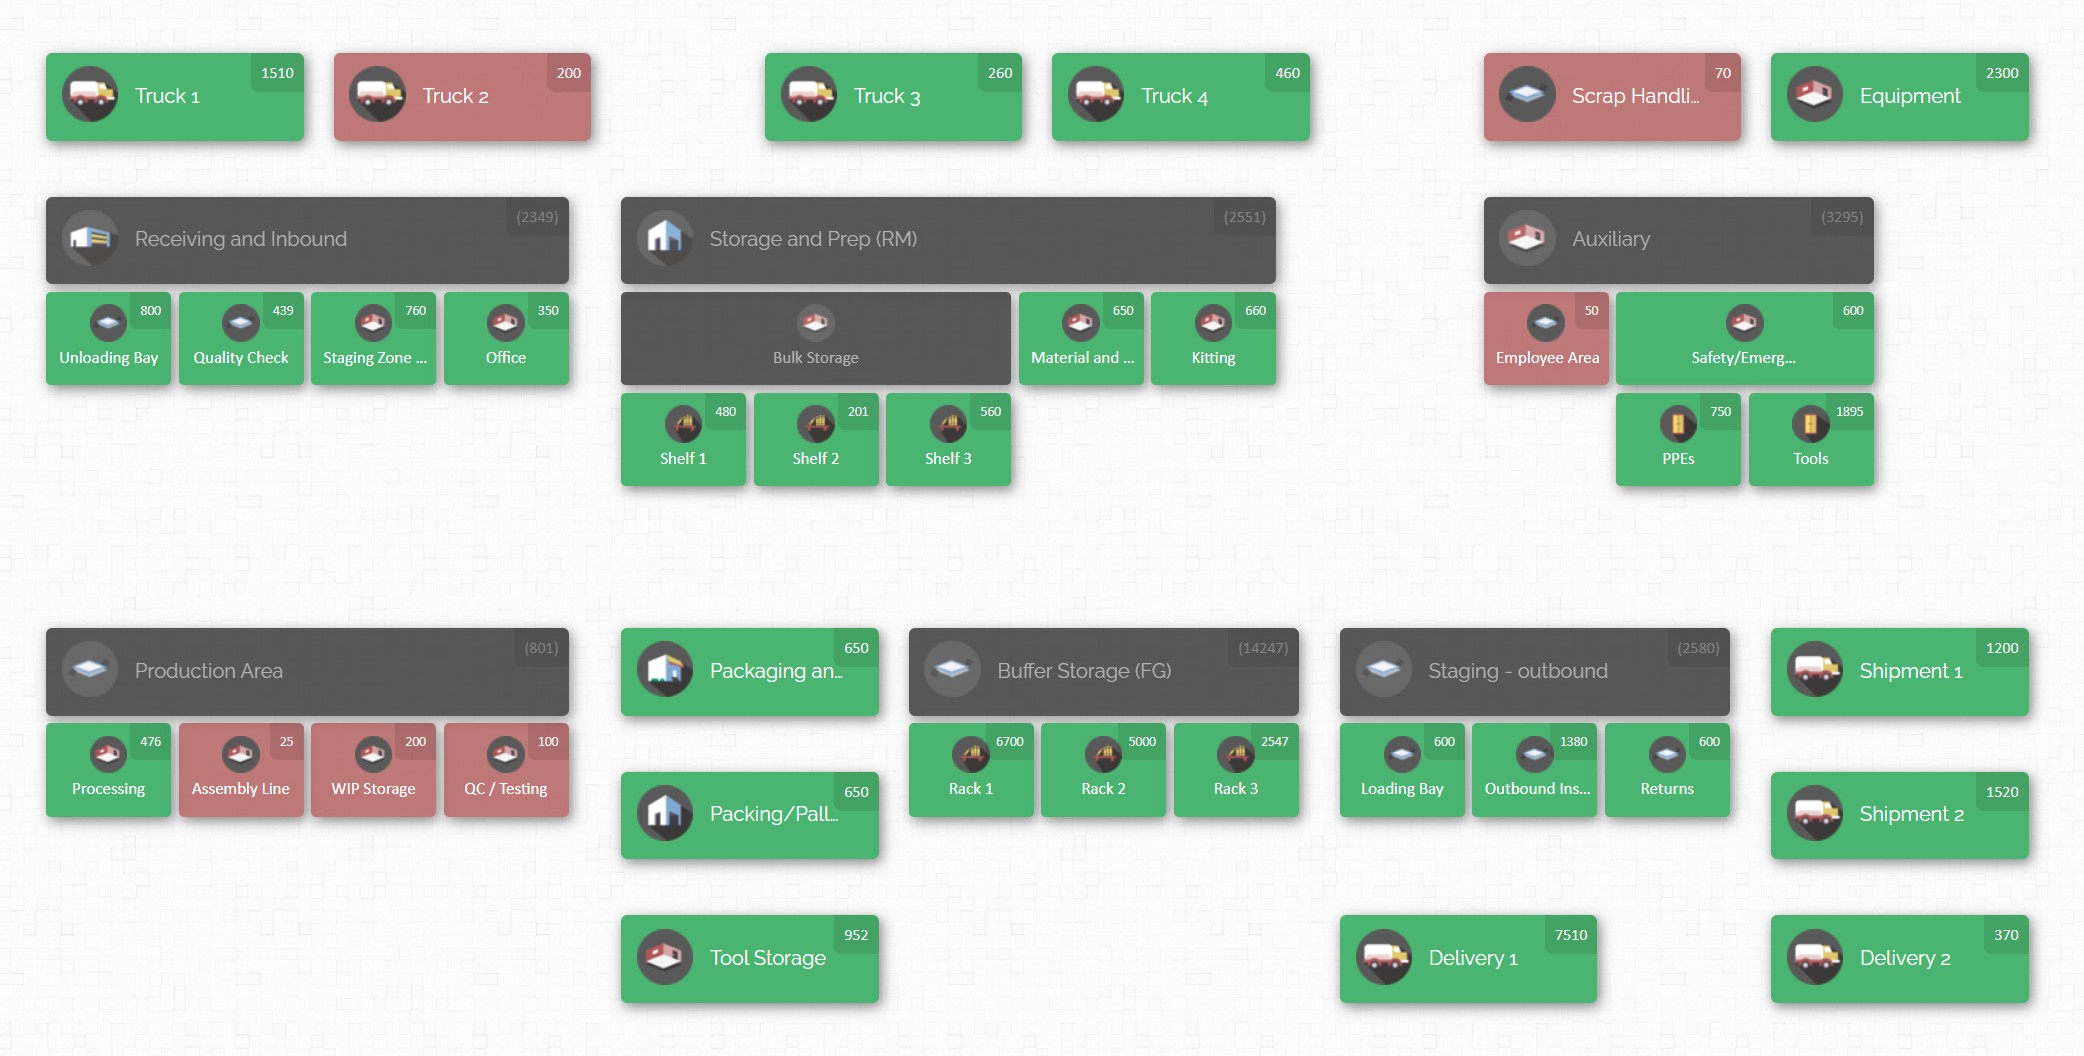
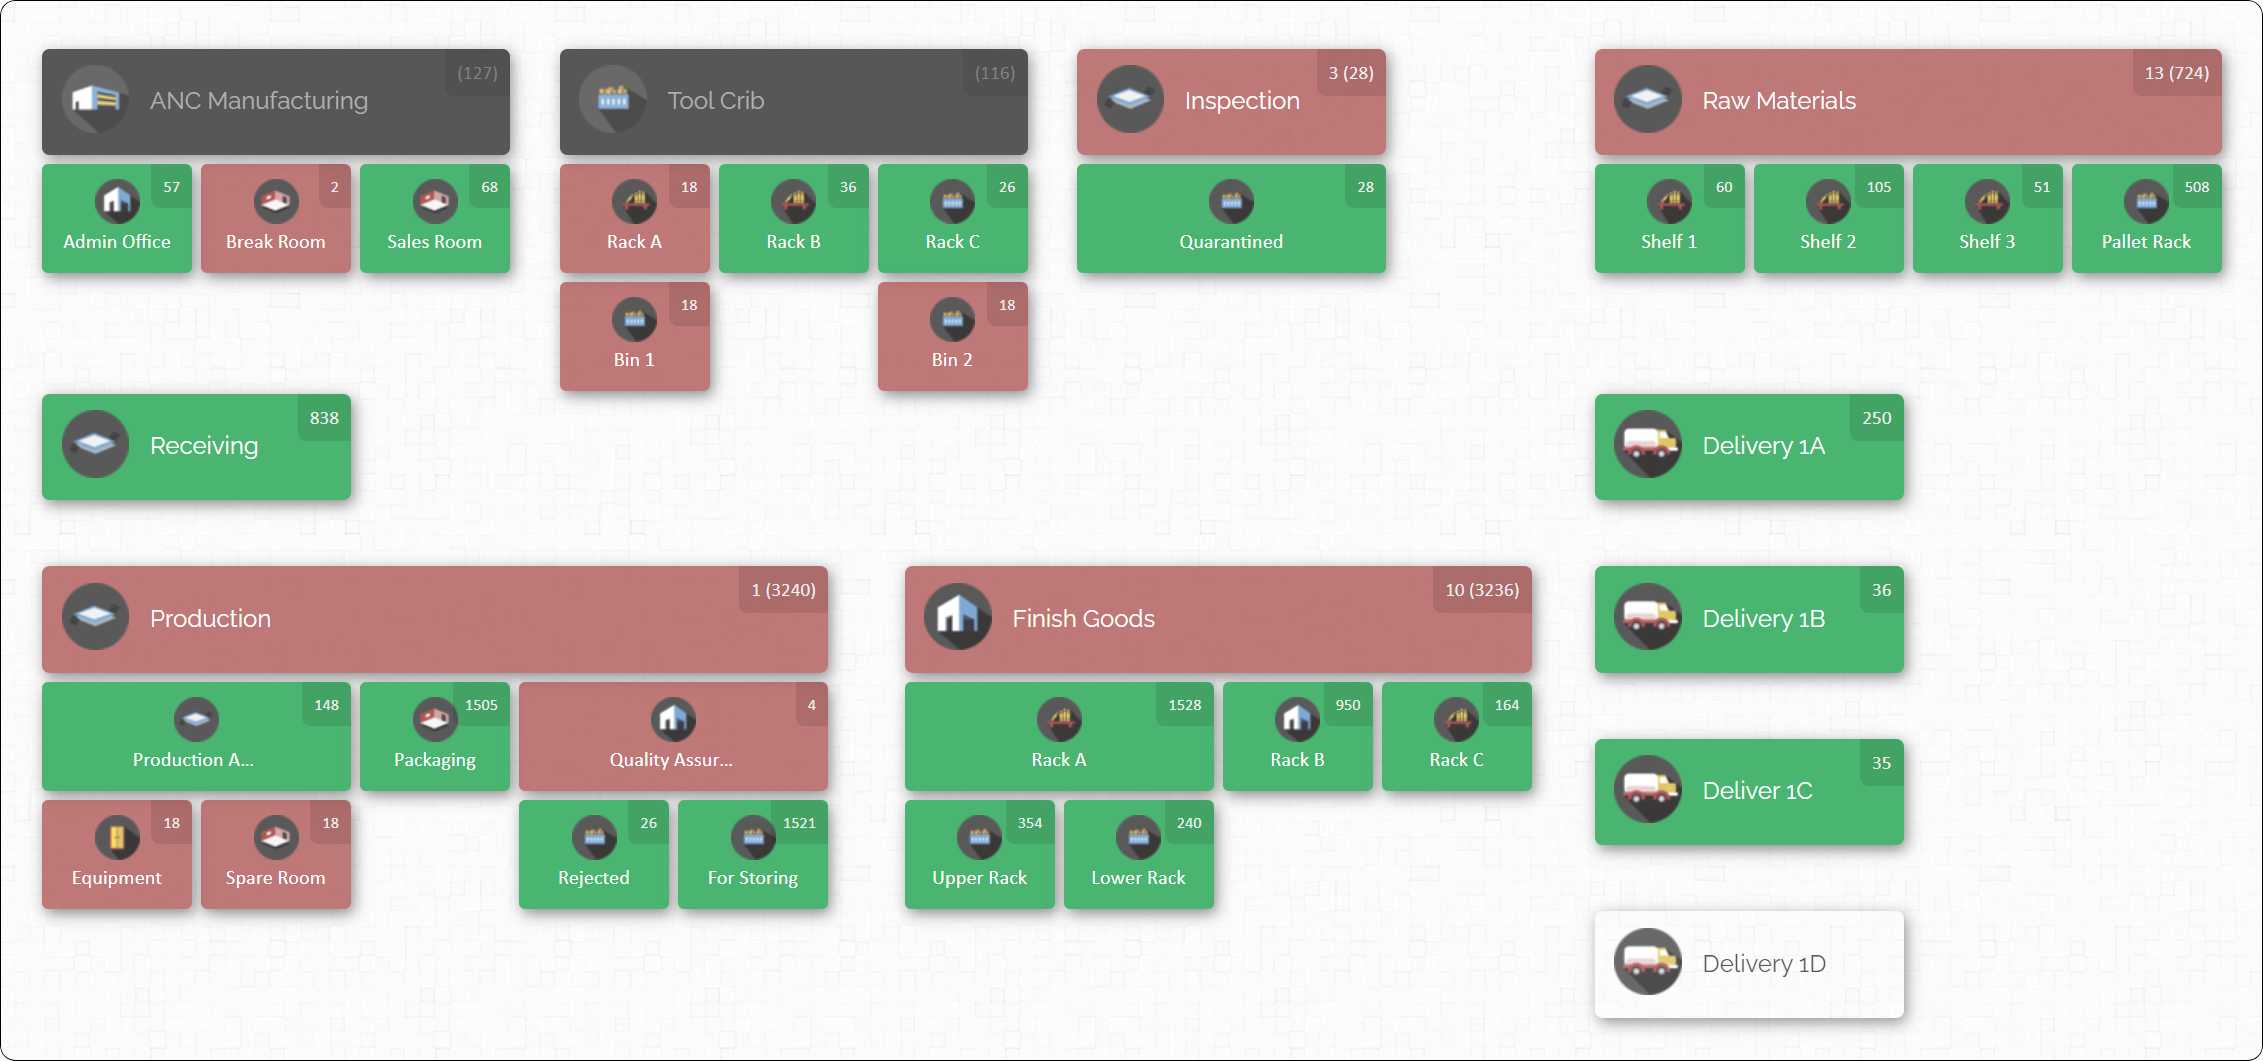
What is CyberStockroom? It’s an online inventory management software that uses a unique map-based interface. Imagine creating a virtual map of your entire operation – your warehouse, stock rooms, production floor, yard, job sites, service vehicles – and then placing your inventory items into these locations on the map. CyberStockroom allows you to do just that, giving you a bird’s-eye view of where everything is. For industrial companies managing inventory across multiple locations or departments, this visual representation can be a game-changer for inventory visibility. Instead of poring over spreadsheets or text-based lists, you literally see your business layout and the inventory in each area at a glance.
How does this help with the basics we discussed? Let’s draw some connections:
- Real-time Inventory Tracking: CyberStockroom’s map shows quantity levels in each location, updating as stock moves. This makes maintaining inventory accuracy much easier, since every movement of stock is logged and visible. If you drag-and-drop 50 units of a component from “Warehouse A” to “Production Floor” on the map, the system moves those units and records the transfer instantly. This visual transfer is intuitive for teams and reduces clerical errors, supporting that high accuracy we strive for. You can also perform cycle counts at a specific location by clicking on it, quickly verifying counts in a section of your warehouse without dealing with the entire inventory at once.
- Managing Multiple Inventory Types: Industrial teams often juggle raw materials, WIP, finished goods, and MRO spares. CyberStockroom’s customizable map can handle all of these. For instance, on one map you might have a “Raw Materials Warehouse”, a “Production Floor” (which holds WIP), a “Finished Goods Storage”, and a “Maintenance Shop” (for MRO parts). The software lets you drill down into each location and even sub-locations (like specific rooms, zones, or equipment). This means you can track WIP inventory moving through stages of production by updating its location on the map (e.g., moving a batch from “Cutting Area” to “Assembly Area” as it progresses). You can also see MRO inventory levels in the Maintenance area, ensuring you have critical spares on hand. The ability to represent all inventory types visually helps break down silos – everything is managed in one coherent system, but you can filter or focus on what you need.
- Fast, User-Friendly Operations: A big challenge in adopting inventory systems is getting team buy-in and consistent use. CyberStockroom’s drag-and-drop and visual cues simplify training and daily tasks. Warehouse workers or technicians can use barcode scanners with the system (even from a mobile device browser) to check items in or out, and immediately see the changes on the map. This ease of use encourages frequent updates, which means the data stays current. And when data is current, metrics like turnover or DSI can be tracked accurately via the software’s reporting. CyberStockroom basically acts as the central source of truth for inventory, automatically calculating current stock, history, and even providing analytics. By logging every move, it builds an activity history – so if something is missing (potential shrinkage issue), you can trace who last moved it, when, and where. This kind of accountability and transparency can significantly reduce losses (supporting what CyberStockroom calls loss and theft prevention).
- Implementing Techniques with Software Support: CyberStockroom also supports various inventory strategies. For example, you might use ABC analysis within the system by tagging items or simply visually recognizing that certain locations hold your “A” items (which you check more often). The software can generate reports to identify slow movers versus fast movers, helping you decide on A, B, C categories. If you practice FIFO, CyberStockroom can help by allowing you to track batches or lot numbers (using custom fields or serial tracking). When you move or fulfill items, you can ensure the oldest lot is allocated first. The visual interface could even be laid out to mirror FIFO flow (e.g., one side of a stock room for incoming stock and the other for outgoing). As for JIT, while that’s more of a process with suppliers, CyberStockroom’s clear overview of current inventory levels and usage rates can highlight opportunities to trim down inventory or identify items you might be holding too much of relative to consumption. Essentially, it provides the data visibility you need to confidently lean out your inventory without tipping into stockout territory.
- Multi-Location and Distributed Inventory: Many industrial companies have more than one site – perhaps multiple plants, regional warehouses, or field service trucks. CyberStockroom excels here by letting you create an inventory map that spans all your locations within a single view. You can zoom in on one plant or zoom out to see inventory distribution across, say, five warehouses nationwide. This is incredibly useful for distributed inventory management – you can quickly find where you have stock of a particular item across all sites. If one location is low, you might see that another location has excess and initiate an internal transfer (which you can record via a drag-drop move on the map). This balances stock and improves your overall fill rate by utilizing inventory in the network effectively. It’s like having a command center for all inventory, which is far more efficient than siloed spreadsheets or separate systems at each site.

In summary, CyberStockroom provides an intuitive platform to apply inventory management principles daily. It combines the fundamentals – like tracking SKUs, quantities, locations, and movements – with a user-friendly visual interface that gets everyone on the same page. For an industrial team, this means less time searching for parts, fewer mistakes in data entry, and more confidence that you know what you have and where it is at all times. The result? Smoother operations, better decision-making, and more time to focus on production and growth rather than firefighting inventory issues.
CyberStockroom is just one example of how embracing the right technology can reinforce the inventory management basics discussed in this guide. With such tools, practices like cycle counting, maintaining safety stock, or optimizing reorder points become easier to execute and sustain.

Building a Solid Inventory Foundation
Mastering inventory management basics is essential for any industrial team aiming to run an efficient and resilient operation. We’ve journeyed through key terms – from SKUs and safety stock to lead times and turnover – and core concepts like FIFO, JIT, and ABC analysis. Understanding these ideas provides the foundation for making smart decisions about your stock. It’s about knowing how to avoid the pitfalls of stockouts and bloated inventory, how to organize and classify your materials, and how to measure success through metrics.
With a solid grasp of inventory fundamentals, you can start to see your inventory in a new light: not as a chaotic cost center, but as a strategic asset that you control. The right practices, coupled with supportive tools (like visual inventory mapping software such as CyberStockroom), turn those concepts into daily reality. You’ll be able to locate any item when it’s needed, maintain the optimal levels of each supply, and adapt quickly when demand or supply chain conditions change.
Remember, even the most complex industrial supply chain boils down to basics: know what you have, know what you need, and have a plan to bridge the gap. By applying the key terms and concepts from this 101 guide, your team can improve operational continuity, reduce waste, and deliver reliably to your customers or production lines. Inventory management is a continuous improvement journey – keep educating your staff, refining your processes, and leveraging data and technology to stay on top of your stock.
In the end, success in industrial inventory management comes from balancing information and action: use good data (accurate inventory records, forecasts, and metrics) to drive good decisions (when to order, how much to produce, where to store). With these fundamentals in your toolkit, you’re well on your way to keeping your operations well-supplied, cost-effective, and ready for whatever challenges come down the line. Happy managing, and may your stockrooms always be efficiently stocked and organized!


Leave a comment