
Inventory is the lifeblood of manufacturing businesses – it ties up capital, occupies warehouse space, and ultimately fulfills customer demand. Managing inventory efficiently can mean the difference between a nimble, cost-effective operation and one that is bloated with excess stock.
One key metric that manufacturers use to gauge this efficiency is inventory turnover. In simple terms, inventory turnover measures how many times you sell and replace your inventory in a given period. A higher turnover means you’re cycling through stock quickly (indicating strong sales or lean inventory levels), while a lower turnover points to stock sitting idle for too long.
Understanding Inventory Turnover in Manufacturing
Inventory turnover is a straightforward but powerful metric. It’s typically calculated as:
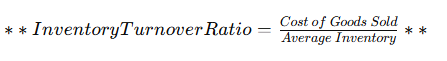
For example, if your cost of goods sold (COGS) for the year is $5 million and your average inventory value is $1 million, your inventory turnover ratio is 5. This means you cycled through your inventory five times over the year.
In manufacturing, this ratio can be applied in a few ways:
- Overall inventory turnover: considering all inventory (raw materials + work-in-progress + finished goods) against COGS.
- Finished goods turnover: how quickly final products sell after production.
- Raw materials turnover: how fast raw stock is used in production.
- WIP (Work-in-Process) turnover: how quickly items move through production stages.
Each of these can provide insight. For instance, a slow raw materials turnover might indicate over-purchasing of materials, whereas slow finished goods turnover could mean overproduction or weak sales. Manufacturers often focus on overall turnover as a top-level indicator of efficiency in the supply chain and production process.
Why does inventory turnover matter so much? Because it reflects the balance between supply and demand in your operations. A high turnover in manufacturing usually signals that production is closely aligned with customer demand – you’re not making more than you can sell. It also suggests that your inventory levels (whether raw materials or finished goods) are lean, which is a core principle of efficient manufacturing. On the flip side, a low turnover ratio may reveal problems like overstocking, slow sales, forecasting errors, or production bottlenecks. Understanding where you stand is the first step to improvement, which makes calculating and tracking this metric critical for any manufacturer.
Why Inventory Turnover Matters for Manufacturers

Inventory turnover isn’t just a number on a report – it has real implications for a manufacturing business’s health and competitiveness. Here are a few reasons why this metric is especially important in manufacturing:
- Cash Flow and Working Capital: Inventory often ties up a huge portion of a manufacturer’s working capital. Materials and products sitting in a warehouse represent cash that’s not available for other uses. A faster inventory turnover frees up cash. When you turn inventory over quickly, you spend money on materials and production, but you recoup it faster through sales. This improved cash flow can be reinvested in new product development, equipment upgrades, or other operations. Conversely, if turnover is slow, money is locked in unsold stock, which can strain finances.
- Storage Costs and Space: Manufacturing companies require space to hold raw inputs, components, and finished goods. If inventory lingers too long (low turnover), you end up needing more storage space – possibly expanding warehouses or renting additional facilities. That directly increases overhead costs (rent, utilities, insurance, security, etc.). Additionally, crowded storage can lead to inefficiencies in handling and retrieving items. Improving inventory turnover means you maintain a leaner inventory, requiring less space and lowering storage costs. It also keeps your warehouses more organized and efficient.
- Risk of Obsolescence and Waste: In certain manufacturing industries, inventory loses value over time. For example, electronics components can become outdated, chemicals or pharmaceuticals can expire, and style-driven products can go out of fashion. Low turnover magnifies the risk that you’ll be stuck with obsolete or spoiled items. Even for durable goods, designs might change or customers might move on to newer models. High inventory turnover mitigates this risk – products are moving out before they become outdated or degrade. This is closely tied to quality as well; items stored too long could incur damage or require maintenance. Fast turnover keeps stock fresh.
- Responsiveness and Flexibility: A high turnover often indicates an operation that’s responsive to demand. Manufacturers with fast inventory turnover tend to produce in sync with actual customer orders or realistic forecasts (often seen in just-in-time systems). This means they can adapt more quickly to market changes. If demand drops, they’re not overburdened with excess stock; if demand spikes, they aren’t hampered by piles of old inventory – they can ramp up to fulfill new orders. In contrast, a low-turnover manufacturer might be less agile, because their resources are tied up managing and eventually liquidating old inventory. In dynamic markets, agility can be a competitive advantage.
- Indicator of Efficiency (Lean Manufacturing): In lean manufacturing philosophy, excess inventory is one of the seven wastes (“muda”). It’s seen as something to be minimized because it hides problems in production and supply chain. A low inventory turnover ratio is a red flag indicating potential inefficiencies: maybe your batch sizes are too large, your production schedule isn’t aligned with demand, or your procurement is overshooting needs. By striving for a higher turnover, manufacturers often uncover and address these inefficiencies. In other words, improving turnover can be a catalyst for broader process improvements – better scheduling, better quality control (to avoid scrap/rework inventory), and tighter supply chain integration.
- Profitability: Ultimately, when you manage inventory better, it contributes to the bottom line. High turnover usually correlates with healthy profit margins and ROI. You’re spending less on holding costs and write-offs for excess, and you might even negotiate better terms with suppliers (since you’re not over-ordering). Plus, products are sold in a more timely manner, which often means at full price rather than later at a discount just to clear stock. All of these factors help profitability. On the contrary, low turnover can eat into profits through various hidden costs – storage, handling, depreciation of stock value, etc.
In summary, inventory turnover is a vital sign of a manufacturing operation’s health. It connects to financial performance, operational efficiency, and customer satisfaction (because the right products are available at the right time). A manufacturer who monitors and optimizes turnover is likely to see benefits across the board: stronger cash position, lower costs, and a slicker operation that can outmaneuver competitors.
Benchmarking Inventory Turnover in Manufacturing
After understanding the importance of inventory turnover, the next question is: what is a “good” inventory turnover ratio for a manufacturing company? The answer, of course, depends on your industry and product type. Benchmarking your turnover against peers provides context to your number and helps set improvement targets.

Manufacturing encompasses a wide range of industries – from heavy machinery and automotive components to food products, consumer electronics, and apparel. Each of these sectors has different turnover characteristics:
- Heavy Equipment & Capital Goods: Manufacturers of large industrial machines, aerospace parts, or capital equipment typically have lower inventory turnover ratios. These products have long production cycles and high unit costs, and demand may be slower. It’s not unusual to see annual inventory turns in the 2 to 4 range for such businesses. For instance, a company building aircraft engines might only turn its inventory 2 times a year, because each unit is costly and production is lengthy. Low turnover here isn’t necessarily bad – it’s a reflection of the business model. However, these companies will compare themselves with similar manufacturers to see if their 2.5 turns, for example, are competitive or if peers are managing 3+ turns with better practices.
- Automotive and Industrial Manufacturers: These often fall in a middle ground. Car manufacturers and their parts suppliers usually strive for lean inventory through just-in-time supply chains, but they also face complex logistics. Turnover might be moderately low for some (due to parts inventory and global supply considerations) – perhaps around 4 to 6 turns per year. Some automotive suppliers boasting very efficient operations (or those using just-in-time extensively) might push toward higher single-digit turns. If an auto parts maker sees only 3 turns while competitors achieve 6, that’s a sign there’s room to streamline.
- Fast-Moving Consumer Goods (FMCG) Manufacturers: Companies that produce food, beverages, daily consumables, or other fast-moving goods generally target higher turnover ratios, often in the 7 to 10 (or more) range annually. For example, a packaged food manufacturer might turn inventory 8 times a year (meaning roughly every 6-7 weeks they’re cycling through stock). High volume and steady demand allows for high turns. In fact, if such a manufacturer’s turnover slipped to, say, 3 or 4, it would indicate serious overstock or slow sales, since the industry norm is higher.
- Apparel and Electronics Manufacturing: These can also see relatively high turnovers if managed well, because trends change quickly (especially in fashion) and product life cycles can be short (particularly in electronics). A contract manufacturer for consumer electronics might aim for something like 6-8 turns to keep up with new models and avoid holding obsolete components. Apparel manufacturers (especially fast-fashion oriented) will push for rapid turnover of styles, possibly even double-digit turns if they are truly agile. However, seasonal swings might complicate the picture – inventory builds up before a season and sells off during the season, affecting the timing of turnover calculation.
- Pharmaceutical and Medical Manufacturing: This is a unique case. Sometimes turnover is lower (e.g., 3-6 range) because of long production lead times, strict quality controls, and the need to stockpile inventory for safety (especially if manufacturing processes are complex or have long setup times). But high-demand generic drug manufacturers, for instance, might attain higher turns by optimizing production runs. Benchmarks here need to account for regulatory safety stock requirements and expiration dates.
As you can see, “good” inventory turnover is relative. A figure that would be alarmingly low in one sector might be perfectly normal in another. This is why benchmarking is key: you want to compare your turnover to the typical range in your specific industry segment.
How to find benchmark data? You can:
Consult Industry Reports: Many accounting and financial services firms publish annual or quarterly reports of financial ratios by industry. Inventory turnover is often included. These might break down manufacturing into subcategories (e.g., “chemical manufacturing average turnover” or “machinery manufacturing average turnover”). For example, data from one source might show that “the average inventory turnover for industrial equipment manufacturers is 4.0” whereas “for food manufacturers it’s 8.0.” If you have access to such reports or databases, look for the median or average in your field.
Industry Associations: Trade associations sometimes collect member data and share benchmarking metrics. If you belong to, say, a Manufacturers Association or a specialized group, they may have survey results on inventory metrics.
Peers and Competitors: Publicly traded manufacturing companies report financials that can allow calculation of turnover (COGS and inventory levels). By calculating a competitor’s turnover ratio from their financial statements, you get a rough benchmark. If several similar companies all cluster around, for instance, 5 turns per year, and you’re at 3, you know you lag behind.
Internal Historical Benchmarks: Don’t forget to benchmark against yourself over time. Tracking your own inventory turnover year over year (or quarter over quarter) shows whether you’re improving. Internal benchmarks help set realistic goals like “increase turnover from 5 to 6 within two years,” even as you also consider external benchmarks.
One important related metric is Days Inventory Outstanding (DIO), sometimes called days in inventory. This tells you the average number of days an item stays in your inventory before it’s sold (or used). It’s essentially the inverse of turnover, expressed in time. The formula is:
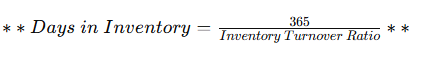
So if your turnover is 5, then on average inventory sits ~73 days (365/5). Benchmarking in days can sometimes be intuitive – for instance, a company might say “our goal is to reduce days-in-inventory from 90 days to 60 days.” Manufacturers often use DIO in the context of cash-to-cash cycle analysis, and it’s another way to compare with industry norms (e.g., an industry average might be 75 days, and you’re at 90 – indicating room for improvement).
Benchmark with caution: Ensure you are comparing equivalent figures. Some companies calculate turnover using sales instead of COGS (which can inflate the ratio). Always use COGS for a true efficiency measure in manufacturing. Also, compare time periods that make sense – annual turnover is common, but if your business is highly seasonal, you might also compare peak season turnover vs off-season.
In manufacturing, as a general guideline:
- A turnover below 5 might be concerning for fast-moving product makers, but could be average for heavy industrials.
- Around 5-8 is a middle ground for many manufacturing operations.
- 8-10+ is excellent for most manufacturers and likely indicates very streamlined operations or high demand products.
- Anything in double-digits (10 and above) is typically “best in class” or reflective of unique situations (e.g., very high demand items or companies that have adopted just-in-time to a high degree). In fact, some best-in-class lean manufacturers strive for 10+ annual turns, meaning inventory turns roughly every 1-2 months.
The bottom line is: know your industry’s range and know your own number. If you find that your inventory turnover lags behind industry benchmarks, it’s a signal that you should investigate why and take action (which we’ll cover next). And if you’re already ahead of the curve, maintaining that edge through continuous improvement is equally important – your competitors will surely be trying to catch up.
Factors Influencing Inventory Turnover in Manufacturing

Before jumping into improvement strategies, it’s useful to identify what factors might be dragging down (or holding back) your inventory turnover. Several aspects of manufacturing operations directly influence this metric:
- Production Lead Times and Batch Sizes: The nature of your production process can affect turnover. If it takes a long time to manufacture a product (long lead time) and you produce in large batches, you’ll accumulate more work-in-process and finished goods inventory before it gets sold, which lowers turnover. For example, if a factory builds complex machinery over 60 days and stocks up several units before shipping, inventory sits for a long period. On the other hand, if you can reduce production lead time or make smaller batches more frequently, products flow out faster, improving turnover.
- Demand Variability and Forecast Accuracy: Unpredictable demand often forces manufacturers to keep extra inventory “just in case.” If your sales are erratic or seasonal, you might overstock certain items or components to avoid missing potential sales. However, if forecasts are off and demand doesn’t materialize, you’re left with excess inventory and slow turnover. So, volatile demand coupled with poor forecasting accuracy is a recipe for low inventory turns. Companies that invest in better demand planning and maintain agility can mitigate this factor.
- Supply Chain Reliability and Lead Times: This is the supply side of the equation. If your suppliers have long lead times or are inconsistent (delays, shortages), you might carry more raw materials or components as buffer stock. Similarly, if overseas shipping takes months, you’ll have inventory in transit or in buffer, slowing the cycle. A robust, reliable supply chain – possibly with local suppliers or agreements for quick replenishment – allows you to keep lower inventory and turn it faster. Conversely, supply uncertainties will force higher inventory levels (safety stock), reducing turnover.
- Product Range and Complexity: Manufacturers with a very broad product catalog (many SKUs) often face uneven turnover rates across products. Your product mix can influence overall turnover; a few slow-moving products can drag down the average. For instance, if you make 100 different items and 20 of them sell very slowly (perhaps niche products or older models), they will sit in inventory longer. Companies with simpler, more focused product lines often see better turnover. Complexity in products also matters – if some items require sub-assemblies or numerous parts, you might accumulate inventory at different production stages, impacting turns.
- Quality Issues and Rework: If significant portions of inventory are tied up in quality hold or rework loops (due to defects that need fixing), those items aren’t turning. Poor quality processes thus can lower turnover because inventory spends extra time waiting for inspection or rework. High first-pass yield (few defects) means items go straight from production to available-for-sale without delay, supporting higher turnover.
- Business Model (Make-to-Stock vs Make-to-Order): Manufacturing companies operate on different fulfillment strategies. Make-to-stock means producing goods in anticipation of demand (common for consumer goods on store shelves). This can lead to inventory build-up if forecasts overshoot, but it also allows immediate fulfillment and potentially higher turnover if done right. Make-to-order or assemble-to-order means you only build when there’s an actual order (common in custom equipment or B2B contexts). Make-to-order manufacturers might have lower finished goods inventory (since they don’t stockpile finished products), improving turnover for finished goods; however, they may still keep raw material inventory on hand to respond quickly to orders. The key is that make-to-order reduces the risk of unsold finished stock, often boosting overall turnover figures, whereas make-to-stock runs the risk of leftover inventory if not managed well.
- Economic Conditions and Market Demand: Broader factors like an economic downturn can slow down sales for many manufacturers, causing inventory to pile up and turnover to fall. Conversely, during a boom or a major spike in demand, sales outpace production and inventory turnover naturally rises (often alongside low inventory levels, which can be both good for turnover but potentially problematic if you can’t meet all demand). While you can’t control the economy, awareness of these cycles helps in planning inventory strategy (e.g., ramping down production and inventory buildup when a slowdown is anticipated).
- Inventory Management Practices: Finally, the internal practices themselves – how well inventory is tracked and controlled – play a big role. Companies that regularly perform inventory audits or cycle counts tend to maintain more accurate records, which means they know exactly what they have and can make better decisions (like not over-ordering because of phantom inventory in the system). Accuracy ensures trust in the data used for forecasting and ordering. Additionally, practices like first-in, first-out (FIFO) ensure older stock is used or sold first, preventing buildup of old inventory that can stagnate. If a manufacturer neglects these practices, they might be unknowingly accumulating excess stock, or they might encounter surprises (like discovering a warehouse full of unsold product that’s been “forgotten” in the system). Good discipline in inventory management supports a healthy turnover rate.
Understanding these factors can help diagnose why your inventory turnover is at its current level. For example, you might realize, “Our turnover is low partly because we source a critical component from overseas with a 3-month lead time, so we always keep 6 months of that component in stock.” That’s a supply chain issue to address. Or perhaps, “We have a lot of old finished goods inventory from a product line we haven’t fully phased out – it’s just sitting there.” That’s a product lifecycle and inventory clearance issue. With the pain points identified, you can target the most impactful areas for improvement.
Next, we’ll move from diagnosis to action: what strategies can manufacturing businesses use to improve their inventory turnover?
Strategies to Improve Inventory Turnover in Manufacturing
Improving inventory turnover in manufacturing is all about balancing inventory to match demand more closely and eliminating inefficiencies that cause inventory to linger. It usually requires a multifaceted approach – combining better processes, smarter planning, and sometimes technological tools. Below, we outline several effective strategies and improvement initiatives. These can be pursued concurrently, and many of them complement each other:
Enhance Demand Forecasting and Sales Planning

One of the most fundamental ways to avoid excess inventory is to predict demand as accurately as possible. Improved forecasting means you produce (or procure) closer to the quantities that customers will actually buy. In manufacturing, this might involve:
- Analyzing historical sales data: Look for patterns, seasonality, and trends. Modern analytics or demand planning software can crunch numbers to project future sales of each product.
- Collaborating with customers and sales teams: If you manufacture to fulfill client orders or to stock distributors, get input from those clients about their upcoming needs. Salespeople’s forecasts and customer pre-orders or indications can enrich your statistical forecasts.
- Market research and trend analysis: Keep tabs on market conditions that could affect demand for your products – e.g., new competitor products, changes in consumer preferences, economic indicators. In some industries, leading indicators (like housing starts for building materials, or auto sales trends for parts suppliers) can help anticipate demand changes.
- Flexible forecasting: Use different time horizons (monthly, quarterly) and update forecasts frequently. A rolling forecast that you refresh as new data comes in will typically be more accurate than an annual forecast set once and forgotten.
By forecasting better, you reduce the need to hold large “just-in-case” inventories. You’ll produce the right amount at the right time. For example, if your forecasting tells you that a certain product’s demand is slowing, you can scale back production proactively instead of ending up with months of unsold output in the warehouse. Companies that master forecasting often see their inventory turnover improve because there’s simply less excess stock sitting around. It’s important to note that no forecast is perfect – which is why combining forecasting with the other strategies below (like agile production and lean principles) is critical. The goal is to continuously refine your forecasts and integrate them into production planning so inventory aligns closely with actual demand.
Implement Lean Manufacturing and Just-In-Time (JIT) Practices

Lean manufacturing is all about eliminating waste, and excess inventory is a prime target for elimination. A lean approach, especially Just-In-Time (JIT) inventory, aims to receive materials and produce goods only as they are needed. This dramatically boosts inventory turnover because items spend minimal time waiting around. Some actions under this strategy include:
- Reduce Batch Sizes: Challenge the assumption that bigger batches are always better. By producing in smaller lots with higher frequency, you avoid creating mountains of WIP or finished goods that then wait for sales. Techniques like SMED (Single-Minute Exchange of Dies) can reduce setup times, making small batches economical.
- Streamline Production Flow: Reorganize factory layouts and processes for smoother flow (e.g., cellular manufacturing for assembly). The quicker a product moves from start to finish without delays, the faster it can be sold, improving turnover.
- Just-In-Time Deliveries: Work with suppliers to deliver raw materials or components right when you need them in production, rather than far in advance. This may involve carefully scheduled deliveries, Kanban signals to trigger re-supply, or vendor-managed inventory programs. When materials arrive JIT, you don’t count them in inventory for long – they practically go straight into production.
- Pull Systems: Use demand (orders) to “pull” production rather than producing to forecast alone. A pull system (exemplified by Kanban cards in a Toyota production system) means each stage only produces what the next stage needs when it needs it, preventing overproduction – the biggest cause of excess inventory.
- Continuous Improvement (Kaizen): Encourage teams to regularly find and fix inefficiencies that cause work to pile up. For instance, if one machine is slower and creating a bottleneck that causes upstream parts to queue (building WIP inventory), find ways to improve that machine’s output or re-balance tasks.
A real-world example is the automotive industry influenced by Toyota’s lean principles: many factories have adopted JIT to the point that parts arrive at the assembly line hours or minutes before they are assembled onto cars. The inventory turnover for such parts is extremely high (they essentially don’t linger at all). While not every manufacturer can be Toyota, adopting lean principles at a scale appropriate to your operation can significantly boost turnover. You’ll hold less inventory because you’ve cut out the overproduction and safety buffers that were there to cover for process inefficiencies – instead, you focus on fixing the inefficiencies.
Important: JIT and lean require stability and strong supplier relationships. If not carefully implemented, they can lead to stockouts. So, ensure you have contingency plans and that suppliers are reliable before slashing too much inventory. But overall, moving toward leaner operations generally increases inventory turns and reduces carrying costs.
Optimize Supplier Relationships and Lead Times

Your inventory levels for raw materials and components are heavily influenced by supplier performance. To improve turnover, it helps to forge strong partnerships with suppliers and attack lead time and reliability issues:
- Lead Time Reduction: Work with suppliers to shorten lead times for getting supplies. This could mean finding local or nearer suppliers, negotiating faster shipping options, or sharing forecasts with suppliers so they can stock items and deliver on short notice. If you can cut a supplier’s lead time from 8 weeks to 4 weeks, you can safely hold less inventory for that component, doubling the turnover for that part.
- Frequent, Smaller Deliveries: Instead of bulk ordering materials quarterly, see if your suppliers can accommodate monthly or bi-weekly deliveries in smaller quantities (without huge cost penalties). Frequent resupply aligns with JIT and keeps inventory low. Some suppliers offer vendor-managed inventory, where they monitor your stock levels and replenish as needed – effectively keeping inventory flowing.
- Supplier Reliability and Quality: Work closely on quality assurance and communication. If you trust that a supplier’s parts will arrive on time and work as expected, you don’t need large safety stock to cover for defects or delays. Building that trust might involve supplier audits, collaborative planning, or even integrating systems (for example, letting the supplier see your inventory levels so they can proactively refill orders).
- Contract Terms: Negotiate terms that encourage better turnover. For instance, consignment inventory arrangements mean the supplier’s stock sits at your site but you don’t pay for it (and it’s not on your books) until you actually use it in production – effectively raising your turnover because your “inventory” is reduced. Not all suppliers will agree to this, but it’s one creative approach.
- Alternative Sourcing and Flexibility: Identify multiple suppliers for critical items if possible. This competition can help in negotiations and also ensures you’re not stuck building up inventory because of one slow supplier. If one vendor has an 8-week lead time and another competitor can do it in 4, splitting or moving business to the faster supplier can improve turnover.
By optimizing on the supply side, manufacturers can significantly cut down the raw material and component inventory they need to keep. This improves overall inventory turnover. For example, think of a factory that currently holds 60 days’ worth of part X because of erratic supplier delivery. If through collaboration they reduce that to 30 days of part X on hand, they’ve effectively doubled the turnover of part X inventory. Multiply such improvements across many items, and the total inventory turnover gets a healthy boost.
Optimize Production Scheduling and Reduce Cycle Times

Many manufacturing companies can gain turnover improvements by making their production process more agile and faster from start to finish. Some tactics to consider:
- Production Scheduling Alignment: Align your production schedule tightly with actual orders or reliable forecasts (as discussed). Avoid making products too far in advance of when they’re needed. Modern production planning software (or an ERP system) can help schedule jobs optimally to fulfill demand just in time. If you’re in a job-shop or custom production environment, scheduling efficiency and quick changeovers between jobs can reduce idle work-in-process.
- Reduce Manufacturing Cycle Time: Look at each step of your production for opportunities to trim time. This might involve investing in faster machinery, cross-training workers to prevent waiting for specialized operators, or process improvements that eliminate unnecessary steps. The faster a product goes from raw material to finished item ready to ship, the less time it counts as inventory in your system.
- Overlap Operations (Where Possible): In some cases, you can start downstream operations before the entire batch of upstream is finished (this is known as concurrent manufacturing). For example, if you’re making 100 units, perhaps you don’t need to wait for all 100 to finish in the machining step before starting assembly on the first ones. By overlapping and staggering, you prevent large piles of WIP from accumulating at any stage.
- Total Productive Maintenance (TPM): Unplanned equipment downtime can slow production and cause partially finished goods to sit around. Implementing TPM to reduce breakdowns will keep flow moving and avoid those WIP buildups that hurt turnover. Also, maintenance can be scheduled during low-demand periods to not interfere with meeting current orders, thereby avoiding backup of inventory.
- Bottleneck Management: Apply the Theory of Constraints approach – identify the slowest part of your production (the bottleneck) and elevate its capacity. The bottleneck often dictates your overall throughput. By improving the bottleneck’s output (through additional capacity, better scheduling, or quality improvements), you increase the speed at which product flows out the door, which means higher inventory turnover. Also, ensure upstream processes don’t overproduce in front of a bottleneck – that just creates excess WIP. Synchronize production to the pace of the slowest necessary step.
Optimizing production is essentially about throughput – maximizing how quickly you can convert materials into finished products sold. If you can produce faster (without overproducing), you can respond to orders faster and don’t need to keep as much inventory waiting. A quicker cycle from materials arrival to product shipment means the inventory doesn’t dwell in your system long, thereby raising turnover.
Regularly Review Inventory and Cull Slow-Moving/Excess Stock

Every manufacturer should institute a discipline of inventory review to prevent build-up of stagnant stock. This includes:
- ABC Analysis and SKU Rationalization: Perform an ABC classification of your inventory. “A” items are high-value or fast-moving (critical to focus on), “B” are moderate, “C” are low-value or slow-moving. Ensure you’re not tying up too much cash in C items. In some cases, you might decide to discontinue or outsource the production of very slow-moving products (especially if they’re not profitable) – this reduces the long-tail of inventory that sits forever. Streamlining your product portfolio can directly boost turnover by eliminating those deadweight items.
- Set Inventory Turn Targets by SKU or Category: You can target specific improvement for items. For example, if one product has a turnover of 1 (meaning a year of supply on hand) and that’s not acceptable, set a plan to reduce its inventory level via better forecasting or smaller batch production for that product. Having SKU-level metrics helps pinpoint where the worst offenders are.
- Aging Inventory Reports: Use your inventory management system to generate aging reports (how long each batch or item has been in stock). This will highlight items that have been sitting for, say, over 6 months. Those are red flags. Create action plans for any stock that exceeds a certain age threshold – whether it’s raw material or finished goods.
- Clear Out Obsolete or Excess Inventory: It might hurt to liquidate at a discount, but keeping truly excess inventory just to avoid writing it off is usually a losing proposition. Consider periodic clearance sales for older finished goods, or repurposing materials if possible. Some manufacturers sell excess raw materials/components back to suppliers or on secondary markets. Others find creative uses – for example, using surplus materials in R&D prototypes or as service parts. The idea is to turn that stagnant inventory into cash (even if pennies on the dollar) and free up space.
- Preventive Measures: Once you remove old stock, analyze why it became excess in the first place. Was it due to a forecast that didn’t pan out? A customer cancellation? A production overshoot? Feed those lessons back into your planning process to avoid repeating the mistake. Also, institute controls so that when inventory reaches a certain threshold of slow-moving (say, more than X months of supply on hand with no orders), a review is triggered and adjustments (like halting production of that item temporarily) are made.
By regularly pruning your inventory, you keep it healthy and turning. Think of it like keeping a garden – you have to pull the weeds (obsolete stock) so the healthy plants can thrive. A company that never reviews inventory might wake up to find its turnover has dropped because 20% of its stock is practically unsellable items occupying the warehouse. Don’t let that happen – continuously monitor and clean house.
Balance Inventory Across Locations and Channels

Many manufacturers operate multiple warehouses, stock at various distribution centers, or even at retail partners. If one location is overstocked and another is understocked, your overall turnover suffers and you may also lose sales (in the understocked location). Strategies to address this:
- Inventory Rebalancing: Periodically transfer inventory from slower-moving locations to high-demand locations. For example, if your East Coast warehouse has excess units of a product that’s selling slowly there, but the West Coast is seeing higher demand and running low, move inventory over. This prevents the East Coast stock from stagnating and avoids a stockout out West. It effectively increases the sell-through of that inventory.
- Centralized Inventory Visibility: Ensure you have a system that gives a consolidated view of inventory across all sites (this is where a tool like CyberStockroom’s inventory map shines – more on that soon). With full visibility, you can identify imbalances early. Maybe you notice “Warehouse A has six months of supply for Product X, while Warehouse B has just three weeks of supply.” That’s an opportunity to shift stock (assuming logistics cost is justified) to improve overall turnover and service levels.
- Standardize Best Practices Across Sites: Sometimes one plant or warehouse is very lean and efficient, while another is less so. Share best practices and set company-wide KPIs for inventory turnover. Each facility manager should be accountable for their part of inventory performance. By aligning processes (like how they forecast, how they reorder, how they handle slow stock), you raise the overall company performance.
- Dropshipping or Direct Shipping Options: If applicable, consider shipping finished goods directly from the factory to customers or to whichever region needs it, rather than always routing through a primary warehouse that might accumulate stock. Reducing handling steps can keep inventory moving. This is more relevant if you also do distribution; manufacturers selling direct or through e-commerce sometimes adopt dropshipping methods to avoid double-handling inventory.
- Channel Inventory Management: If you allocate inventory to different channels (e.g., some stock reserved for big clients, some for online sales, etc.), keep an eye on those allocations. If one channel isn’t moving its inventory, reallocate it. For instance, if a certain product isn’t selling well through a distributor but your direct sales could move it, consider diverting stock to where it sells faster.
Balancing inventory essentially ensures every unit of inventory has the best chance of selling quickly by placing it where demand exists. It’s a dynamic strategy – as demand patterns shift, so should your inventory deployment. This prevents situations like one warehouse being a graveyard for products (hurting overall turnover) while elsewhere people are waiting for stock.
Leverage Technology and Data for Inventory Management

In the modern manufacturing environment, technology is a powerful enabler for many of the above strategies. The right systems provide visibility, analysis, and control that manual methods simply can’t match at scale. Here’s how leveraging tech can boost inventory turnover:
- Inventory Management Software: Using dedicated software (or an ERP module) to track inventory levels in real-time is foundational. These systems can automatically calculate inventory turnover by item and alert you to slow-moving stock. They also support features like automatic re-order point calculation, which helps prevent overstocking (the system can suggest orders based on actual usage rates, keeping inventory optimized).
- Demand Planning and Forecasting Tools: Advanced forecasting software uses algorithms (and even AI) to churn through historical data and external factors to create better forecasts. They often allow scenario planning – e.g., “What if sales increase 20%?” – so you can prepare inventory plans accordingly. By having a better grasp on future demand through analytics, you’ll naturally keep inventory leaner and turnover higher.
- Analytics & Dashboards: Good systems will provide dashboards that highlight key metrics like current turnover ratio, days of inventory on hand, aging stock, stockout incidents, etc. Having these metrics at your fingertips (on a big screen in the operations room, for example) keeps everyone focused on the goal of inventory optimization. You might discover, through data analysis, that certain SKUs have anomalously low turnover and then drill down to fix the issue.
- Barcoding and Scanning Technology: Adopting barcodes or RFID for inventory tracking can drastically improve accuracy and speed of transactions (receiving, moving, shipping inventory). When every movement is scanned and recorded, you reduce errors like “missing” inventory or data lags. Accurate, up-to-date inventory data is necessary to make good decisions that avoid overstocking (if your system shows an item is missing when it’s actually there unscanned, you might re-order unnecessarily). Moreover, fast check-in/check-out of inventory means less time items spend idle during administrative handling.
- Automation in Warehousing: Automated storage and retrieval systems (AS/RS), conveyor systems, or even simple carousels can speed up the movement of inventory through your warehouse, indirectly supporting turnover by fulfilling orders faster (inventory out) and integrating with production more just-in-time. Even if full automation is not in scope, consider mobile devices for warehouse workers to update inventory status on the fly.
In short, data and technology take the guesswork out of inventory management. They make it easier to implement lean and agile strategies effectively. A small manufacturer might manage with spreadsheets, but as you grow or if you have complex operations, investing in good inventory management tools often pays for itself through reduced carrying costs and improved turnover.
On that note, let’s look more closely at one particular technology solution designed for better inventory visibility and control – and how it can specifically aid your efforts in improving inventory turnover.
How CyberStockroom Can Help Improve Inventory Turnover
When it comes to putting many of the above strategies into practice, having the right inventory management system is invaluable. CyberStockroom is one such tool – a cloud-based inventory management platform with a unique visual mapping interface. Let’s explore how CyberStockroom’s features align with inventory turnover improvement for manufacturers:
Visual Inventory Map for Full Visibility
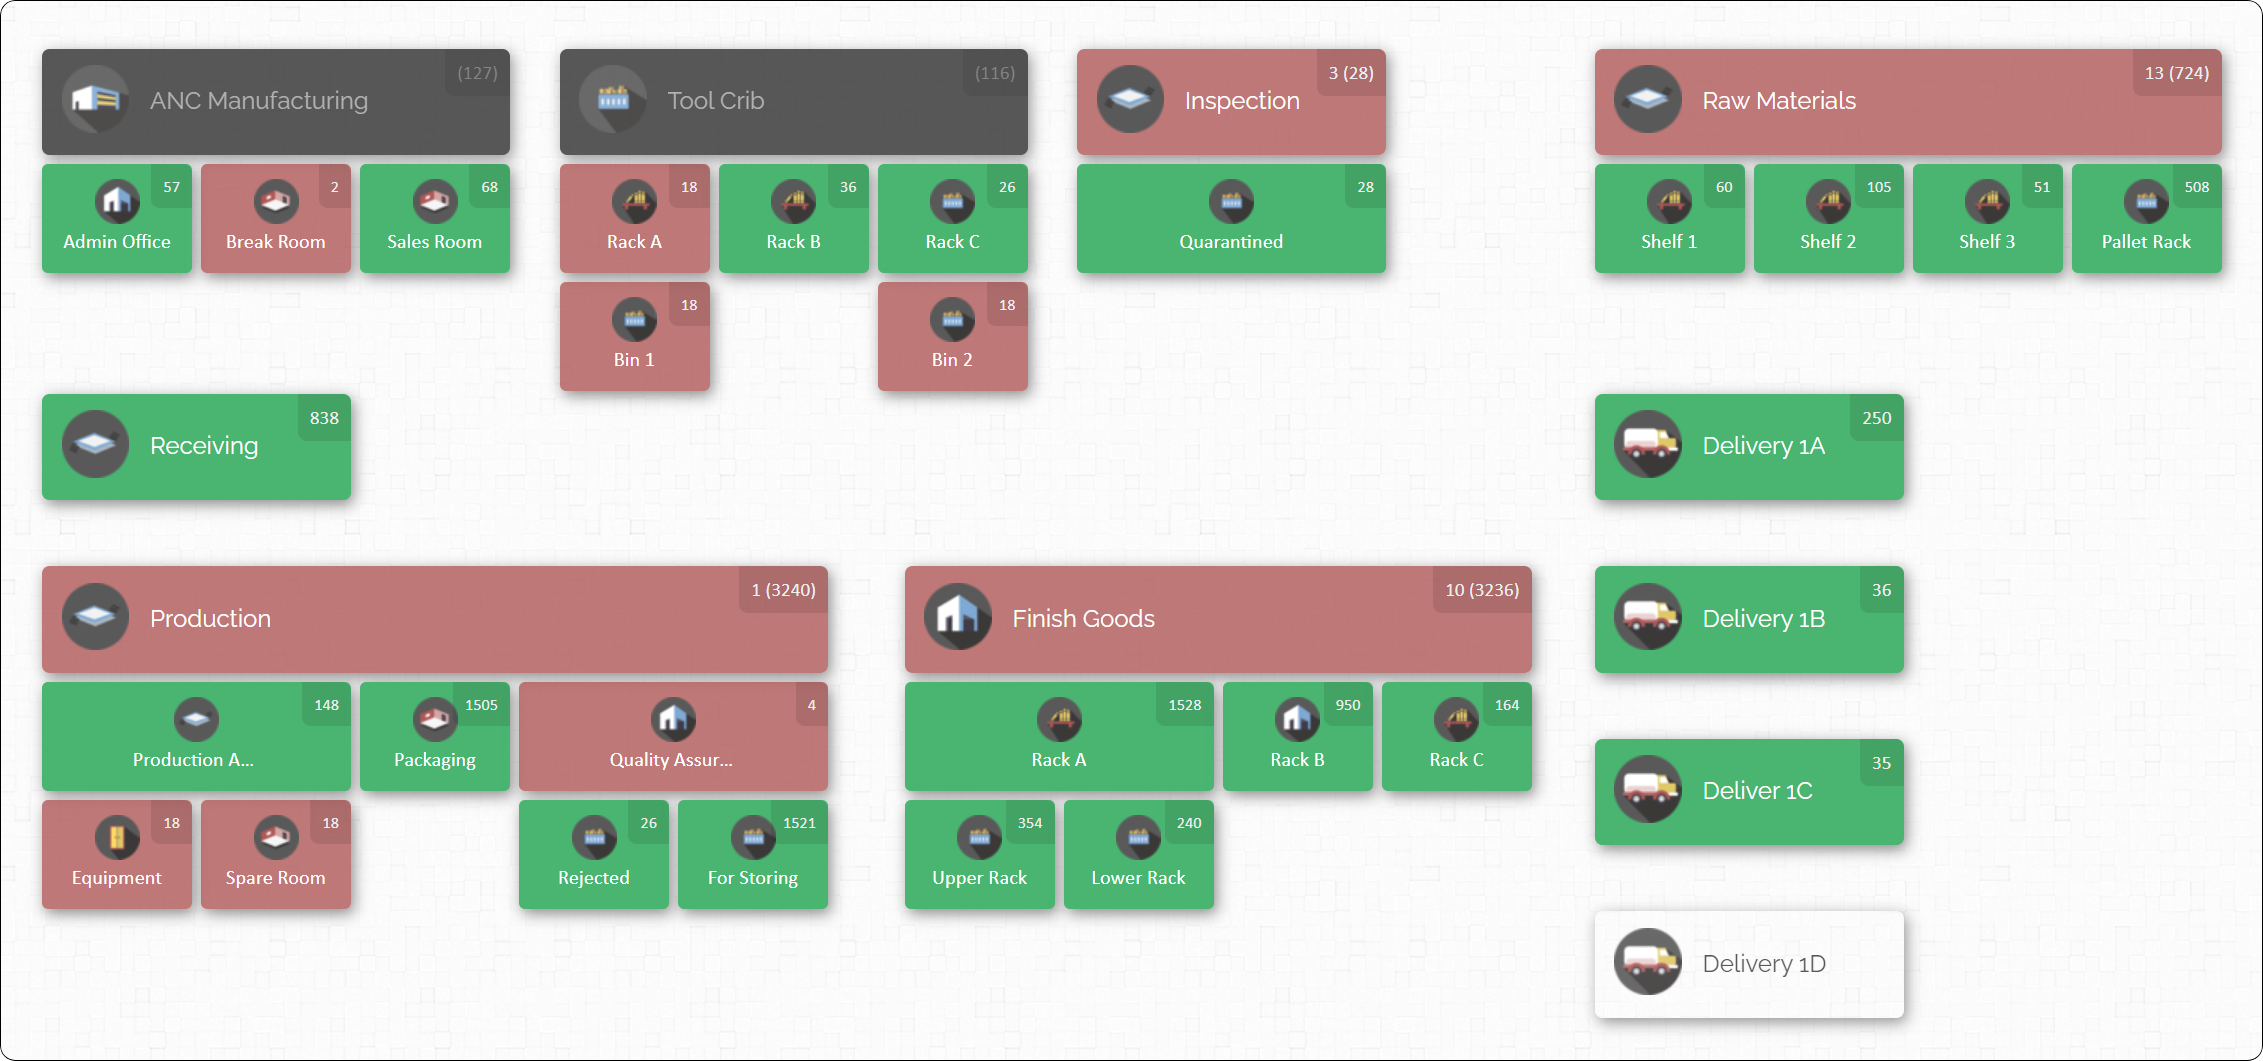
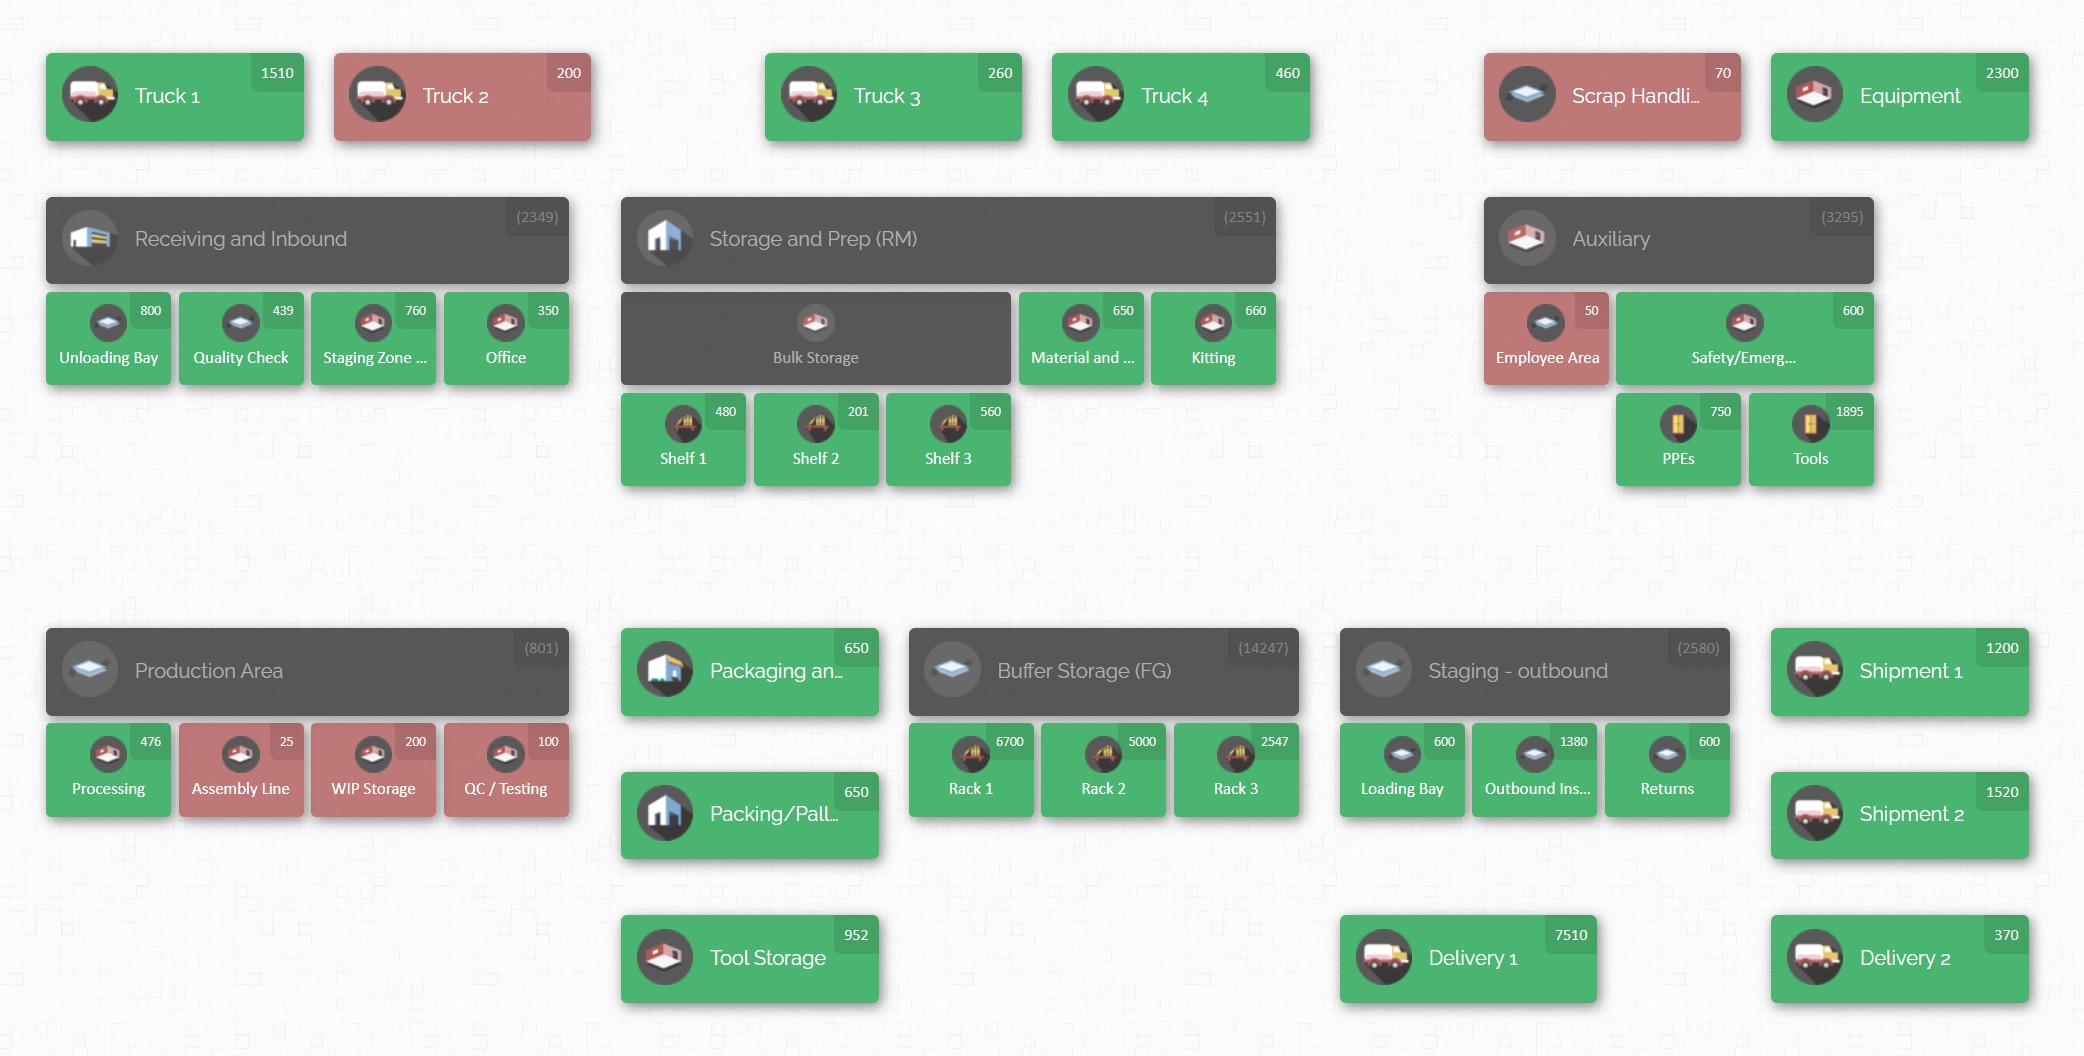
CyberStockroom allows you to create a live, interactive map of all your inventory locations – from main warehouses down to specific rooms, production areas, or even individual assembly stations. This means at any given time, you can visually see where each item is and how much you have there. For a manufacturer, this is powerful. It helps quickly identify pockets of excess inventory. Suppose your map shows that at “Warehouse A – Aisle 5” you have a large stock of a component that isn’t being used fast – you can spot it on the map (often more intuitive than lines on a spreadsheet) and take action. This full visibility ensures nothing is “out of sight, out of mind,” which is often how inventory piles up unnoticed. By bringing clarity, CyberStockroom aids in maintaining lean inventory levels across the board – a key to higher turnover.
Real-Time Tracking and Updates
Because it’s cloud-based and updated in real time, everyone – from the floor manager to the inventory analyst at HQ – sees the same current data. You can access it from any device via a web browser, allowing managers on the go or at different plant locations to stay informed. Real-time data is crucial for turnover improvement. If sales suddenly spike for a product, the system will reflect the rapid depletion of stock and you’ll know to ramp up production or redistribute inventory. If a production run finishes and adds 100 units to inventory, it’s immediately visible – prompting the sales or shipping team to get those units moving to customers. This synchronization cuts down the lags between production and sales that often slow turnover.
Drag-and-Drop Inventory Transfers
CyberStockroom’s interface lets users drag and drop items on the map to transfer them between locations virtually. This mirrors the physical act of moving stock. Say you notice on the map that Plant 1 has surplus raw material X and Plant 2 is running low (and risk slowing production, or ordering more unnecessarily). You can easily visualize and plan a transfer. By simplifying the management of inventory redistribution, the software encourages proactive balancing of stock (as discussed in strategy #6). The easier it is to do, the more likely your team will actually execute inventory rebalancing regularly, thereby keeping each location’s inventory optimized and turning over.

Cycle Counting and Accuracy Tool
Improving turnover often requires improving accuracy. CyberStockroom provides features for cycle counts – you can use the map to run a cycle count for a particular location or item category. With barcode scanning support, counts are fast and errors minimized. Regular cycle counting ensures your records match reality. This directly prevents scenarios where you think you have inventory (so you don’t sell or produce because of that assumption) but actually, you don’t – or vice versa. With high record accuracy maintained via CyberStockroom, you can confidently reduce safety stock cushions and trust that a “low inventory” alert is real. The result is leaner inventory and better turnover without risking stockouts due to bad data.
Monitoring Work-in-Process (WIP) and Production Stages
A standout feature for manufacturers is the ability to map production stages. You can create process flow maps where inventory is shown at each stage of manufacturing (e.g., “Cutting”, “Assembly”, “Quality Check”, “Finished Goods”). This gives unprecedented clarity into WIP. If one stage is holding too many pieces (indicating a bottleneck or an issue), you see it on the map. CyberStockroom essentially helps apply lean principles by exposing where inventory accumulates in the process. Managers can then tackle that stage to get items moving again. Reducing WIP levels at various stages will naturally increase turnover, as more items get finished and shipped rather than idling mid-process.
Detailed Analytics and Reporting
CyberStockroom isn’t just a pretty map – it logs every inventory transaction and movement. You get an activity history and audit trail for traceability. More importantly for metrics, it has reporting and analytics capabilities. You can generate reports on inventory levels over time, turnover rates by item or location, and other KPIs. These analytics can highlight trends, like improving or declining turnover, and help measure the impact of initiatives. For example, after implementing a lean project, you could use CyberStockroom reports to see if your average days in inventory decreased. By having this feedback loop, you can continuously fine-tune strategies. The software essentially provides the data backbone to your inventory optimization efforts.
User-Friendly for Team Adoption
A strategy or tool is only effective if people actually use it. CyberStockroom’s visual and intuitive interface lowers the barrier for your team to engage with inventory management actively. Floor staff can check inventory quickly, warehouse staff can update moves instantly, and management can visualize the operation easily. Because it’s easy to use, there’s higher compliance and participation. Everyone “plays their part” in keeping inventory records accurate and optimized. This cultural aspect – getting the whole team on board with inventory best practices – often distinguishes companies that excel in inventory turnover from those that struggle. The software helps build that culture by making it straightforward and even interesting to manage inventory (there’s a bit of gamification when you see your progress on a visual map).

In summary, CyberStockroom supports inventory turnover improvement by providing visibility, control, and analytical insight. It’s like having a real-time map of your manufacturing inventory heartbeat – you can instantly spot where the blood (inventory) is not flowing and then act on it. By using such a tool in tandem with the process improvements we discussed, manufacturers can achieve a much tighter alignment of inventory with actual needs. The result is fewer bloated stockrooms, faster movement of goods, and a stronger bottom line.
Conclusion
Inventory turnover is more than just a ratio on your financial statement – it’s a reflection of how well your manufacturing operation is tuned to demand and how efficiently it uses resources. By examining and improving this metric, manufacturers can unlock significant benefits: freed-up cash, lower storage and materials costs, less waste, and a more responsive supply chain.
In this guide, we covered how to benchmark your inventory turnover against industry standards to understand where you stand. If you find you’re below par for your sector, don’t be discouraged – use it as a motivation to improve. Even if you’re around the average, there’s likely room to become more competitive by increasing your turns. And if you’re already best-in-class, continuous improvement will help you maintain that edge.
We explored a range of inventory turnover improvement strategies – from sharpening your demand forecasts and adopting lean/JIT principles, to optimizing production schedules, trimming excess stock, balancing inventory across locations, and leveraging technology. The common thread among these strategies is efficiency and alignment: producing and stocking exactly what you need, when and where you need it. It’s about eliminating the fat (excess inventory) and strengthening the muscle (smooth operations and accurate data).


Leave a comment