
Managing inventory in a manufacturing business can often feel like a juggling act. Parts and materials move through various stages, from raw materials storage, to the production floor, to finished goods waiting for shipment.
If you’re an operations manager or a small manufacturer, you’ve likely experienced the stress of searching for a missing component or discovering a stockout at the worst possible time. Enter inventory mapping, a game-changer that lets you visualize your workflow and know exactly where everything is.
The Inventory Management Challenge in Manufacturing
Manufacturing companies face unique inventory challenges. Unlike retail operations that deal only with finished products, manufacturers handle multiple types of inventory: raw materials, work-in-progress (WIP), subassemblies, finished goods, spare parts, and more. Keeping track of all these items across various departments and storage areas can be complex and time-consuming.
Traditional inventory management methods (think spreadsheets, stock cards, or basic warehouse management systems) often fall short. They might tell you how many of an item you should have, but not where it physically resides at a given moment. This lack of inventory visibility can lead to common pain points:
- Lost or Misplaced Items: Without a clear system, components can “disappear” on the shop floor or in a stockroom, leading to frantic searches and delayed production.
- Inaccurate Stock Levels: Manual tracking is prone to errors. It’s easy to have discrepancies between reported inventory and actual counts, resulting in unexpected stockouts or overstock.
- Workflow Bottlenecks: If materials aren’t where they’re needed when they’re needed, production can grind to a halt. For example, a machine sits idle because a required part is stored on the opposite end of the facility or was never replenished.
- Higher Costs: Excess inventory ties up capital and takes up valuable space, while rush orders or downtime from missing parts inflate operational costs. Inefficiencies and mistakes ultimately affect the bottom line.
Poor inventory management can create a ripple effect of delays, wasted effort, and added costs. This is where inventory mapping comes in. By providing a clear visual representation of your inventory and its flow through the facility, inventory mapping tackles these challenges head-on.
What Is Inventory Mapping?
Inventory mapping is the process of creating a visual map of all the inventory in your business — essentially a blueprint of where every product, part, or material is located and how it moves through your workflow. Instead of viewing inventory as abstract numbers in a spreadsheet, you see it laid out like a map of your warehouse or factory floor. Think of it as turning your inventory data into an interactive floor plan: each room, zone, shelf, or bin is represented, along with the items and quantities stored there.
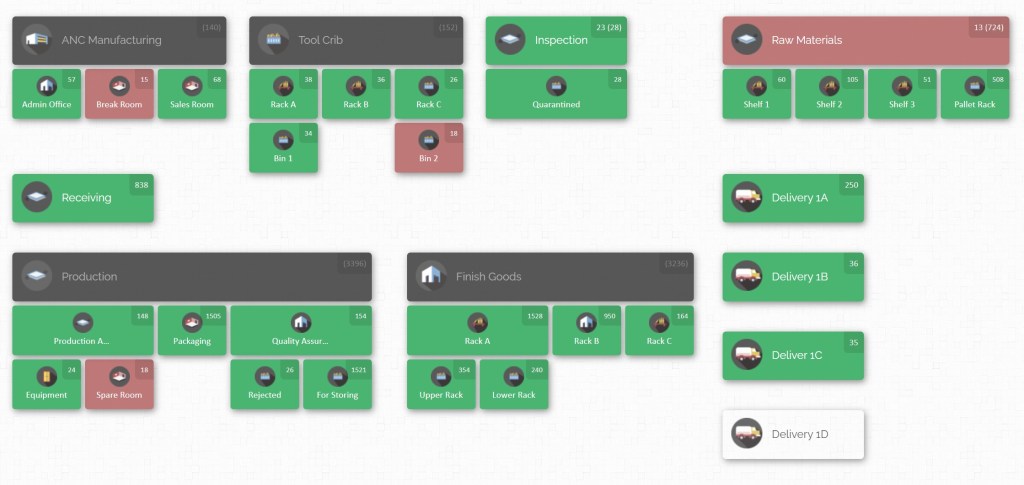
Imagine walking into your plant and having a big, poster-sized map on the wall (or more likely, on your computer screen) that shows, for example, the raw materials area, the production line, the assembly stations, the finished goods storage, and even the loading docks or delivery trucks. On this map, you can immediately spot where a particular item is. Need a particular bolt or a specific widget? The map tells you it’s in Aisle 3, Bin B of the warehouse or Storage Cabinet 7 in the assembly area, with 150 units on hand.
This visual approach to inventory is what inventory mapping is all about: inventory visualization that answers the crucial questions “What do we have, and where is it?” at a glance.
Key components of an inventory map include:
- Locations and Zones: These are the major areas in your facility or supply chain, such as warehouses, rooms, production cells, or storage zones. In a manufacturing context, you might have zones like Raw Materials Storage, Tool Crib, Production Line 1, Quality Inspection, Finished Goods, etc.
- Sublocations or Bins: Within each zone, inventory can be further organized into specific bins, shelves, racks, or containers. For instance, under a Raw Materials zone, you might have Shelf 1, Shelf 2, Pallet Rack A, etc. This hierarchy lets you drill down to very precise locations.
- Inventory Quantities: The map doesn’t just show where things are — it also shows how many are in each spot. Each location or bin on the map can display current stock levels. This way, you can instantly see, for example, that Shelf 2 in Raw Materials has 60 units of Item X, while Shelf 3 has 105 units.
- Item Details (if needed): Depending on the system, you could click on or inspect a location on the map to get details about the items there — such as SKU, description, lot number, or even images of the product. This adds context beyond just the count, like knowing which raw material batch is on which pallet.
Inventory mapping turns your inventory data into a living map of your operations. It’s like having a real-time bird’s-eye view of your manufacturing workflow, where you can zoom in on any department or station and know what’s happening there inventory-wise.
Why Visual Inventory Mapping Matters
When you can see everything at once, you can manage everything better. It’s about working smarter, not harder, and ensuring that your inventory supports your production workflow rather than hinders it.

Shifting from lists and tables to a visual inventory map brings a wealth of benefits. Let’s break down how inventory mapping can transform your manufacturing operations:
- Unprecedented Visibility: “Where’s that part?” becomes an easy question when you have a map. Inventory mapping provides visibility and transparency into your operations. You can see all inventory locations and levels at once, which means no more guesswork. This high visibility lets managers and teams quickly spot issues like a near-stockout in one area or overstock piling up in another. When you can visually pinpoint where every item is, you spend far less time searching or cross-checking records.
- Faster, Streamlined Workflow: A visual map helps optimize workflow by ensuring materials flow smoothly to where they need to be. For example, you might notice on your map that a particular component travels a long distance from storage to the assembly line, slowing down production. By rearranging layout or moving that component’s storage closer to the point of use (something you’d realize thanks to the map), you eliminate wasted travel time. The result is workflow optimization: orders get fulfilled faster, production lines avoid waiting on parts, and employees move efficiently through their tasks.
- Improved Accuracy and Reduced Errors: Human error in inventory management — such as misplacing items or miscounting stock — is greatly reduced when everything is visually organized. If every item has a designated spot on the map, it’s easier to return items to the correct location and spot when something is out of place. Inventory visualization also aids cycle counts and audits; employees can go location by location following the map, which ensures no section is overlooked. This leads to more accurate inventory records, which in turn means fewer production surprises (like thinking you had 50 units on hand when there are only 5).
- Better Space Utilization: Warehousing space is expensive, and clutter is the enemy of efficiency. Inventory maps help you analyze how space is used. You might discover, for instance, that one shelf is full while the next shelf is half-empty, or that finished goods are taking up a prime spot needed for raw material overflow. With a mapped view, you can reorganize and optimize space utilization — store items in the right locations and consolidate where needed. This not only fits more product in the same footprint but can also improve safety (clearer aisles, less over-stacking) and reduce the need to expand storage space.
- Enhanced Decision Making: Having data visually organized empowers quicker and better decisions. Managers can identify trends and patterns at a glance, such as seasonal inventory buildups or frequent stockouts in a particular part of the workflow. For example, an inventory map might reveal that Work-in-Process inventory is consistently accumulating before a certain machine (a bottleneck indicator). Management can then decide to add capacity or change the process at that point. In another case, seeing that Department A always runs short of a component mid-week might prompt adjusting reordering points or redistributing stock from Department B which always has surplus. In short, transparency leads to insight, which leads to action.
- Traceability and Accountability: In industries with compliance requirements or lot tracking (like food production or aerospace), knowing exactly where each lot of material is at all times is crucial. An inventory map, especially when tied to an inventory management system, allows for full traceability. If there’s a recall or quality hold needed, you can swiftly locate all affected items on the map. Additionally, mapping brings a level of accountability to the team — it’s clear who last handled or moved items if the system logs it, and any anomalies stand out (e.g., an item found in the wrong spot can be corrected).
- Adaptability and Collaboration: A visual system is inherently more intuitive. New employees can learn the layout of the operation faster by referring to the inventory map, accelerating training and onboarding. Cross-functional teams (from production to warehouse to purchasing) can all literally get on the same page by looking at the same map, improving communication. If you need to make changes — say, repurpose an area for a new product line — you can update the map and instantly communicate the new plan visually to everyone. This makes your operation more agile in responding to changes or growth.
Inventory mapping isn’t just a neat visualization trick; it directly addresses pain points by making your inventory information clearer and more actionable.

Lean Inventory Systems and Workflow Optimization
For those practicing or consulting in lean manufacturing, inventory mapping aligns closely with your goals. Lean principles aim to eliminate waste and create smooth flow in production. One of the classic eight wastes in lean is excess inventory (having more stock than needed at a given time). While lean techniques like Just-in-Time (JIT) and Kanban focus on reducing inventory levels, inventory mapping supports these lean inventory systems by providing the clarity and control needed to operate with lower stocks safely.
Here’s how mapping your inventory helps in a lean context:
- Identifying Waste: With a map, it’s easy to spot where inventory is piling up. Maybe you find that a buffer stock in front of a certain work center is far above what’s actually required — a red flag for overproduction or a bottleneck downstream. By visualizing WIP and stock points, you can identify and eliminate such waste, keeping inventory levels optimal.
- Smoother Flow: Lean is all about flow. Materials moving seamlessly from step to step. An inventory map highlights the workflow in your facility. You can trace the path of a material from receiving to final product. If something spends too long in a staging area or travels a convoluted path, the map makes that evident. This insight lets you rearrange physical layouts or process steps to streamline the flow (a key aspect of workflow optimization).
- Visual Management: Lean organizations emphasize visual management (think of the colorful Kanban cards, signage, shadow boards for tools, etc.). An inventory map is a powerful visual management tool for stock. It serves as an information radiator – at a glance, anyone can understand the state of the inventory system. This visual cue can replace or enhance daily stand-up meetings or kanban board reviews by showing current inventory status for each section of the workflow in real time.
- Quick Response to Problems: In lean practice, when there’s a problem on the line, you want to address it immediately (often via andon signals or alerts). An up-to-date inventory map can act as an alert system. For example, if a certain raw material zone on the map turns red or flashes because it’s below its threshold, it’s a clear signal to restock or investigate. This beats waiting for someone to manually report a shortage. The result is a more responsive system that avoids downtime.
- Empowering Kaizen (Continuous Improvement): Inventory mapping provides a baseline to measure improvements. If you conduct a kaizen event to improve material flow, you can map the “before” and “after” and clearly see the improvement (shorter distances, fewer piles of inventory, etc.). Continually updating and analyzing the map helps maintain the gains and find new opportunities to refine your lean inventory management.
Integrating inventory mapping with lean practices creates a synergy: lean gives you the strategy to reduce waste and inventory, while mapping gives you the tactical tool to monitor and execute that strategy effectively. Whether you’re a lean consultant or an ops manager aiming for leaner operations, using inventory mapping will make your workflow optimization efforts much more effective.
How to Implement Inventory Mapping in Your Manufacturing Workflow
Ready to put inventory mapping into action? In this section, we’ll walk through a step-by-step guide to create and use an inventory map for your manufacturing operation. This process will take you from initial planning all the way to daily use and continuous improvement. Let’s dive in:
Step 1: Define Your Goals and Objectives

Start by clarifying why you are implementing inventory mapping. What do you hope to achieve? Having concrete goals will guide your mapping project and help you measure success later. For example, your objectives might be: “Reduce the time spent locating parts by 50%,” or “Improve inventory accuracy from 90% to 99%,” or “Enable real-time visibility of stock across all departments.” You might also have specific pain points to address, like eliminating those frequent last-minute expeditions to find missing tools, or syncing up inventory between the warehouse and the production floor.
Write down your goals and share them with your team. This way, everyone understands the purpose of the project (whether it’s workflow optimization, cost reduction, better customer satisfaction, or all of the above). Clear goals will also help in choosing the right tools and methods in later steps.
Step 2: Catalog Your Inventory and Locations

Next, gather the data you’ll need for mapping. This involves two things: inventory data and location data.
- Inventory Data: Compile a list of all items that you stock or use in production. This includes raw materials, components, subassemblies, finished products, and even consumables (like packaging materials or maintenance supplies) if you want to map those. For each item, note important details like item name/SKU, current quantity on hand, and perhaps category or type. If you already have an inventory management system or spreadsheet, extract the data from there. The key is to have a clean, up-to-date inventory list as your starting point.
- Location Data: Make a list of all the physical locations where inventory resides. Think broadly: every storage room, warehouse section, production area, staging area, rack, shelf, cabinet, and bin that holds inventory. In a small facility, this might be as simple as “Warehouse A racks 1-5, Floor storage by Station 3, Finished Goods shelf.” In a larger operation, you may have dozens of locations (which is exactly why a map will help!). Organize locations in a hierarchy if applicable: e.g., Building > Area > Rack > Shelf > Bin. If you already use location codes or labels (like bin numbers), gather those too.
This step is essentially an inventory audit and a facility review. Some companies take the opportunity to do a quick cycle count or verification during this step to ensure the data they’re about to map is accurate. The mantra here is “garbage in, garbage out” — a map is only as good as the data behind it, so ensure your counts and location lists are reasonably correct.
Step 3: Map Out Your Facility Workflow and Zones

Now, begin creating the layout for your inventory map. This is the design phase where you translate your physical space into a diagram. You don’t need fancy software for this initial layout sketch — a pen and paper drawing or a whiteboard might be a good start, or even a simple diagramming tool.
Identify and draw the major zones or areas in your workflow. For manufacturing, common zones include:
- Receiving: Where inbound materials arrive.
- Raw Materials Storage: The area (or areas) where raw stock is kept.
- Kitting/Preparation: If you kit parts before they go to production, mark that area.
- Production Lines or Work Cells: Each production line, assembly cell, or work center that holds WIP inventory or uses materials.
- Quality Inspection or Testing: If finished (or intermediate) goods go through QA, note that location.
- Finished Goods Storage: Where completed products await shipment or delivery.
- Packaging and Shipping: Areas for packing finished goods and staging for outbound shipment.
- Tool Cribs or Maintenance Stock: Many plants have a tool crib or MRO (maintenance, repair, operations) inventory area for spare parts and tools.
- Off-site or Secondary Locations: If you have multiple buildings or an external warehouse or yard, include those in your map structure as well.
Lay these out in a way that roughly represents their actual physical relationship. For example, Receiving might connect to Raw Materials storage, which then feeds into Production, which then leads to Finished Goods, etc. You can draw arrows or connect lines to denote the typical flow of materials through these stages. This starts to look like a workflow map of inventory movement.
Within each zone, break it down into the specific sublocations (racks, shelves, bins) from your location list. You might not draw every bin on a paper sketch, but note how you will represent them. For instance, you could decide that on the final map, clicking on “Raw Materials” will zoom in to show shelves 1, 2, 3, etc., each containing certain items.
If you’re a visual thinker, this step is fun — you’re essentially creating a blueprint of your operations. It’s okay if it looks rough at first; you’ll refine it when you put it into a digital format. The goal is to have a clear picture of all the places inventory lives and flows in your manufacturing process.
Once you have your main zones and flow sketched out, double-check it against your step-by-step production process. Ensure that every place where inventory could pause or be stored is accounted for on the map. It’s better to include too much detail than to miss something important. You can always simplify later if needed.
Step 4: Choose the Right Inventory Mapping Tool

With a plan in hand, consider how you will create and maintain this inventory map. You have a few options:
- Manual Methods: If you’re very small-scale, you might start with a physical whiteboard or printed map posted on a wall, with markers or sticky notes to indicate inventory levels. However, this can become hard to keep current and is not ideal for real-time updates. Another manual method could be a spreadsheet matrix representing locations, but that again loses the intuitive visual aspect.
- Mapping Software or Apps: In most cases, a software solution is the way to go for inventory mapping — especially if you want real-time updates and easy changes. There are specialized manufacturing inventory software tools that offer visual mapping features. When evaluating options, look for features like drag-and-drop layout design, the ability to define custom locations and sublocations, and real-time inventory tracking.
Tip: Make sure the tool can handle your complexity (number of SKUs, number of locations) and is user-friendly for your team. CyberStockroom, for example, is an inventory management platform designed with a strong visual mapping interface. It lets you build a virtual map of your operation (matching the zones you sketched out) and then track all your inventory on that map. We’ll dive more into CyberStockroom in the next section, but keep in mind key features such as multi-warehouse support, barcode integration, and ease of use when choosing a tool. - Integration Capabilities: If you already have an ERP or MRP system managing your inventory, you might not want a totally separate system just for mapping. In that case, look for software that can integrate with your existing systems or import/export data easily. Some inventory mapping solutions can pull data from spreadsheets or other databases so you don’t have to manually duplicate efforts. The ideal scenario is a tool that becomes a visual front-end for your inventory data.
Budget can be a factor as well, but consider inventory mapping as an investment that will pay off in efficiency. There are affordable solutions out there (and even free trials to test them). The time saved and errors avoided will likely justify the cost.
Step 5: Build Your Inventory Map in the System

Now it’s time to create the map in your chosen tool. Using the software, start by setting up the structure of locations we identified earlier:
- Create Locations/Zones: Enter the main areas (zones) as top-level locations in the system. For example, create locations named “Receiving,” “Raw Materials,” “Production Floor,” “Tool Crib,” “Finished Goods,” “Shipping,” etc. Many tools will allow a hierarchical layout, so you can create parent-child relationships (e.g., “Production Floor” containing “Line 1”, “Line 2”, etc., each of those containing sublocations like stations or bins).
- Add Sublocations: For each zone, define its sublocations. For instance, under “Raw Materials,” add sublocations for each rack or shelf (Rack A, Rack B, or Shelf 1, 2, 3, etc.). Under “Finished Goods,” maybe you have “Shelf A,” “Shelf B,” or specific pallet locations. If you’re using something like CyberStockroom, you might visually draw these sublocations onto a map layout, placing them in a way that resembles their physical layout.
- Populate Initial Inventory Data: Once the map structure (the empty containers/locations) is ready, start assigning your inventory to their respective locations on the map. This is where your inventory list from Step 2 comes into play. For each item on your list, you’ll “place” it in the correct spot on the map and input the current quantity. For example, item ABC123 (Steel Bolts) – put 500 units in “Raw Materials > Shelf 1” on the map, and maybe another 100 units in “Production Floor > Line 2 > Station B bin” if some are staged at the line. Do this for all items so that the map accurately reflects where everything is as of now.
- Visual Customization (optional but helpful): Take advantage of any visual customization the software offers. You might color-code locations on the map for clarity — e.g., make Raw Materials zone green, Production red, Finished Goods blue, so it’s easy to differentiate at a glance. You could use distinct icons for different types of locations (a factory icon for production areas, a warehouse icon for storage, a truck icon for delivery vehicles, etc.). Custom labels or images can also make the map more intuitive (for example, a little pallet icon to represent pallet storage). The goal is to make the map not only accurate but also easy to interpret quickly.
At this stage, you have a digital twin of your inventory on screen. Take a moment to compare it with reality: walk through the facility with the map in hand and ensure things line up. It’s normal to find a few discrepancies or remember additional storage spots that were missed earlier — update the map accordingly. Initial accuracy is important to gain trust in the system, so double-check that the counts and locations are as correct as possible.
Step 6: Implement Tracking Mechanisms (Barcodes, QR, RFID)

To keep your inventory map accurate over time, you’ll want to integrate some tracking technology into your process. This is how your map will stay up-to-date as inventory moves or quantities change:
- Barcode/QR Code Scanning: If you haven’t already, consider labeling your inventory items or bins with barcodes or QR codes. Most modern inventory software (including many manufacturing inventory software packages) support scanning. For example, when materials arrive at Receiving, staff can scan a barcode on the purchase order or on the product, then scan the location (which also has a barcode label). This action can automatically update the map: e.g., 50 units of Part X moved into Raw Materials Shelf 2. Later, when those 50 units are pulled to the production line, scanning them out of Shelf 2 and into the Production area will again update the map. Scanning greatly reduces manual data entry and mistakes, ensuring the real-time inventory on the map reflects the physical world.
- RFID (Radio-Frequency Identification): For an even more automated approach, RFID tags can be attached to pallets or high-value items, and fixed scanners (or handheld ones) update the system when items pass certain checkpoints (like leaving the stockroom or entering a production zone). RFID can provide a continuous flow of data to your map without needing manual scans for each move. It’s more costly to implement than barcodes, but in high-volume environments it might be worth it for true real-time visibility.
- Check-in/Check-out and Transfer Recording: Set up processes in your system for transferring inventory. For example, if someone from Assembly needs 20 units of a component from the warehouse, how will that transaction be recorded? Ideally, they would create a transfer or pick ticket in the system (maybe via a mobile device or a kiosk) which moves the inventory on the map from the Raw Materials zone to the Production zone. Encourage the discipline of recording every inventory movement in the system as it happens. Whether via scans, RFID, or quick manual form entry, this habit is key to keeping the map reliable.
- Threshold Alerts: As part of tracking, define reorder points or min/max levels for your key items in each location if your system allows it. The map can often visually alert you (say by turning a location red) when an item drops below its threshold. This is incredibly useful for proactive replenishment. For instance, if “Line 1 Station A bin” is supposed to always have at least 30 units of Part Y, and it falls below that, the system could flag it. This turns your map into not just a reflection of the past and present, but a tool to manage the future (preventing stockouts).
By integrating these technologies and processes, your inventory map becomes a dynamic living tool. Every time an item is received, moved, or used, the map updates. That means anyone looking at it — whether on a large monitor in the warehouse or on a manager’s tablet — can trust that it’s showing the current state of affairs.
Step 7: Train Your Team and Integrate the Map into Daily Operations

The best inventory map in the world is useless if the people on the floor don’t use it or update it. Training and change management are critical at this stage:
- Educate the Team: Explain to your staff why inventory mapping is being implemented and how it will make their jobs easier. Instead of framing it as extra work (“now you have to scan items in and out”), highlight the benefits to them: less time hunting for stuff, clearer instructions on where to put things, fewer emergencies due to missing parts, etc. When people see it as a tool that reduces frustration, they’ll be more eager to adopt it.
- Hands-On Training: Train the relevant employees on the new software or process. This might include warehouse personnel learning how to use handheld scanners or the inventory app, production supervisors learning how to view the map to check on material status, and purchasing/planning folks learning how to interpret the map’s data for their needs. Use real examples from your operation during training (like “Let’s all look at the map and see where Part ABC is stored and how many we have. Now let’s simulate moving some to the assembly line…”).
- Make the Map Accessible: Ensure the inventory map is easy to access for those who need it. This could mean installing a large screen in the warehouse or production floor that displays the map dashboard, or providing tablets at workstations, or at least ensuring everyone has the software on their computer. The map should be a go-to reference throughout the day. For example, if a worker in assembly is running low on a component, they should be able to quickly check the map to see if more stock is available in the tool crib or if it’s still in receiving.
- Embed in Procedures: Update your standard operating procedures (SOPs) to include using the inventory map. Receiving procedures should include steps to enter new stock into the map. Order fulfillment or production issuing procedures should include steps to record the movement of goods via the map. By formalizing it, you ensure the process continues beyond the initial excitement of rollout.
- Encourage Feedback: Your team on the ground might have great insights into making the mapping system even better. Maybe they find that certain location names are confusing on the map, or they suggest color-coding different categories of parts. Encourage them to share feedback and make them feel ownership over the system. This will improve the tool and also increase buy-in.
Remember, any new system has a learning curve. There might be initial hiccups, like someone forgetting to record a move or confusion over how to find something on the map. Stay patient and supportive — as the team gets used to it, the map will quickly become second nature and even indispensable.
Step 8: Monitor, Improve, and Update Regularly

Now that your inventory mapping system is up and running, the journey isn’t over — it’s ongoing. To get the most out of it, treat it as a living project that requires regular attention and continuous improvement:
- Daily/Weekly Monitoring: Make it a habit to check the map at the start or end of each day (or each shift). Look for any anomalies: is something showing zero when you know there should be some stock? Is an area of the map not getting updated at all (which could indicate someone isn’t following the process)? Regular monitoring helps catch discrepancies early so you can investigate and correct them before they become big problems.
- Inventory Audits: Even with a great system, periodic audits are healthy. Perhaps every month or quarter, pick a section of the map and physically verify the inventory there. This will highlight if any processes are being bypassed or if certain items tend to have errors. Use cycle counts to keep accuracy high and sync the map if any differences are found.
- Optimize Layout and Flow: Use insights from the map to make improvements. For example, if you consistently see that one particular component is always being transferred from one side of the facility to the other, consider moving its storage location closer to its point of use to reduce transit time. Or if a certain rack is always empty while another is overflowing, you might redistribute stock levels or reassign space. The visual nature of the map makes such inefficiencies much more visible, acting as a guide for kaizen activities. Over time, your facility layout and inventory placement can evolve to be much more efficient thanks to these observations.
- Scale and Integrate: As your business grows or changes, update the map. New product line? Add a new zone to the map. Expansion to a second warehouse? Integrate that into the map as another location. If you start working with external fulfillment centers or consignment stock at customer sites, those could be included as well (many mapping tools allow multi-site mapping). Also, consider integrating more data into the map environment: some systems let you overlay additional info like production status, or link the map to purchasing (so you see in the map if something is on order). The more integrated it is with your operations, the more of a central hub it becomes.
- Celebrate Successes: Last but not least, acknowledge the improvements that inventory mapping brings. When you hit that goal of “50% reduction in search time” or you notice fewer emergency part shortages, share that success with the team. Perhaps you find that monthly inventory variance has plummeted — that’s worth celebrating! Recognizing these wins will reinforce the importance of maintaining good practices and show everyone the value of the system they’re contributing to.
By following these steps, you’ve not only implemented inventory mapping, but also set in motion a culture of visibility and continuous improvement. Your manufacturing workflow is now under a visual management system that will pay dividends in efficiency and peace of mind.
Using CyberStockroom for Inventory Mapping and Visualization
While you can create an inventory map with various tools, one solution purpose-built for this task is CyberStockroom. CyberStockroom is a cloud-based inventory management software that puts a visual spin on tracking inventory.

It essentially allows you to create a customizable map of your business and then manage your inventory on that map in real time. Here’s how CyberStockroom can help take your inventory mapping to the next level:
- Intuitive Visual Maps: CyberStockroom’s interface centers around a drag-and-drop map builder. You can recreate your facility layout by adding rooms, areas, and sublocations on a canvas. It’s easy to label each location (for example, “Tool Crib” or “Line 1 Assembly”) and even upload background images or use icons, so the map looks like your actual floor plan. This means when you or your team look at the dashboard, it’s immediately clear where everything is happening.
- Real-Time Inventory Visibility: Every product entry in CyberStockroom can be assigned to one or more locations on the map with specified quantities. As transactions occur (stock is added, moved, or removed), the changes reflect instantly on the map. For instance, if 100 units of Part Z are moved from Raw Materials to Production, you’ll see those numbers shift on the respective locations in real time. This live updating visual prevents the scenario of working off yesterday’s data — you’re always looking at now.
- Multi-Location and Warehouse Management: For businesses that operate across multiple warehouses or have inventory in several places (say a main factory, a remote storage site, and some items in transit or with field technicians), CyberStockroom shines by letting you incorporate all these into one map hierarchy. You might have a top-level map for “My Company” which breaks down into different buildings or sites, each with their internal map. Yet, it’s all accessible in one platform, giving a comprehensive view of inventory across your entire operation.
- Barcode Integration: CyberStockroom supports the use of barcodes to accelerate check-in and check-out. You can print location labels (each location on the map can have a unique code) and item labels. Scanning an item and a location can quickly update the system to move inventory, which keeps your map accurate without fuss. This ties back to Step 6 of our implementation — CyberStockroom has this capability built-in, which means you don’t need separate third-party software for barcode tracking.
- Custom Fields and Flexibility: Manufacturing operations often have unique needs — like tracking lot numbers, serial numbers, expiration dates, or other attributes. CyberStockroom allows custom fields for products, so you can capture whatever data is important and have it accessible when clicking on an item in the map.
- Analytics and Reports: Beyond the map itself, CyberStockroom provides reporting tools that can analyze your inventory data. You could generate reports on inventory levels by location, track historical movements, or monitor usage rates. These insights complement the visual map by giving you hard numbers to back up decisions (like understanding turnover rates for each part, or identifying that one area of the plant consistently is drawing more inventory than others). Some metrics like inventory turnover or carrying costs can be derived and improved upon with the clarity provided by the system.
- Collaboration and Accessibility: Being cloud-based, everyone on your team who needs it can access the inventory map from their device, whether they are on the shop floor with a tablet or at home preparing a production plan. CyberStockroom’s ease of use means even non-technical users (think: shop floor personnel who might not love complex ERP screens) can interact with it without feeling overwhelmed. It essentially provides a common visual language for inventory that all departments can understand.
In practice, adopting CyberStockroom can significantly cut down the time and effort required to implement inventory mapping. The software handles the heavy lifting of data management and updating the visuals, so you can focus on analyzing the information and improving your operations.
Many small and medium manufacturers prefer a tool like this because it doesn’t require a big IT department to set up and maintain. You get the sophistication of a real-time system and the simplicity of a visual map all in one.
If you’re considering inventory mapping, CyberStockroom is definitely worth exploring as a solution to accelerate and enhance the process. It embodies the principles we’ve discussed in this guide and packages them in an accessible platform.
Map Your Way to Efficient Manufacturing
In the fast-paced world of manufacturing, knowledge is power — and there’s no better way to know your inventory than to see it mapped out in front of you. By now, we’ve seen that inventory mapping for manufacturing is more than a buzzword; it’s a practical approach to mastering your workflow. From pinpointing that elusive part in seconds, to identifying process bottlenecks, to fostering a leaner, more responsive operation, the benefits are substantial.
Implementing an inventory mapping system does take some effort up front: you’ll plan your layout, possibly invest in a software tool, and train your team on new habits. But once it’s in place, the day-to-day gains are enormous — less time wasted, fewer errors, smoother production schedules, and a lot less stress when audit time comes or when a customer asks for a rush order. You’ve essentially given your team an x-ray vision of the company’s stock and material flow, and that clarity permeates every decision and action thereafter.
As you visualize and optimize your workflow, don’t overlook the value of the right tools to support you. If you want to make this journey easier and more effective, consider leveraging CyberStockroom to jumpstart your inventory mapping. With its visual inventory maps and user-friendly features, it can drastically cut down the implementation time and help you reap the rewards of mapping sooner.
Ready to transform your inventory management? It’s time to put away the clipboards and endless spreadsheets and embrace a better way to work. Start mapping your inventory and see your manufacturing workflow in a whole new light. Whether you begin with a simple sketch or dive in with CyberStockroom’s interactive maps, the key is to take action. Visualize your inventory, streamline your operations, and watch as efficiency and peace of mind reach new heights.

Happy mapping, and here’s to a more organized, efficient, and productive manufacturing operation!


Leave a comment