
In manufacturing, inventory is meant to protect flow: keep lines running, meet customer dates, and avoid firefighting when suppliers slip. Yet the same inventory quietly drains profit every day it sits still. Those hidden drains are what people mean by inventory carrying costs (also called inventory holding costs), and they commonly add up to a sizeable annual percentage of the value of inventory you keep on hand.
That matters because the costs are not confined to the warehouse. Carrying costs show up as cash tied up in raw materials and work-in-progress, floor space taken away from productive work, overtime spent hunting for parts that “should be here somewhere,” write downs when engineering changes make components obsolete, and the slow creep of shrinkage (loss from damage, errors, or theft).
Inventory Carrying Costs in Manufacturing and Why They Matter
Manufacturing inventory is not one thing. It is typically a mix of:
- Raw materials: inputs waiting to be issued to production.
- Work-in-progress: partially finished goods in the production process, which include costs already incurred (materials, labour, and overhead) before the item becomes finished goods.
- Finished goods: items ready for sale or shipment.
- MRO: consumables, spares, tools, and supplies used to maintain operations but not built into the final product.
That last category, MRO, catches many plants out. It often looks “small” line by line, yet it can become sprawling across departments: spare motors, bearings, PPE, lubricants, sensors, fasteners, tool bits, and specialist parts that are hard to source quickly. MRO is defined specifically as items used in production but not incorporated into finished goods, and it includes spare parts and tools for equipment repair.
Now connect that mix back to finance. Inventory sits inside working capital. Working capital is commonly defined as current assets minus current liabilities, and inventory is usually one of the biggest current assets for manufacturers. When inventory grows faster than sales, you can end up with cash locked in stock instead of invested in capacity, quality, maintenance, or new product work.
Operationally, inventory can also mask problems. In lean thinking, unnecessary inventory is explicitly recognised as a form of waste in production systems. That does not mean “zero inventory at all costs.” It means inventory should be intentional, visible, and sized to a clear reason such as lead time risk, minimum order constraints, or customer service commitments.
A practical way to make the conversation concrete is to use two metrics that link operational behaviour to cash:
- Inventory turnover is commonly calculated as COGS divided by average inventory, and it indicates how many times inventory is sold and replaced in a period.
- Days inventory outstanding is commonly calculated as (average inventory ÷ COGS) × 365, and it indicates how long inventory sits before being converted into sales.
If you are pursuing inventory carrying cost reduction, these metrics matter because they make time visible. The longer inventory sits, the more it attracts capital costs, storage costs, service costs, and risk costs.
The Full Anatomy of Inventory Carrying Costs

Most operating teams underestimate carrying costs because they look only at obvious warehouse expenses. A more complete view splits carrying costs into several buckets. A widely used breakdown is four categories: capital costs, storage costs, service costs, and inventory risk costs.
Capital costs
Capital costs include the cost of money tied up in inventory, and may include financing costs such as interest and fees if inventory is funded through borrowing. Even when you are not borrowing directly for inventory, there is an opportunity cost: cash locked in stock cannot be used elsewhere. This “unseen” opportunity cost is part of why carrying costs can undermine profitability while everything looks calm on the shop floor.
Storage costs
Storage costs include the physical space and operation of storing inventory: rent or mortgage, utilities, handling, equipment, and the day-to-day costs of running the warehouse or stockroom. In manufacturing, storage costs often expand beyond the warehouse into overflow racks, containers, temporary floor staging, and even external storage when space becomes constrained.
Service costs
Service costs can include insurance, taxes, and the administrative and systems costs of managing inventory. This is where plants often miss the true cost: cycle counts, stock reconciliation, compliance reporting, and the management time spent resolving disputes about “what the system says” versus “what is really there.”
Risk costs
Risk costs cover what can go wrong while items are held: shrinkage, damage, deterioration, and obsolescence. Shrinkage is frequently described as the gap between inventory records and the physical count, and it can result from errors and theft as well as damage. Obsolescence is particularly painful in manufacturing environments with frequent engineering changes, short product lifecycles, or customer-driven variants. When inventory loses value, firms may need to record write downs to reflect that the market value has fallen below book value.
When you add these buckets together, you get the concept many teams miss: carrying costs are often expressed as a percentage of total inventory value per year, and many sources cite a typical range in the 20% to 30% region, varying by industry and circumstance.
Two manufacturing-specific realities make this percentage feel “real” in day-to-day operations:
- WIP is not free. WIP represents materials, labour, and overhead already incurred for goods still in production stages. Holding more WIP than necessary can inflate lead times, complicate scheduling, and hide quality issues.
- MRO can behave like a black hole. MRO items support production without becoming part of finished goods, and the lack of visibility into quantities and locations is a common reason organisations carry excessive safety stock in MRO.
A useful mental model is this: every additional unit of inventory you hold is not merely a “buffer.” It is a claim on cash, space, attention, and risk capacity.
How to Calculate Inventory Carrying Costs and Diagnose the Real Drivers

To reduce carrying costs, you need a calculation that the whole plant can accept. The goal is not perfection in accounting taxonomy. The goal is a consistent method that helps you compare month to month and identify the big drivers.
A common formula expresses carrying cost as a percentage:
Inventory carrying cost (%) = (Total carrying costs ÷ Average inventory value) × 100
A practical approach for manufacturers:
- Choose a time period that matches your decision rhythm. Many organisations calculate annually, but operational control usually needs monthly or quarterly checkpoints. Annual calculations are often recommended for a big-picture view, with more frequent reviews aligned to your sales or production cycles.
- Calculate average inventory value for the same period. Average inventory is commonly computed as (beginning inventory + ending inventory) ÷ 2.
- Build your cost buckets. Keep it simple at first:
- Capital cost estimate (opportunity cost or financing cost)
- Storage and handling (space, utilities, warehouse labour, equipment)
- Service (insurance, taxes, systems, admin)
- Risk and quality losses (shrinkage, damage, obsolescence/write downs)
- Do not stop at a single plant-wide percentage. Segment it. Plant-wide averages hide pockets of waste. Segment by:
- Inventory type: raw, WIP, finished goods, MRO
- Product family or line
- Location: central warehouse vs line-side vs maintenance crib
Then layer in prioritisation tools:
- ABC analysis for focus. ABC analysis is an inventory management technique that classifies items based on importance, often using consumption value and the Pareto principle. In manufacturing, ABC-style segmentation helps you avoid wasting time applying the same controls to every bolt and gasket. Instead, you apply tight governance to high-value or high-risk items, and lighter controls to low-value consumables.
- Cycle counting for trust in the numbers. Cycle counting is a method of regularly counting subsets of inventory to confirm physical counts match records, rather than relying solely on infrequent full inventories. This matters for inventory carrying cost reduction because poor record accuracy creates two expensive behaviours at once: over-ordering “just in case,” and emergency purchases when the system says stock exists but the bin is empty.
Now add diagnostics that explain “why the stock is here.”
- Use DIO and turnover to spot time-based pain. Days inventory outstanding (DIO) is commonly calculated as (average inventory ÷ COGS) × 365, and a different way to compute it is 365 ÷ inventory turnover. If DIO rises while service levels do not improve, the extra inventory is likely compensating for forecast errors, long lead times, unreliable internal flow, or weak inventory discipline.
- Ask plant-level root-cause questions. A simple set of questions often reveals more than a dashboard:
- Where do we routinely find duplicate stock because no one trusts the primary location?
- Which SKUs trigger line stoppages, then get “overfixed” with overbuying?
- Which items are repeatedly expedited, even though the annual spend is predictable?
- Which “temporary” staging areas have currently been “temporary” for years?
- Which items do we keep “because we might need them,” with no clear consumption pattern?
When the same themes repeat, you have identified your true carrying-cost drivers: not the warehouse. The system of decisions.
Inventory Carrying Cost Reduction Playbook for Manufacturers

The best inventory reductions are not heroic one-off clearouts. There are changes to how decisions are made and how inventory is handled daily. The sections below are written as operational levers, each directly tied to one or more carrying-cost buckets.
Start with flow, not the storeroom: reduce WIP where it is created
If your plant has chronic WIP buffers between work centres, it is often a flow and scheduling issue, not a warehouse issue. One way to frame the problem is Little’s Law, which links WIP, throughput, and lead time in steady-state systems. The implication for inventory carrying cost reduction is straightforward: if throughput does not change, reducing WIP reduces lead time, and shorter lead time reduces the amount of inventory you need to protect delivery performance.
How manufacturers usually reduce WIP safely:
- Reduce batch sizes where feasible.
- Improve changeovers so small batches are not punished.
- Tighten release rules (do not launch work because “it is on the schedule” if downstream is blocked).
- Make bottlenecks visible and protect them with disciplined buffers rather than flooding the system.
This aligns with lean’s view of excess inventory as waste.
Treat safety stock as a policy, not a feeling
Safety stock is extra inventory held to reduce the risk of stockouts due to uncertainty in supply and demand. In manufacturing, safety stock tends to grow when lead times are unstable, yields vary, and forecasting is weak. You will rarely succeed at inventory carrying cost reduction if you only ask people to “carry less.” You need to improve the conditions that caused them to carry more.
Practical actions that reduce safety stock pressure:
- Reduce supplier lead time variability where possible.
- Improve planning parameters, then review them regularly rather than leaving them frozen for years.
- Separate true demand variability from self-inflicted variability (schedule instability, last minute engineering changes, poor internal kitting).
Use pull signals where consumption is predictable
Kanban is described as an inventory control system used in just-in-time manufacturing to track production and trigger replenishment of parts and materials as they run out, with the intent of limiting excess inventory buildup. This is useful in manufacturing because it makes replenishment driven by actual usage, not by periodic panic.
For inventory carrying cost reduction, kanban helps most when:
- Usage is relatively stable.
- Lead times are known.
- The replenishment loop is physically or digitally visible (so “empty” becomes unmissable).
Apply EOQ carefully: optimise ordering versus holding costs
Economic order quantity (EOQ) is a model intended to find an order size that minimises the combined costs of ordering and holding inventory, using a formula that balances the variables. In practice, EOQ can be helpful for stable-demand items where order costs are meaningful and holding cost assumptions are realistic. It becomes misleading when demand is volatile, when suppliers impose rigid minimum order quantities, or when engineering changes can make stock obsolete.
Use EOQ as a starting point, then stress-test it:
- What happens if demand drops 30%?
- What happens if a revision change makes the item unusable?
- What happens if lead time doubles?
The purpose is not to worship a formula. It is to ensure you are not buying “cheap unit price” at the expense of expensive carrying costs.
Get serious about MRO: it is a manufacturing risk, not a cupboard
MRO items include spares and tools required for maintenance and operations, and stockouts can create disruption far beyond the cost of the item itself. That fear drives hoarding and duplication: departments stash “their” spares because they do not trust central availability. Fragmentation and lack of visibility into quantities and locations are widely cited MRO issues.
A practical MRO reduction programme usually includes:
- Data clean-up: remove duplicates and unify naming conventions.
- Location discipline: one home location per item where possible, with controlled satellite bins.
- Usage visibility: separate “critical spares” from “habitual overbuying.”
- Controlled issue and return: stop the slow leakage of consumables with no accountability.
Prevent shrinkage and misplacement by making movement traceable

Shrinkage is often described as a difference between what records show and what physical counts reveal, with causes including errors and theft. If you permit uncontrolled movement, inventory carrying costs rise twice: you lose stock, then you buy replacements. Traceability is therefore a direct inventory carrying cost reduction lever.
Cycle counting supports this by detecting issues earlier, improving inventory accuracy, and avoiding long periods where problems compound.
Reduce obsolescence by tightening lifecycle controls
Obsolescence is a risk cost. When inventory loses value, firms may need to record write downs to reflect the reduction in value on the balance sheet. For manufacturers, obsolescence is often driven by:
- Engineering change activity
- End-of-life decisions
- Customer-specific variants
- Long supplier lead times that force early buys
Countermeasures include:
- Clear “last time buy” governance
- Segregated locations for superseded parts until disposition decisions are made
- Faster disposition cycles for dormant stock (sell, rework, return, scrap)
Shift the inventory burden upstream when appropriate
Two supply arrangements can shift carrying cost and risk dynamics:
Consignment inventory is a model where the supplier retains ownership of goods until they are sold or used under agreed terms, which can shift inventory carrying costs away from the holder of the physical goods.
Vendor-managed inventory (VMI) is an approach where the supplier takes responsibility for managing and replenishing the customer’s inventory within agreed performance targets, aiming to reduce shortages and surpluses.
These arrangements are not universal fixes. They require strong agreements, clear data, and defined responsibilities. Used well, they can support inventory carrying cost reduction by reducing the buyer’s working capital tied up in inventory and improving replenishment discipline.
CyberStockroom and Visual Inventory Mapping for Manufacturing Cost Reduction
Inventory cost reduction programmes often fail for a simple reason: teams cannot reduce what they cannot see. When visibility is limited to spreadsheets and abstract location codes, it is easy for inventory to become “somewhere in the building” rather than “in bin B-14, two shelves up, behind the guard rail.”
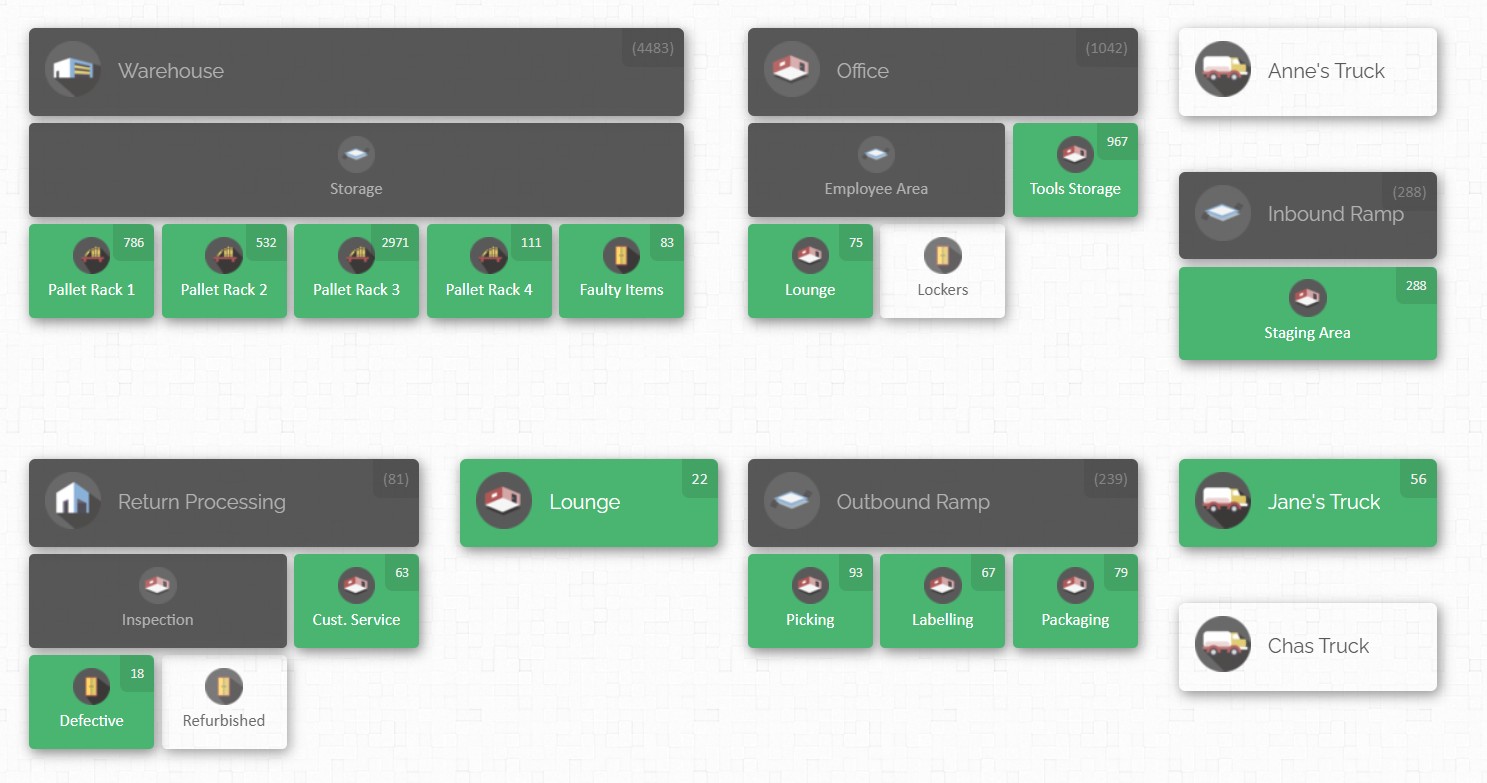
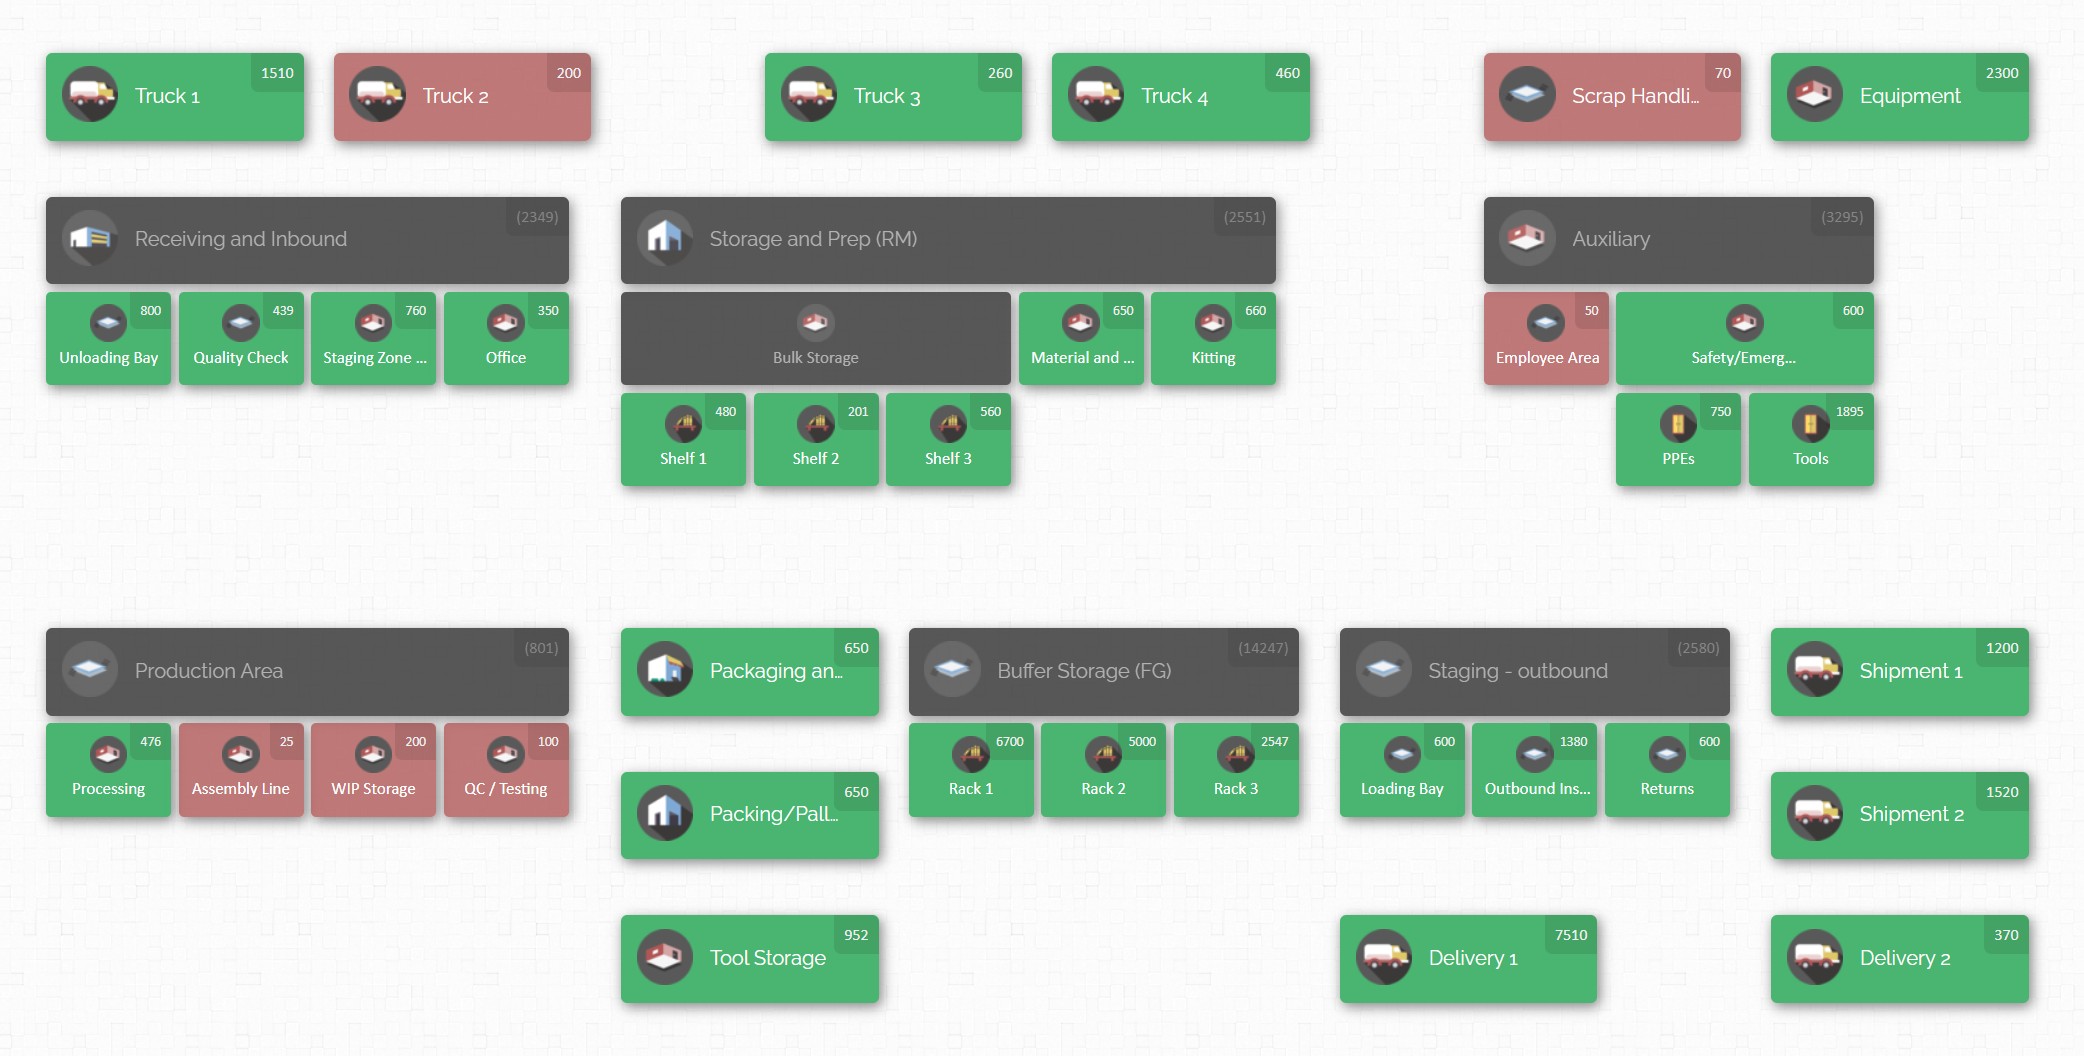
CyberStockroom’s defining capability is map-based inventory management: it lets teams build a visual representation of their business layout and manage inventory and assets on that map. The platform’s inventory map is described as a visual representation of a warehouse or inventory space that can be customised to match the real layout, with labelled locations and locations arranged to reflect actual setups.
For manufacturing operations, the relevance to inventory carrying cost reduction is practical rather than theoretical. Visual mapping supports cost reduction through day-to-day behaviours that influence carrying costs.
Better location clarity reduces “shadow inventory”
A common reason plants overbuy is the belief that inventory is missing when it is simply misplaced. A map that mirrors rooms, shelves, and bins makes it easier to find items and confirm quantities by location. CyberStockroom emphasises inventory visibility through its map layout, including the ability to view location contents and see product quantities.

Controlled movement with fast transfers reduces handling waste
CyberStockroom supports moving items between locations using drag-and-drop transfers on a visual map. In manufacturing, this matters because materials frequently move between receiving, quarantine, kitting, line-side storage, WIP buffers, and finished goods staging. When movement is fast and recorded, the system stays trustworthy, which reduces over-ordering driven by doubt.
Barcoding reduces errors at the point of transaction
CyberStockroom states that every interface accepts keyboard or barcode scanner input, supporting barcoding for tasks like receiving, picking, and transfers. The platform also describes a “Quick Scan” tool to perform multiple transaction types such as check-ins, check-outs, and transfers efficiently. For inventory carrying cost reduction, fewer transaction errors means fewer discrepancies, fewer emergency buys, and fewer disputes about which number is correct.
Activity history creates accountability and supports shrinkage reduction
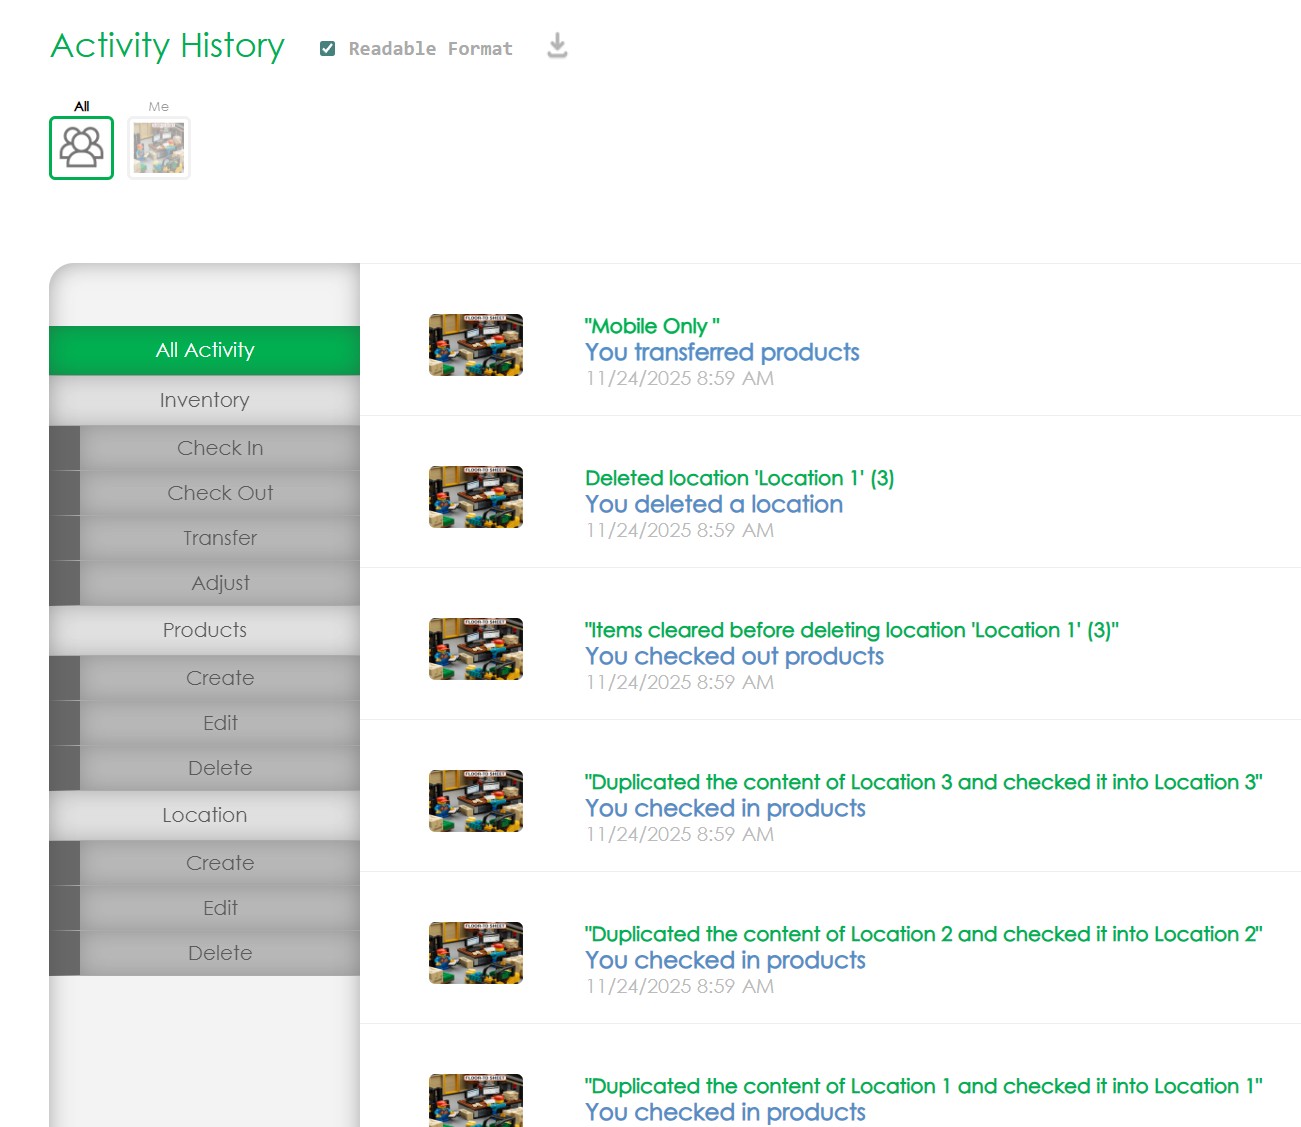
CyberStockroom describes an activity history that functions like a ledger: it can be filtered by user, activity type, timespan, and location, and it can be exported as a report. This directly targets risk costs, particularly shrinkage, because it helps teams identify who last interacted with an item and what happened to it.
Spreadsheet import and bulk updates reduce the friction of getting started
A common barrier to inventory improvement is the burden of migrating messy data. CyberStockroom supports uploading inventory from spreadsheets and describes importing product catalogues in bulk rather than adding items one at a time. It also describes batch processing for bulk product edits and moving large numbers of items. If the system is easier to implement and keep updated, it is more likely to stay accurate, which is a prerequisite for sustainable inventory carrying cost reduction.
Custom fields support manufacturing context without forcing rigid templates
CyberStockroom supports adding custom fields such as manufacturer, supplier, category, and other item attributes, and encourages users to customise the map to the structure of their business. For manufacturing, this can support practical controls such as:
- distinguishing approved suppliers
- identifying critical spares
- associating items to departments or cost centres
- flagging shelf-life, revision, or inspection status fields (where relevant)
The value is not that custom fields “fix inventory.” The value is that they make inventory decisions faster and less dependent on tribal knowledge.
Cloud access supports multi-location operations
CyberStockroom describes itself as cloud-based inventory management software, providing access from internet-enabled devices and supporting multi-location and multi-level mapping (down to rooms, shelves, and bins).

Turning Inventory from a Cost Burden into an Operational Advantage
Inventory is essential to manufacturing, but the cost of holding it often grows quietly in the background. Storage space fills up. Capital gets tied up in materials that are not immediately needed. Obsolescence risk increases. Administrative overhead expands as teams struggle to maintain visibility.
These costs rarely appear all at once. Instead, they accumulate across insurance, handling, storage, depreciation, shrinkage, and working capital constraints. Over time, even small inefficiencies in inventory management can translate into significant financial impact.
Understanding inventory carrying costs is the first step. Reducing them requires something more practical: clear processes, reliable location tracking, and consistent visibility into what exists, where it is, and how quickly it moves through production.
Manufacturers that succeed in inventory carrying cost reduction usually focus on a few operational fundamentals:
- Clear location structures across warehouses, yards, and production areas
- Consistent tracking of materials, components, and tools
- Faster identification of excess, slow-moving, or obsolete inventory
- Improved coordination between purchasing, production, and storage
- Better use of available space and existing stock before ordering more
When teams can quickly answer simple operational questions such as “How many do we have?” and “Where exactly are they located?”, inventory decisions become faster and more accurate. That clarity helps prevent overordering, reduces unnecessary safety stock, and improves overall inventory turnover.
Tools that visualize inventory locations and movements can play an important role in supporting these improvements. By mapping inventory spaces and connecting them to real product records, teams gain a clearer operational picture of how materials flow through their environment.
If your organization is exploring ways to improve visibility and reduce unnecessary inventory costs, it may be worth seeing how a map-based inventory system works in practice. A short hands-on trial can often reveal opportunities for improving location accuracy, reducing search time, and tightening inventory control across manufacturing operations.
You can schedule a discovery call to explore how a visual inventory approach might fit into your own processes and support ongoing inventory carrying cost reduction efforts.


Leave a comment