
In today’s competitive marketplace, inventory data analytics has become a critical tool for businesses to maximize profits while controlling costs. Rather than relying on gut instinct or outdated spreadsheets, companies are turning raw inventory data into actionable insights that drive smarter, more profitable outcomes. Effective inventory analytics helps identify inefficiencies, reduce carrying costs, and optimize stock levels – ultimately enabling better decision-making at all levels of the supply chain. Whether you’re a warehouse manager overseeing stock in a distribution center or a manufacturing director coordinating raw materials and finished goods, leveraging data can transform how you manage inventory.
What is Inventory Data Analytics and Why Does It Matter?
Inventory data analytics refers to the use of data analysis techniques and software to monitor, manage, and optimize inventory. It involves tracking key metrics (like stock levels, sales rates, and turnover) and applying analytical methods to uncover patterns and trends in inventory behavior. In essence, it’s about converting the day-to-day transaction data from your operations into meaningful insights that guide decision-making. For example, analytics can reveal which products are selling quickly and which are sitting idle, how seasonal demand affects stock requirements, or where inefficiencies in the supply chain are causing delays.
Why does this matter? Because inventory is a double-edged sword for businesses: too much stock ties up cash, increases storage costs, and risks obsolescence, while too little stock leads to missed sales, unhappy customers, and a damaged reputation. Finding the right balance is challenging, and that’s where data analytics makes a difference. By identifying patterns invisible to the naked eye, inventory analytics helps businesses strike an optimal balance – ensuring you have just enough of the right items at the right time. In practice, this means fewer costly stockouts, less money wasted on excess inventory, and a more efficient operation overall.
Moreover, data-driven inventory management is becoming a must-have in modern industry. Many companies still rely on manual processes or spreadsheets for tracking inventory, but these methods are time-consuming and error-prone. In fact, over 40% of businesses today manage inventory with manual methods and another 26% rely on basic spreadsheets. This lack of real-time visibility and analytical capability often leads to inefficiencies. Data analytics addresses these challenges by providing integrated, timely insights. Instead of reacting to inventory problems after they occur (like discovering a stockout only when a customer complains), managers can proactively anticipate issues. In short, inventory data analytics matters because it enables proactive, evidence-based decisions that improve service levels, reduce costs, and ultimately boost profitability.
Key Benefits of Data-Driven Inventory Decisions

Adopting inventory analytics yields tangible benefits for organizations, especially in manufacturing and warehousing. Here are some of the major advantages of leveraging data insights for inventory management:
- Reduced Carrying Costs: Holding inventory isn’t free – expenses like storage, insurance, and spoilage can consume 15–27% of the inventory’s value per year in carrying costs. Analytics helps pinpoint where you’re overstocked or holding items too long. By identifying products that linger in the warehouse or items consistently over-ordered, you can adjust purchasing and avoid tying up capital unnecessarily. The result is leaner inventory and lower carrying cost, freeing up cash flow.
- Higher Service Levels & Fewer Stockouts: Nothing frustrates a customer or production line more than a needed item being out of stock. Data analytics enables more accurate demand forecasting and reorder point setting by analyzing historical sales, seasonality, and lead times. With better forecasts and visibility, you can maintain optimal safety stock levels and anticipate demand surges, drastically reducing the incidence of stockouts. Fewer stockouts mean more sales captured and higher customer satisfaction. At the same time, analytics can highlight phantom inventory (stock that shows in records but isn’t actually available) so you can correct data errors that might otherwise lead to unexpected shortages.
- Optimized Stock Levels: Data-driven insights help avoid the extremes of overstocking and understocking. For instance, analytics might reveal that certain slow-moving items haven’t sold in months – signaling that it may be time to discontinue or heavily discount those products to clear space. Conversely, fast-moving items can be identified so you ensure adequate supply. By continuously analyzing turnover rates and days of inventory, managers can calibrate ordering and replenishment strategies to keep inventory levels in the optimal range (enough to meet demand but not so much as to bloat storage costs).
- Greater Efficiency and Productivity: When inventory decisions are driven by data, operational efficiency improves. Real-time analytics dashboards and automated alerts can notify teams of low stock or impending shortages, prompting timely action before crises hit. This reduces fire-fighting and last-minute expediting. Additionally, automating data collection and reporting saves employees from tedious manual work, giving them more time to focus on value-adding tasks. According to industry research, inefficiencies in inventory management (often from manual processes) are a key driver for tech investment – using analytics tools can eliminate those inefficiencies. For example, a warehouse manager using a live dashboard can identify a picking bottleneck or an inventory discrepancy immediately, rather than spending hours doing a physical audit.
- Supply Chain Agility and Risk Reduction: Modern supply chains face frequent disruptions – from demand spikes to supplier delays. Inventory analytics equips businesses to respond with agility. By mapping out inventory data across the entire network (from suppliers to warehouses to stores), managers gain a real-time view of supply and demand. This enables better contingency planning, such as repositioning inventory when one location is overstocked and another is at risk of running out. Analytics can also highlight weak links (like a single supplier that’s causing frequent stock delays) so you can address them (for instance, by qualifying a backup vendor or holding strategic buffer stock). Overall, data-driven inventory management improves resilience against uncertainties by providing the facts needed to adapt quickly.
- Improved Financial Performance: Ultimately, better inventory decisions translate to better financial outcomes. By selling through inventory faster (higher turnover) and avoiding excess stock, companies improve their cash flow and return on investment in inventory. One important metric here is Gross Margin Return on Inventory (GMROI) – essentially, how many dollars of gross profit you earn for every dollar invested in stock. Analytics helps maximize GMROI by focusing investment on the right products. It also reduces write-offs for obsolete stock and prevents lost sales from stockouts, directly contributing to higher profitability.
In short, leveraging inventory data leads to leaner operations, higher sales, and stronger customer relationships. Now, let’s dive deeper into how exactly businesses can extract these insights – starting with the metrics and tools that make it possible.
Core Inventory Analytics Metrics and KPIs

To effectively use inventory data analytics, it’s important to track the right metrics. Key Performance Indicators (KPIs) act as the compass for your inventory strategy, telling you where you’re excelling and where to improve. Below are some of the core inventory analytics metrics and what they reveal:
- Inventory Turnover Ratio – This measures how many times your inventory is sold and replaced in a given period. It’s calculated as cost of goods sold divided by average inventory value. A higher turnover ratio indicates that stock is moving quickly (good liquidity), whereas a low turnover suggests overstocking or slow sales. Tracking turnover helps you identify sluggish products and find opportunities to clear excess stock or improve marketing for slow movers. For example, if your turnover ratio is 8, it means you roughly sell out and replace inventory 8 times a year – a sign of efficient stock use. If it’s only 2, you might be carrying too much inventory relative to sales.
- Days of Inventory (Days Sales of Inventory, DSI) – Closely related to turnover, DSI tells you the average number of days it takes to sell through the inventory on hand. It’s essentially the inverse of turnover ratio expressed in days. A lower DSI means inventory is selling faster, which is generally positive for cash flow. Monitoring DSI helps in understanding how long capital is tied up in stock and can highlight products that linger too long. For instance, if Product A has a DSI of 90 days and Product B is 30 days, Product A might need attention (either via promotions or reduced ordering) to avoid obsolescence.
- Stockout Rate – This KPI tracks how often items are out-of-stock when customers want to buy them (or when production needs them). It can be measured as the percentage of orders or demand instances where the item was unavailable. A high stockout rate is a red flag indicating lost sales and poor service. By analyzing stockout occurrences, you can identify which products or locations frequently run dry and investigate why. Perhaps the demand is higher than forecasted or the reorder threshold is set too low – analytics will bring that to light so you can adjust reorder points or safety stock. The goal is to drive stockout rates down as low as possible without overshooting on inventory.
- Service Level and Fill Rate – Service level is the probability of not hitting a stockout, often tied to how well customer demand is fulfilled from stock on hand. Fill rate is a related metric indicating the percentage of customer orders (or lines) that are completely fulfilled. These metrics reflect customer satisfaction – a 98% fill rate, for example, means 98% of items ordered were available for immediate delivery, whereas 85% would suggest many customers face backorders or delays. Improving these through analytics (by better forecasting and inventory positioning) can significantly enhance customer loyalty. The challenge is to improve service levels without massively increasing inventory – a balance that data insights help achieve by pinpointing where a small increase in stock can have a big service impact versus where inventory is sitting idle.
- Carrying Cost Percentage – This is the proportion of your inventory value that you spend on holding costs per year. As mentioned, it often ranges from 15–25% for many businesses, though it can vary. It includes warehousing, insurance, spoilage, and the cost of capital. Analytics tools can calculate your carrying cost and, importantly, identify the worst offenders – for example, products that contribute most to carrying cost due to their volume or storage requirements. By knowing your carrying cost percentage and the drivers behind it, you can devise strategies to lower it (like through just-in-time deliveries, better warehouse layout, or reducing slow-moving stock).
- Gross Margin Return on Investment (GMROI) – GMROI is a profitability metric that tells you how many dollars of gross margin you earn for each dollar invested in inventory. It’s calculated as gross profit divided by average inventory cost. A GMROI above 1 means you’re selling inventory for more than its cost (good), while below 1 means you’re not even recouping the cost on average (bad). Using analytics, companies can compute GMROI by product category or even SKU. This helps highlight which items are truly profitable and which are margin drains. For example, you might find that Product X has a GMROI of 1.5 (for every $1 in stock, it generated $1.50 in gross profit) whereas Product Y is only 0.8. Armed with this insight, you might discontinue or re-price Product Y, and allocate more capital to Product X or similar high-GMROI products. GMROI essentially links inventory management to financial performance – ensuring your inventory dollars are spent on the right products.
These are just a few of the key metrics. Others include Order Cycle Time (how long it takes to replenish stock), Return Rates (how much inventory comes back as returns, which can signal issues in quality or fulfillment), and Forecast Accuracy (how closely your forecasts match actual demand, crucial for continuous improvement). By consistently monitoring a balanced set of KPIs, managers gain a data-driven pulse on their inventory health. This forms the backbone of continuous improvement – you can’t improve what you don’t measure, and these metrics provide measurable targets for better inventory control.
To make these metrics truly useful, though, you need the right data feeding into your analytics system and the right tools to visualize and interpret the numbers. Next, we’ll look at how to gather inventory data and the analytics tools that turn data into actionable insights.
Data Sources and Tools for Inventory Analytics

Accurate and comprehensive data is the foundation of inventory analytics. Most companies have multiple systems where inventory-related data resides – bringing these together gives a holistic view of your operations. Typical data sources that feed inventory analytics include:
- Point-of-Sale (POS) Systems: These record every sales transaction in retail settings. POS data is vital for understanding product sell-through rates, peak selling times, and demand patterns at the store level. Analytics draws on POS data to calculate metrics like turnover and to improve demand forecasts (since it shows real customer buying behavior in real time).
- Enterprise Resource Planning (ERP) Systems: The ERP is often the central system for inventory balances, purchase orders, and production data in manufacturing. It holds information on current stock levels, incoming supply, customer orders, and historical usage. This data allows analytics tools to track on-hand inventory versus commitments, lead times from suppliers, and more. Integration with ERP means your analytics always reflect the latest inventory position and can match it against sales and production plans.
- Warehouse Management Systems (WMS): A WMS tracks the movement and storage of goods within warehouses. It can provide granular data on where each item is stored (aisle, shelf, bin), inbound and outbound shipments, and even handling times. For analytics, WMS data is useful to assess warehouse efficiency (e.g., how quickly items move through or how long they dwell in a certain area) and to identify any bottlenecks in fulfillment. For instance, if the WMS shows certain SKUs consistently sit in receiving for days before shelving, that’s a process issue to investigate.
- E-commerce Platforms: If the business sells online, the e-commerce system provides real-time visibility into online orders and demand trends. Analytics can combine this with brick-and-mortar sales data to give a full picture of multi-channel demand. This helps in inventory allocation (deciding how much stock to keep for online vs. store) and in spotting trends (maybe an item sells slowly in stores but rapidly online, suggesting a different stocking strategy for each channel).
- Supplier and Procurement Data: Your purchase orders, supplier lead times, and delivery performance records are another key input. These data help analytics tools measure how reliable each supplier is (e.g. do they deliver on time consistently?) and factor that into safety stock or reorder point calculations. For example, if Supplier A has an average lead time of 10 days with high variability, analytics might suggest a higher safety stock for items from that supplier compared to Supplier B who reliably delivers in 3 days.
Bringing together these data sources is often achieved through integration or periodic data imports into an analytics platform. Many modern inventory management systems or business intelligence (BI) tools can connect to multiple systems and consolidate the data. The goal is to have a single source of truth for inventory information so that reports and analyses consider all relevant factors (sales, stock, in-transit, on-order, etc.).

Once the data is in place, analytics software and dashboards play the pivotal role of turning raw data into visual, digestible insights. Instead of poring over hundreds of rows in a spreadsheet, managers can use dashboards that display the data in charts, graphs, and alerts. For instance:
- Interactive dashboards may show a real-time inventory heatmap of your warehouse or stores, highlighting in red the items that are below minimum stock and in green those that are well-stocked. This at a glance identifies where attention is needed.
- Trend charts can display sales and inventory levels over time, helping spot seasonal peaks or downturns. If you see a clear spike in demand every November, you know to plan inventory accordingly.
- Analytics tools can set up notifications – for example, sending an alert when inventory of a critical part drops below a threshold, or when an item hasn’t sold in X days (indicating potential dead stock). These proactive alerts ensure nothing falls through the cracks without someone being aware.
- Some advanced systems allow running what-if simulations. You could simulate, say, “What if we increase our reorder quantity by 20% for item Y – how would it affect carrying cost versus stockout risk?” The system could model the outcome using historical data and show if it reduces stockouts significantly or just increases excess stock.
The use of visual dashboards and automated analytics not only speeds up decision-making but also democratizes data. In the past, perhaps only analysts or managers would crunch inventory numbers occasionally. Now, with user-friendly dashboards, even front-line warehouse supervisors or purchasing agents can easily interpret the charts and take actions within their scope. For example, a warehouse team lead might check a dashboard each morning to see if any SKU in their area is at risk of stockout and then fast-track the replenishment for that SKU that day. Data isn’t confined to reports that arrive weeks later; it’s live and at everyone’s fingertips.
In implementing inventory analytics tools, it’s important to choose solutions that fit the business’s needs. Consider factors like integration capabilities (can it connect to your POS/WMS/ERP easily?), user-friendliness (is the interface intuitive for your team?), and scalability (can it handle growing data volume and additional locations as you expand). Also, think about whether you need predictive analytics features such as demand forecasting and automatic reorder suggestions, not just descriptive analytics of past data.
With data and tools in place, the real magic happens in analyzing and interpreting the results. One of the powerful aspects of inventory analytics is the ability to not only describe what has happened (descriptive analytics) but also to forecast what might happen next (predictive analytics). Let’s explore how both of these play a role in making better decisions.
Descriptive vs. Predictive Analytics in Inventory Management
Inventory analytics can generally be categorized into descriptive analytics and predictive analytics, and each serves a crucial purpose in the decision-making process.
- Descriptive Analytics – “What happened and why?”
Descriptive inventory analytics focuses on interpreting historical and current data to understand what has already happened. This includes generating reports and summaries of key metrics: for example, last month’s inventory turnover, the current stock levels and valuation, or an analysis showing that Product X had a 5% stockout rate last quarter. Descriptive tools highlight trends and problem areas from the past and present. If carrying costs spiked this year compared to last, descriptive analytics will flag that and break down which items or locations caused it. This kind of analysis is essential for diagnosing issues and identifying areas for improvement. It provides the evidence for questions like, “Where are we losing money in our inventory?” or “Which products had the most volatile demand this season?” By understanding these historical patterns, managers can root out inefficiencies (for instance, discovering that miscounts in warehouse A led to discrepancies or that Item Y frequently went out of stock every summer due to a surge in demand). Descriptive analytics is all about creating a clear picture of your inventory performance up to now. - Predictive Analytics – “What’s likely to happen next?”
Predictive inventory analytics uses statistical models and often machine learning algorithms on your data to forecast future outcomes. In practical terms, this might mean forecasting demand for the next quarter, predicting the risk of a stockout for each SKU, or estimating optimal reorder quantities. For example, predictive models can analyze years of sales data, combined with variables like seasonality and even external factors (promotions, economic indicators), to project next month’s sales for each product. If the model foresees that Product Z will have a spike in demand, you’d get a heads-up to increase its stock. Another application is predicting lead time variability – using supplier performance data to anticipate which incoming orders might be delayed, so you can adjust by ordering earlier or holding a bit more safety stock for those items. Predictive analytics essentially helps businesses move from reactive to proactive. Instead of waiting for a stockout to happen then rushing to respond, predictive insight allows you to prevent the stockout in advance by taking action now. It’s like having an early warning system driven by data.


Importantly, you don’t need a PhD in data science to use these analytics – many modern inventory software solutions have built-in descriptive reports and predictive forecasting tools. For instance, some systems will automatically calculate an optimized reorder point and safety stock for each SKU based on the data, effectively giving you recommendations. Others might use AI to flag “at-risk” products (maybe ones that are trending down in sales or at risk of expiring) so you can take action like a promotion to move that stock.
However, a word of caution: predictive models are only as good as the data and assumptions behind them. It’s wise to validate forecasts against reality and incorporate on-the-ground knowledge. If your predictive tool doesn’t account for an upcoming marketing campaign that will double demand for a product, you’ll need to adjust that manually. The combination of human insight with data-driven predictions often yields the best results.
By understanding both what the data is telling you about yesterday and what it’s hinting about tomorrow, you can make well-rounded decisions today. Now, to see these concepts in action, let’s look at an example of an inventory management solution – CyberStockroom – and how it uses data and visualization to help businesses make better inventory decisions.
CyberStockroom: Visual Inventory Insights in Action
In the realm of inventory data analytics tools, CyberStockroom offers a unique approach by focusing on visual inventory mapping. It’s a cloud-based inventory management software that lets you map, track, and control inventory across all your locations in real time. For businesses dealing with multiple warehouses, retail stores, job sites, or even service vehicles carrying parts, CyberStockroom provides a bird’s-eye view of where every item is located and how stock levels vary by location – all on an interactive map interface.
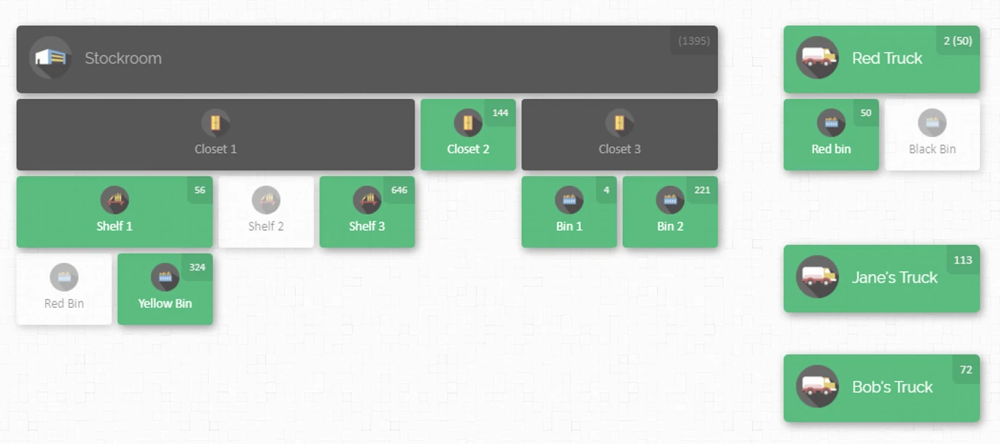
How CyberStockroom Works: At the heart of CyberStockroom is the Inventory Map. Think of this as a digital blueprint of your business’s inventory layout. You can create a map representing your actual storage hierarchy – for example, your map might have a top-level node for “Main Warehouse”, which contains sub-locations like “Aisle 1 -> Shelf A -> Bin 5” to mirror your physical setup, along with other nodes for “Service Van 12” or “Store #3” and its stockroom sections, etc. Each product in your inventory is visually placed into these locations on the map, showing exactly how many units are in each spot. This approach puts the “Where” dimension of inventory front-and-center, which many traditional systems overlook.
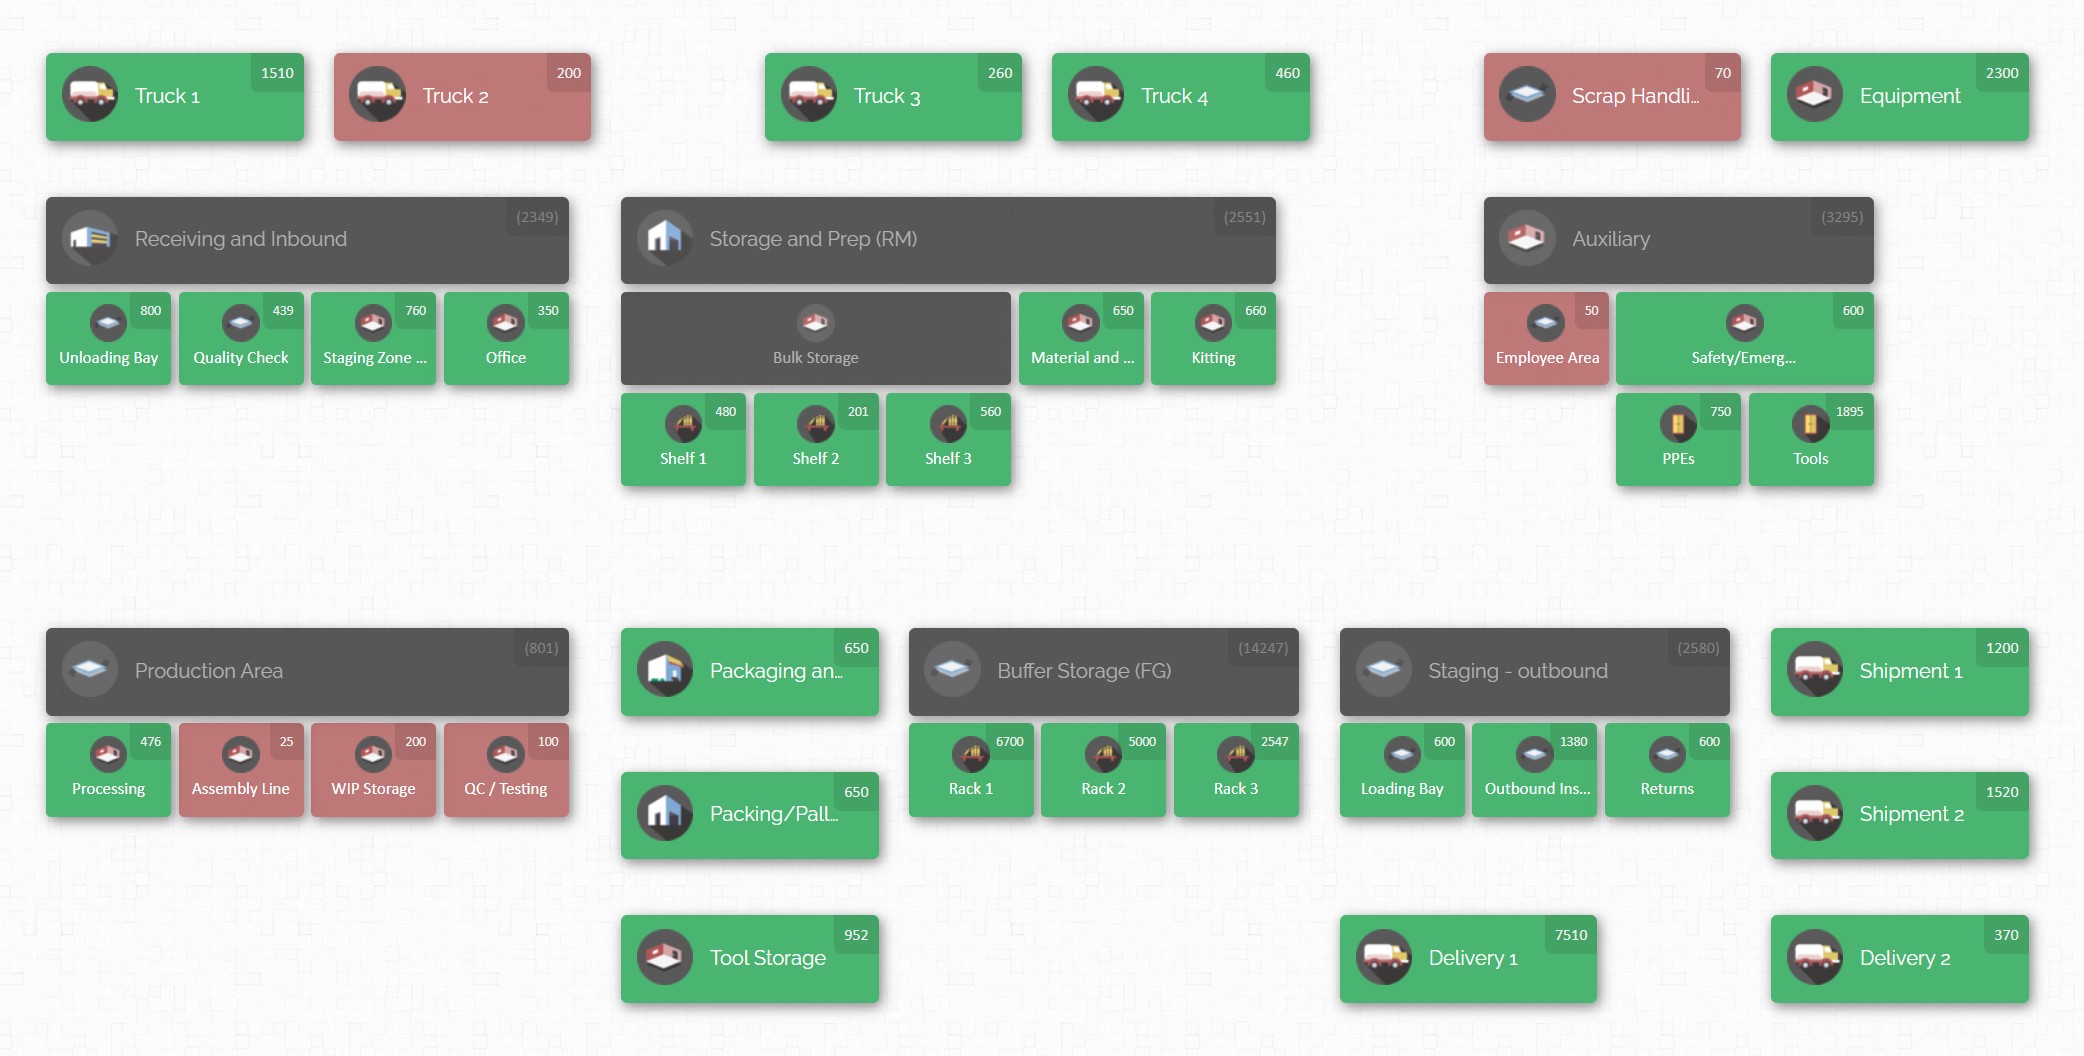
With CyberStockroom’s map dashboard, a warehouse manager can click on any location (say, Zone A – Shelf 3) and immediately see a list or icons of all products stored there, complete with quantities. If they select a specific product, the map highlights everywhere that product is located – giving what the company calls an “X-ray vision” for your products across the entire network. This makes it incredibly easy to answer the fundamental inventory question: “How many of what do we have, and where is it?” – which is often surprisingly hard to answer with spreadsheet-based inventory tracking.
Real-Time Updates and Easy Management: Because CyberStockroom is cloud-based, everyone on the team sees the same up-to-date information. When stock is moved, the changes can be reflected on the map in real time. The platform supports barcoding as well – users can scan items in or out with barcode scanners, and the system will update quantities in the mapped locations instantly. Transferring stock is as simple as dragging and dropping an item from one location on the map to another. This visual drag-and-drop for transfers is not just intuitive, it also ensures that the data is updated without manual entry errors. Regular tasks like cycle counts or audits can be performed by clicking on a location and updating counts, with the system logging who made the change and when.
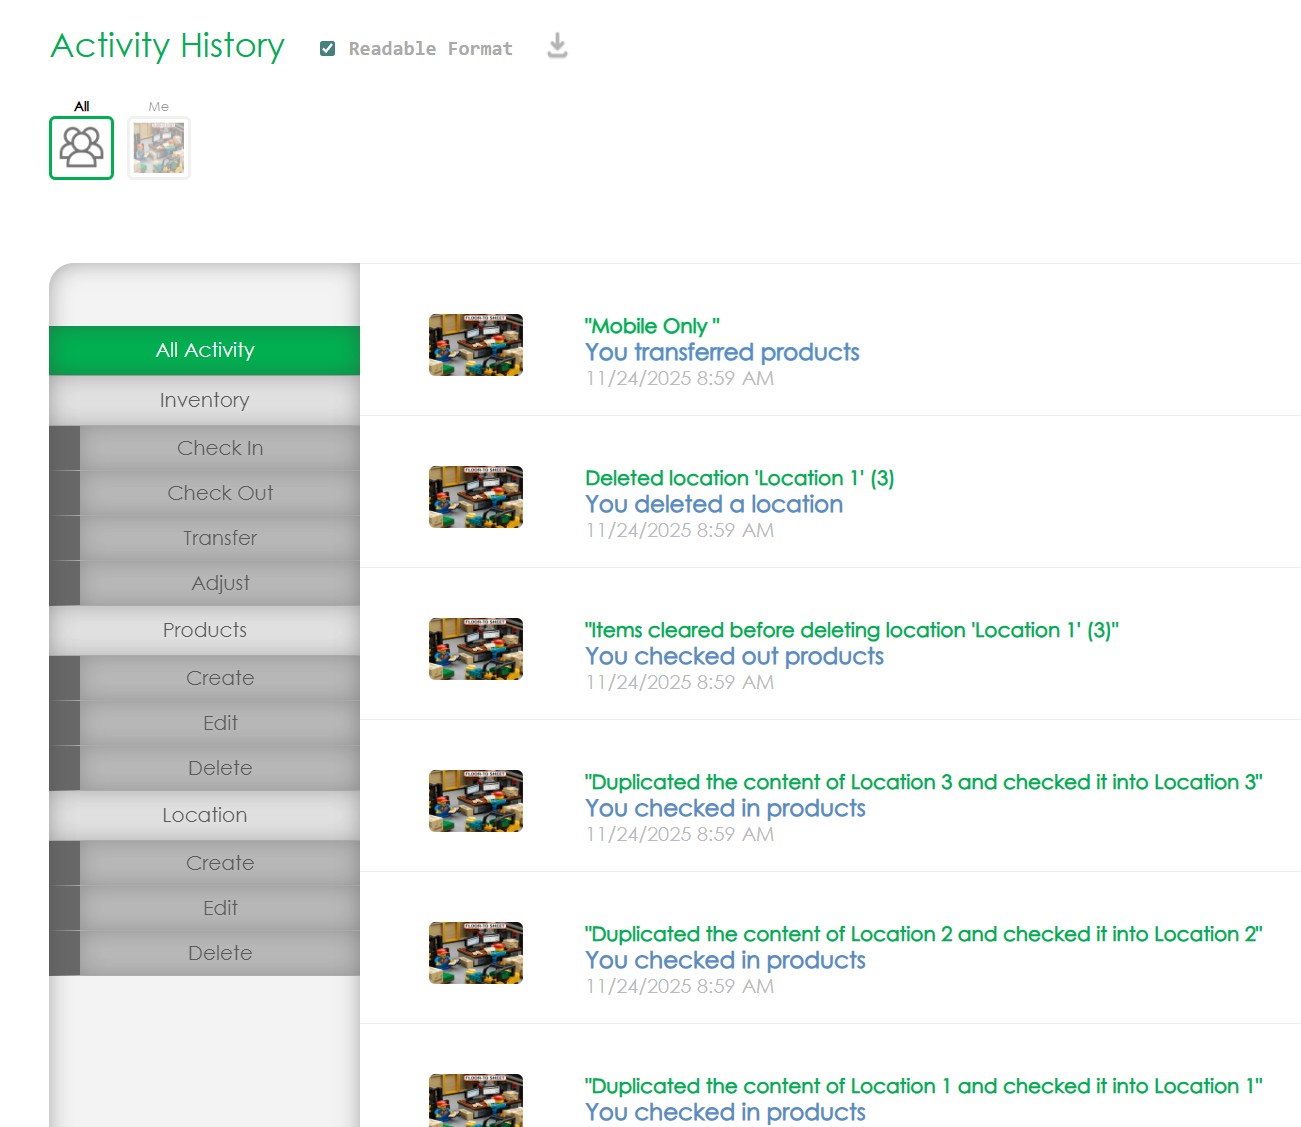
CyberStockroom also keeps a detailed activity log for traceability – every movement, addition, or removal of stock is recorded (with user, time, location, etc.), providing a full audit trail. From an analytics perspective, this history is gold: you can generate reports to see, for example, how inventory levels of a product changed over the last month, or how many transfers happened between two specific locations. In fact, the software includes customizable reporting tools that let users analyze inventory levels, movements, and even usage trends based on the map data. This means that beyond the real-time visualization, you can do traditional data analytics like identifying your top 10 locations by product turnover, or tracking how a specific item moves through your supply chain.
Insights and Better Decisions with a Visual Approach: The visual nature of CyberStockroom’s analytics can greatly aid in decision-making. For instance, imagine you’re a regional manager overseeing inventory for several stores. With a quick glance at the CyberStockroom map, you notice Store A has a surplus of Product X while Store B (in a neighboring city) is running low on the same product. This insight might prompt you to redistribute stock (move some Product X from A to B) before Store B experiences a stockout – avoiding missed sales and keeping customers happy. Traditional reports might have shown you numbers in separate columns for each store, but the map makes the contrast immediately obvious and spurs action.
Users of CyberStockroom have reported that this immediate visibility significantly improves communication and response times. For example, one technology specialist at a company noted that they “love the fact that I can see what other stores have in stock without having to call each individual… we work at a fast pace and need answers right away, and this is where [the inventory map] comes in handy.”. In practice, this means if a customer asks for an item that’s out of stock in one location, staff can instantly check the map and see which other location has it, then make an informed decision – like sourcing it from the other store or arranging a direct shipment. This level of inventory visibility across locations empowers teams to serve customers better and avoid lost sales.

From a manufacturing perspective, CyberStockroom’s map could be used to track parts and materials across the shop floor and storage areas. A production manager might use it to ensure that critical components are in the right place at the right time. If one assembly line is short on a part, the manager could quickly identify if another area has extra and transfer it, minimizing downtime. The map’s flexibility in representing any kind of “location” means even non-traditional inventory scenarios (like tools in a maintenance cart, or consigned stock at a client site) can be visualized and managed.
It’s worth noting that CyberStockroom is not about complex predictive algorithms or AI; its strength lies in providing clarity and ease of management for the here-and-now inventory data. It excels in making inventory data approachable and actionable for teams without needing a data scientist. That said, by ensuring your data is well-organized and accurate (thanks to features like barcoding and real-time updates), it lays a strong foundation for any further analytics you might do. You could, for example, export the clean data from CyberStockroom and run deeper analyses on it in another tool if needed – but many small and mid-size businesses find that the built-in maps and reports cover the majority of their needs.

In summary, CyberStockroom exemplifies how leveraging inventory data insights doesn’t always require a complicated interface – sometimes a visual map can provide immediate understanding that leads to better decisions. It bridges the gap between raw data and human intuition, allowing even non-technical users (think warehouse staff or field technicians) to engage with inventory information easily.
How to Leverage Inventory Analytics for Better Decision-Making
Implementing inventory data analytics might sound daunting, but it can be approached in an incremental, practical way. Here is a step-by-step guide for leveraging insights from your inventory data to drive better decisions:
1. Define Your Goals and Key Metrics: Start by identifying what you want to achieve with inventory analytics. Are you aiming to reduce stockouts to near zero? Cut carrying costs by 10%? Improve order fulfillment speed? Clear goals will guide which metrics you focus on. Determine the KPIs that matter most for those goals – for example, if customer service is a priority, track fill rate and stockout rate; if cost reduction is key, watch turnover and carrying cost percentage. Clear objectives ensure you’re not drowning in data but rather zeroing in on insights that support your business strategy.
2. Centralize and Clean Your Inventory Data: To get meaningful insights, your data needs to be consolidated and accurate. This means connecting the various data sources – sales, inventory records, purchase orders, etc. – into a single system or database. If you’re using an inventory management software, make that your system of record and integrate others to it (or regularly import data from them). Take time to clean the data: fix any obvious errors (negative stocks, duplicate product entries), ensure consistent units of measure, and update any stale information (like removing obsolete SKUs). Remember, analytics outcomes follow the “garbage in, garbage out” rule – high-quality data leads to high-quality insights.

3. Adopt the Right Tools: Choose tools that match your needs and technical comfort level. If you’re a smaller operation, this might be as simple as using Excel or Google Sheets with pivot tables and charts to analyze data exports. For more complex needs, consider dedicated inventory analytics or business intelligence tools that can automate a lot of the heavy lifting. Many modern inventory management systems include built-in analytics dashboards – explore those features. The right tool should allow you to easily visualize data (charts, graphs, maps) and ideally offer interactive exploration (filtering by product, location, date range, etc.). Ease of use is important – a tool that’s too complex will end up underutilized. It might be worth consulting with an inventory solutions expert or your IT team to ensure whatever software you choose can integrate with your existing systems (for real-time data flow) and can scale as you grow.
4. Visualize and Analyze: With tools in hand and data flowing, set up your dashboards and reports. Configure visualizations for your key metrics: maybe a dashboard that shows current stock levels of top products, a chart of inventory turns by month, and a map or table of open purchase orders and expected receipts. Use the analytical features to drill down: if you see a spike in inventory value last month, drill to see which items or categories drove it. Encourage your team to regularly review these dashboards – for example, warehouse supervisors can check daily for any critical low-stock alerts, while planners might review forecast vs actual sales each week. Look for patterns and outliers: Are certain products frequently in exception (overstock or understock)? Is one warehouse performing better in order fulfillment than another? These analyses will point you to the why behind the numbers, which is what you ultimately need to make decisions.
5. Turn Insights into Action: This step is crucial – insights are only as good as the actions they inspire. When your analytics highlight an issue or opportunity, formulate a concrete response. Some examples: If data shows slow-moving stock, decide on an action like running a promotion or bundling those items to clear them out (freeing up cash and space). If you identify a high stockout rate on a popular item, you might raise its reorder point and talk with your supplier about securing more stock or shorter lead times. If a certain product has an excellent GMROI, maybe you allocate more budget to keep that item well-stocked or expand its distribution to more locations. Ensure you also use positive insights, not just problem-fixing – for instance, if analytics shows that a new product is selling twice as fast as expected in one region, you might shift more inventory there to capitalize on the trend. It can be helpful to document these decisions and the data behind them; over time this builds a playbook of data-driven strategies that worked (or didn’t, which is also a learning).
6. Monitor Results and Refine: After taking action based on your data insights, close the loop by monitoring the outcomes. If you changed a stocking strategy or purchasing plan, did it yield the expected improvement? For example, after increasing safety stock for an item, did the stockout rate drop to target levels? Many analytics tools allow setting up targets or benchmarks on dashboards, so you can visually see progress (like a gauge for “stockout rate this month” against a target of, say, <2%). Continuous monitoring will show if further adjustments are needed. Inventory management is dynamic – trends change, new products come in, external factors impact demand – so make analytics a continuous process, not a one-time project. Conduct periodic reviews (monthly or quarterly) of your inventory KPIs with your team. Celebrate the improvements achieved (e.g., “Our analysis and changes reduced carrying costs by $X, and here’s how”) and pinpoint the next round of issues to tackle. This creates a culture of continuous improvement fueled by data.
7. Foster a Data-Driven Culture: Encourage team members at all levels to use data in their day-to-day decision-making. This might involve some training so everyone understands how to read the reports or use the software. When meetings are held about inventory or operations, make it standard to include relevant data – for instance, discuss a proposal to change a supplier by looking at that supplier’s delivery performance data from your analytics. Over time, as people see the success of decisions made with solid data, they become more trusting and reliant on analytics. For example, a purchasing manager might initially be skeptical of a system’s demand forecast, but after seeing it accurately predict a seasonal surge (and saving the company from a stockout), they’ll be more inclined to lean on those predictions next time. Leadership should also recognize and reward decisions that are made based on careful data analysis, reinforcing that this is the expected approach.
By following these steps, even a traditionally run warehouse or manufacturing operation can gradually transform into a data-driven inventory management environment. The process is iterative: start small with one or two metrics or a single department, demonstrate success, and then expand the scope. Perhaps you first focus analytics on your finished goods in the warehouse, then later integrate raw material inventory from the factory, and so on. Each insight and improvement builds momentum.
Conclusion
The world of inventory management is increasingly complex – customer expectations are higher, product lifecycles are shorter, and supply chain disruptions have become more common. In this challenging environment, relying on guesswork or gut feelings to make inventory decisions is a risk no business can afford. Inventory data analytics provides the necessary visibility and foresight to navigate these challenges. By harnessing the wealth of data generated in daily operations, companies can uncover hidden patterns, anticipate problems, and make informed decisions that align inventory levels with business goals.
For warehouse managers, this might mean using analytics to optimize space and streamline picking routes, resulting in faster fulfillment and lower labor costs. For manufacturers, it could mean better syncing of inventory with production schedules – ensuring materials are available just in time and avoiding both line stoppages and excess stock sitting in storerooms. In both cases, the decisions (what to stock, when to reorder, where to allocate) are improved by insights such as “this item will stock out in 5 days unless we replenish” or “that material is overstocked relative to usage, let’s reduce our purchase frequency.”
Tools like CyberStockroom demonstrate that making sense of inventory data doesn’t have to be intimidating. A clear, visual presentation of inventory information can empower teams to quickly grasp situations and act decisively. The combination of human experience with data-driven insight is powerful – managers can apply their practical know-how guided by solid evidence from the analytics. Over time, these smarter decisions compound into significant gains: lower costs, higher efficiency, happier customers, and a more agile supply chain.
In summary, leveraging inventory data analytics is about turning information into impact. It’s the difference between flying blind versus having a dashboard and radar. Companies that invest in understanding their inventory through data will find themselves better equipped to handle day-to-day operations and unexpected changes alike. They can course-correct faster, seize opportunities (like a spike in demand) promptly, and avoid the pitfalls of stockouts or overstocks that have long plagued traditional inventory management. In a data-driven future, inventory analytics isn’t just an add-on feature – it’s central to staying competitive and delighting customers with reliability and efficiency.


Leave a comment