
Inventory management is the backbone of every construction project. From keeping job sites stocked with materials to maintaining a fleet of equipment, the ability to know how many of what you have where directly influences productivity, schedule adherence and profitability.
In construction, inventory isn’t just bolts and rebar; it includes everything from concrete batches, fuel and tools to portable equipment and spare parts. Each component must be tracked, replenished and accounted for. When materials don’t arrive on time, crews sit idle; when equipment sits unused, capital is tied up. Inventory key performance indicators (KPIs) give project managers, site supervisors and inventory specialists the data needed to make better decisions and keep operations running smoothly.
Implementing a robust KPI framework requires clarity about what to measure, why it matters and how to interpret the results. This guide explores the most useful inventory KPIs for construction projects and explains how to apply them in real‑world scenarios.
Understanding the challenges of construction inventory
Construction projects face unique inventory challenges that make the tracking of materials and equipment more complicated than in many other industries. Sites are dynamic environments – weather delays, design changes, subcontractor schedules and supply chain disruptions constantly shift material needs. Materials and tools often move between temporary storage areas, laydown yards, vehicles and multiple job sites. Without proper visibility, materials can be over‑ordered, under‑utilized or misplaced, leading to costly delays and safety risks.
Another challenge is variability. Demand for materials fluctuates based on project phase. Early in a project, large quantities of structural materials are needed; later phases require specialized finishing supplies.

Equipment utilization also varies; excavators may be in constant use at one site while sitting idle at another. Theft and damage are additional concerns, particularly for high‑value items stored outdoors. With so many variables, construction companies need a disciplined approach to track stock levels, understand usage patterns and respond quickly to changes.
This is where inventory KPIs come into play. By setting targets and monitoring performance in areas such as stock turnover, shrinkage and lead time, project teams can identify problems early and implement corrective actions. The goal is not to create dashboards for the sake of data alone but to drive decisions that improve efficiency, reduce waste and support timely project completion.
Choosing the right KPIs for construction inventory

Before diving into a list of specific KPIs, it’s important to understand how to select the right metrics for your situation. Several best‑practice guidelines emerge from industry research. KPIs should follow the SMART framework – they must be specific, measurable, achievable, relevant and timely. When selecting KPIs for construction projects, consider the following principles:
- Relevance to project goals: Choose KPIs that support the strategic objectives of your project – reducing material waste, maintaining on‑time delivery, lowering carrying costs or improving safety. Metrics that don’t directly influence outcomes can become noise.
- Clarity and measurability: Each KPI should have a clear definition and formula. Ambiguous or subjective metrics lead to inconsistent measurement and confusion.
- Regular cadence: Set a cadence for reviewing KPIs – daily for fast‑moving items, weekly for standard materials and monthly for capital equipment. Timely measurement ensures that issues are caught early.
- Accessible data: Use systems that can capture and report data automatically. Manual tracking increases the risk of errors and delays. A centralized inventory system or ERP helps consolidate information from multiple sites.
- Balanced focus: Include metrics that measure efficiency (e.g., inventory turnover), reliability (e.g., perfect order rate), cost control (e.g., carrying cost) and risk (e.g., shrinkage). A balanced dashboard provides a comprehensive view of performance.
With these principles in mind, let’s explore the inventory KPIs that matter most to construction projects.
Fundamental inventory KPIs for construction
| KPI | Formula |
|---|---|
| 1. Asset Turnover | Asset Turnover = Revenue / Average Total Assets |
| 2. Labor Utilization (Inventory Utilization) | Labor Utilization = Actual Direct Labor Hours / Available Labor Hours |
| 3. Return on Assets (ROA) | ROA = Net Profit / Average Total Assets |
| 4. Washout Percentage | Washout % = (Tool Rental Revenue / Tool Maintenance Expenses) × 100 |
| 5. Fleet Age | Fleet Age = Sum of Ages of All Equipment / Number of Equipment Units |
| 6. Order Lead Time (Order Cycle Time) | Lead Time=Order Processing Time+Production Lead Time+Delivery Lead Time |
| 7. Inventory Turnover Rate | Inventory Turnover = Cost of Goods Sold / Average Inventory |
| 8. Days on Hand (Days Sales of Inventory) | Days on Hand = (Average Inventory / Cost of Sales) × 365 |
| 9. Stock-to-Sales Ratio | Stock-to-Sales Ratio = Inventory Value / Sales Value |
| 10. Sell-Through Rate | Sell-Through Rate = (Units Sold / Units Received) × 100 |
| 11. Backorder Rate | Backorder Rate = (Number of Delayed Orders / Total Number of Orders) × 100 |
| 12. Demand Forecast Accuracy | Forecast Accuracy = 1 − ( |Forecasted Demand − Actual Demand| / Actual Demand ) |
| 13. Lost Sales Ratio | Lost Sales Ratio = (Number of Days Product is Out of Stock / 365) × 100 |
| 14. Perfect Order Rate | Perfect Order Rate = (Number of Error-Free Orders / Total Number of Orders) × 100 |
| 15. Inventory Shrinkage | Inventory Shrinkage = (Recorded Inventory − Physical Inventory) / Recorded Inventory × 100 |
| 16. Inventory Carrying Cost | Inventory Carrying Cost = (Total Carrying Costs / Average Inventory Value) × 100 |
| 17. Fill Rate | Fill Rate = (Orders Fulfilled Completely ÷ Total Orders) × 100 |
| 18. Order Cycle Time | Order Cycle Time = (Delivery Time − Order Placement Time) / Number of Orders |
| 19. Stock-Out Rate | Stock-Out Rate = (Number of Stock-Outs ÷ Total Orders) × 100 |
| 20. Service Level | Service Level = (Orders Delivered On Time ÷ Total Orders) × 100 |
| 21. Lead Time (Detailed) | Lead Time = Processing Time + Production Time + Delivery Time |
| 22. Dead Stock and Spoilage | Dead Stock % = (Unsellable or Expired Inventory ÷ Total Inventory) × 100 |
| 23. Available Inventory Accuracy | Accuracy % = (System Inventory − Count Variance) ÷ System Inventory × 100 |
| 24. Safety Stock | Safety Stock = (Maximum Daily Usage × Maximum Lead Time) − (Average Daily Usage × Average Lead Time) |
| 25. Inventory Holding Cost | Holding Cost = (Storage Cost + Salary + Opportunity Cost + Depreciation) / Annual Inventory Value × 100 |
| 26. Inventory Accuracy and Auditing | Accuracy % = (Correctly Recorded Items ÷ Total Items Checked) × 100 |
| 27. Safety Incident Rate (TRIR) | TRIR = (Number of Recordable Incidents × 200,000) / Total Hours Worked |
| 28. Defect Rate | Defect Rate = (Defective Items ÷ Total Items Inspected) × 100 |
| 29. Labor Productivity | Labor Productivity = Output (Units or $) ÷ Labor Hours |
| 30. Change Order Rate | Change Order Rate = (Number of Change Orders / Total Number of Orders) × 100 |
| 31. Project Completion % and Schedule Variance | Completion % = (Earned Value ÷ Planned Value) × 100 Schedule Variance = Earned Value − Planned Value |
| 32. Profit Margin | Profit Margin = (Revenue − Total Costs) / Revenue × 100 |
Best practices for tracking inventory KPIs

Simply defining KPIs is not enough; you need robust processes to gather data, analyze results and act on insights. Inventory tracking systems and sound procedures ensure that your KPIs reflect reality. Several best practices emerge from industry sources:
- Centralized digital system: A centralized digital inventory management system provides a single source of truth. Relying on spreadsheets or disconnected tools often leads to data gaps and inconsistencies. A cloud-based platform ensures that teams across multiple sites can access the same real-time information and make aligned decisions.
- Real‑time visibility and forecasting: Immediate visibility into stock levels supports proactive decision-making. Real-time data reduces the risk of overstocking or understocking and strengthens communication across teams. When paired with forecasting tools, inventory data can be used to adjust orders based on actual consumption patterns and upcoming project milestones.
- Supplier collaboration: Bringing suppliers into the inventory management process helps build stronger relationships and shortens lead times. Sharing project schedules and expected consumption patterns gives suppliers the insight they need to plan production and deliveries more effectively.
- Standardized tracking procedures: Establishing standardized processes ensures consistency across all sites. This includes categorizing products, mapping storage locations, updating records as soon as stock arrives, tracking internal transfers, performing quality control checks, and scheduling regular cycle counts. Standardization minimizes errors and ensures reliable data capture.
- Built‑in analytics and integration: An inventory system with built-in analytics and integration capabilities simplifies KPI tracking and reporting. Integration eliminates duplicate data entry, improves accuracy, and creates a smoother workflow between systems.
- Cycle counting and variance analysis: Routine cycle counts combined with variance analysis help sustain accurate inventory records. Any discrepancies should be investigated to uncover causes such as unrecorded transfers, shrinkage, or miscounts. Corrective actions can then be built into processes to prevent recurrence.
- Safety and quality controls: Incorporating safety metrics such as TRIR and quality metrics such as defect rate into inventory dashboards improves accountability. Safe handling, proper storage, and quality checks reduce the risk of damage, shrinkage, and safety incidents.
- Continuous improvement: KPI trends provide direction for improvement efforts. For example, a consistently high stock-to-sales ratio may indicate the need to order smaller quantities more frequently to cut carrying costs. If lead times remain long, solutions might include renegotiating terms with suppliers or diversifying the supplier base.
Leveraging CyberStockroom for construction inventory
CyberStockroom’s inventory management platform offers a visual and intuitive approach to tracking construction materials and equipment. Here’s how it aligns with the KPIs and best practices discussed above:
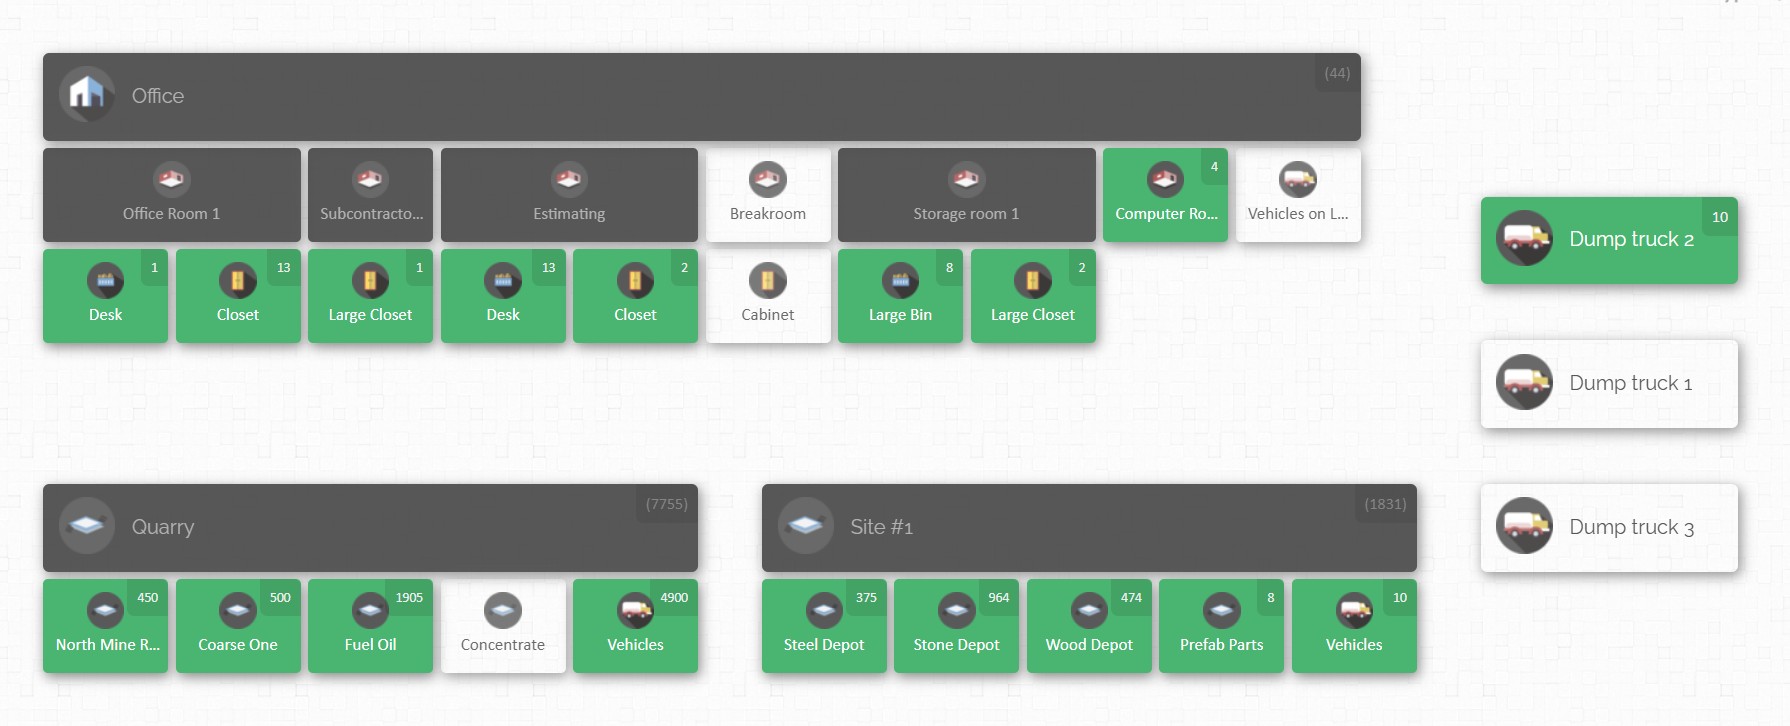
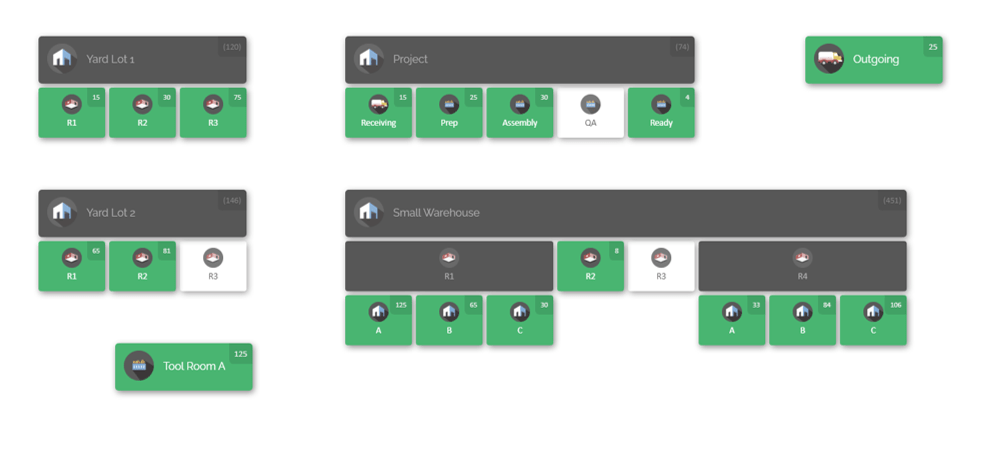
- Visual mapping of locations: The platform’s signature feature is the customizable inventory map. Users can create a map that mirrors the layout of their warehouse, laydown yard or job site, labeling rooms, shelves, bins and vehicles as locations. This visual representation answers the fundamental question of “how many of what do you have where?” and enables quick navigation.
- Real‑time updates: Items can be dragged and dropped between locations on the map, with each move recorded in real‑time. When workers check materials out of the warehouse for a specific job, the map updates instantly. This supports KPIs like inventory turnover, stock‑out rate and order cycle time by providing accurate, up‑to‑date information about stock levels.
- Customizable catalog and categories: Before adding items to the map, users create products in a catalog with descriptions, quantities and categories. This structured approach facilitates standardized tracking and reporting.
- Barcoding support: CyberStockroom supports barcoding, allowing teams to scan items during receiving, transfers and issuance. This reduces manual entry errors and improves inventory accuracy. For construction projects with high volumes of small items, barcoding accelerates cycle counts and improves accountability.
- Cloud accessibility: Because the platform is cloud based, you can access the inventory map and data from any internet‑enabled device. This ensures that project managers and site supervisors can check inventory status while on site.
- Reporting and analytics: CyberStockroom allows users to generate customizable reports based on inventory data. You can analyze inventory levels, track product movements, monitor stock counts and evaluate warehouse performance.
- Unlimited locations and products: There is no limit to the number of locations or products you can add, making the system scalable for companies managing multiple projects or warehouses.
- Security and access control: Data is stored on Amazon AWS with robust security measures. You can also share the map with team members and set specific permissions, ensuring that only authorized personnel can edit or view sensitive data.
When implementing CyberStockroom on construction projects, start by mapping out all physical locations, from onsite trailers and laydown yards to storage containers and tool cribs. Then categorize your materials and equipment, assign them to locations and establish barcoding procedures. Train field teams on how to check items in and out using the map. Finally, set up reports and dashboards to monitor your chosen KPIs regularly.

Implementation tips for construction managers
Tracking inventory KPIs and leveraging tools requires a coordinated effort across teams. Here are practical steps to help construction managers, site supervisors and inventory specialists get started:
- Define your objectives: Identify the pain points you want to address with inventory KPIs. Are you trying to reduce stock‑outs, prevent theft, optimize equipment utilization or improve cash flow? Clear objectives drive the selection of metrics.
- Map your processes: Document how materials and equipment move through your organization. Outline the path from procurement to delivery to job site and back. Understanding these flows helps you choose appropriate KPIs and set up the inventory map accordingly.
- Assign ownership: Designate individuals responsible for capturing data, maintaining records and reviewing KPIs. Accountability ensures that metrics are recorded consistently and that corrective actions are taken when performance slips.
- Start with a pilot project: Before rolling out across all projects, test your KPI framework and inventory system on a single job site. This allows you to refine categories, adjust reorder points and train users in a controlled environment.
- Train your team: Provide training on the chosen system and inventory processes. Ensure that everyone, from procurement officers to site supervisors, understands how to record stock movements, scan barcodes and interpret reports.
- Integrate with procurement and finance: Link inventory data to procurement schedules and financial systems. Aligning purchase orders with lead times and project timelines improves forecast accuracy and cash flow management.
- Set up alerts and thresholds: Use your inventory system to set minimum stock levels and automatic reorder alerts. This helps prevent stock‑outs and ensures that materials are ordered in time to meet demand.
- Review and adjust: Regularly review KPI dashboards with your team. Celebrate successes when KPIs improve and investigate when they decline. Continuous improvement should be part of your culture.

Conclusion
Construction projects are complex operations where materials, equipment, labor and time must be orchestrated perfectly. Inventory KPIs act as a compass, guiding project managers and site supervisors through the daily decisions that determine whether projects finish on time and within budget. By measuring metrics such as asset turnover, lead time, shrinkage, carrying cost and safety incident rate, you gain visibility into how well your inventory is performing and where improvements are needed.
Choosing the right KPIs requires alignment with project goals, clear definitions and a realistic view of what you can measure. Tools like CyberStockroom provide the technological foundation to capture accurate data, visualize locations, automate processes and generate actionable reports. With its customizable map, barcoding support, cloud accessibility and reporting capabilities, CyberStockroom helps construction teams track materials and equipment in real‑time, reduce waste and improve profitability.
Ultimately, the goal of tracking inventory KPIs is not to create more paperwork but to enable smarter decisions. When project teams have reliable information at their fingertips, they can order the right materials at the right time, utilize equipment efficiently, avoid costly delays and deliver better outcomes for clients. Implementing the KPIs and practices discussed in this guide will help you transform inventory management from a source of frustration into a strategic advantage.


Leave a comment