
Managing a warehouse efficiently means keeping a close eye on the right metrics. In today’s fast-paced supply chain, inventory KPIs for warehouse managers serve as vital signposts for operational health.
By tracking key performance indicators (KPIs) related to inventory, warehouse and operations managers can pinpoint inefficiencies, reduce costs, and ensure customer demands are met promptly.
Essential Inventory KPIs to Track and Optimize
Inventory KPIs are quantifiable metrics that gauge how well you manage stock levels, turnover, accuracy, and availability. Focusing on these metrics allows you to make data-driven decisions to streamline warehouse operations. Let’s dive into the top inventory KPIs every warehouse manager should monitor:
1. Inventory Turnover Ratio
Inventory turnover ratio measures how many times your inventory is sold and replaced in a given period (usually a year). It’s calculated by dividing the Cost of Goods Sold (COGS) by the average inventory value for that period. For example, an inventory turnover of 4 means you cycle through your stock four times a year.

Why It Matters: This KPI indicates how efficiently you’re managing stock. A higher turnover suggests brisk sales and lean inventory (good for reducing holding costs), whereas a low turnover implies overstocking or slow-moving products tying up capital. Businesses strive for a healthy turnover that balances supply with demand – often an optimal range is around 2 to 4 for many industries, though this can vary by sector. If turnover is too low, you risk obsolescence and high carrying costs; if it’s extremely high, you might be running too lean and risking stockouts.
Optimization Tips:
- Forecast and Plan: Use sales data and demand forecasting to stock the right amount of each product. Avoid over-ordering items that have historically low sales.
- Product Mix Management: Identify slow-moving stock (perhaps through an ABC analysis) and consider markdowns or promotions to clear excess inventory. For fast movers, ensure reorder points are set so you replenish in time.
- Lean Inventory Practices: Implement Just-in-Time or other lean strategies where feasible to keep inventory levels as low as possible without hurting service. Regularly review your product portfolio and phase out items that don’t sell.
- Use Software Tools: An inventory management system or WMS can automatically track turnover and highlight items with unusually low or high turnover rates, prompting action.
By keeping inventory turnover at an optimal level, you’ll free up cash, reduce storage needs, and improve overall warehouse efficiency.
2. Days of Inventory on Hand (DSI)
Days of Sales Inventory (DSI) – also called Days of Inventory on Hand – measures the average number of days it takes for your current inventory to be sold. It’s essentially the inverse of inventory turnover expressed in days. A simple formula is:
DSI = (Average Inventory / Cost of Goods Sold) × 365 days
For instance, if you have a DSI of 60, it means at the present sales rate, your inventory would last roughly 60 days before running out (assuming no new stock is added).

Why It Matters: DSI is a direct indicator of inventory liquidity and turnover speed. A lower DSI means inventory is moving quickly (good for cash flow and freshness of stock), while a higher DSI indicates stock sits longer in the warehouse. Lowering DSI can have a positive impact on cash flow – the faster you convert inventory into sales, the sooner you recoup cash invested in stock. However, extremely low DSI could signal that you are keeping too little inventory (risking frequent stockouts). It’s important to compare DSI against industry benchmarks or your own historical trends. This provides context: a DSI of 30 days might be great in one industry but concerning in another.
Optimization Tips:
- Balance Stock Levels: Analyze DSI alongside turnover to ensure you aren’t holding inventory for too long. If DSI is climbing, it may be time to slow purchases or run promotions to increase sales velocity.
- Monitor Product Life Cycle: New products or seasonal items might have varying DSI. Plan for seasonality by adjusting stock before demand drops off, to avoid leftover inventory that inflates your DSI.
- Improve Forecast Accuracy: The more accurate your demand forecasts, the better you can optimize how many days of stock to keep. This prevents significantly overstocking (which raises DSI) or understocking.
- Use “Weeks on Hand” for granularity: Some managers prefer weeks on hand as a similar metric. Regularly calculate how many weeks of supply you have for each SKU based on forecasts, and adjust purchasing to keep this within a target range.
In short, tracking DSI helps ensure you maintain lean inventory without jeopardizing your ability to meet orders. It’s a fine balance between too much and too little stock, directly tied to both efficiency and risk management.
3. Carrying Cost of Inventory
The carrying cost of inventory (also known as holding cost) represents the total expenses of storing and holding inventory over a period. This typically includes warehousing costs (rent, utilities, handling), insurance, taxes on inventory, and inventory risk costs like shrinkage, damage, obsolescence, and depreciation. It’s often expressed as a percentage of the inventory’s value per year.
For example, if your annual carrying cost is 25% of inventory value, holding an average of $100,000 in stock would cost you about $25,000 in a year.

Why It Matters: Carrying cost is essentially the “silent price” of keeping inventory. A high carrying cost can erode profits significantly – it tells you how long you can store products before the holding expenses outweigh the benefit of keeping that stock. Monitoring this KPI encourages efficient stock levels: if you can reduce average inventory or improve turnover, you directly cut down carrying costs. This KPI is also crucial for identifying when slow-moving inventory becomes very costly to keep. For instance, products that aren’t selling not only tie up capital but also rack up storage, insurance, and risk of obsolescence. Many businesses find that carrying costs range from 20% to 30% of inventory value annually, so trimming excess stock yields substantial savings.
Optimization Tips:
- Reduce Excess Inventory: Regularly review inventory reports and identify surplus or dead stock. Implement strategies to either liquidate these items (discount sales, bundles) or prevent over-ordering them in the first place.
- Optimize Warehouse Space: Improve your warehouse layout and storage strategies. Efficient slotting, vertical storage, or consolidation can reduce space requirements. Less space used can mean lower rent or the ability to store more product in the same footprint.
- Improve Turnover: As discussed, a better inventory turnover directly lowers carrying costs. Focus on demand planning and just-in-time replenishment for faster-moving stock cycles.
- Categorize Costs: Break down your carrying costs into components (storage, service, risk, capital). This can reveal specific areas to target – for example, if insurance or damage costs are high, investing in better security or handling procedures can reduce shrinkage-related carrying cost.
- Set Targets: You may set an internal target like “keep carrying cost under X% of total inventory value.” Tracking this over time will show if initiatives to slim down inventory are working.
By keeping carrying costs in check, you’re effectively freeing up capital and increasing the profitability of your warehouse operations. It forces a strategic approach: every pallet on the shelf has a ticking cost associated, so make sure each item earns its keep or it might be time to take action.
4. Inventory-to-Sales Ratio (Stock-to-Sales)
The inventory-to-sales ratio compares the stock you have on hand to the sales you’re generating. Typically measured monthly, it’s calculated as:
Inventory-to-Sales Ratio = (Inventory Value at End of Month) / (Sales during that Month)
For example, if you ended the month with $150,000 in inventory and had $100,000 in sales that month, your inventory-to-sales ratio is 1.5. This means you have one and a half times the month’s sales sitting in inventory.

Why It Matters: This KPI highlights the balance between supply and demand. A higher ratio could mean you’re holding too much stock for the level of sales (potential overstocking and future cash flow issues), whereas a low ratio might indicate strong sales relative to inventory or possibly understocking. Monitoring this ratio over time can reveal trends. If inventory is rising while sales stagnate or fall, the ratio will increase – a warning sign of potential cash flow problems or over-purchasing. Conversely, if sales spike and inventory doesn’t keep up (ratio drops), you might be headed for stock shortages. Warehouse managers use this metric for forecasting and planning: it helps in predicting when to scale back purchasing or ramp it up. A well-optimized inventory-to-sales ratio reflects a streamlined fulfillment process and healthy turnover.
Optimization Tips:
- Benchmark and Monitor Trends: Compare your ratio against industry averages and track it monthly. A sudden change in the ratio signals a need to investigate (e.g., why did inventory jump relative to sales this month?).
- Align with Cash Flow Goals: Work with finance teams to determine an ideal ratio range that supports liquidity. If the ratio is consistently high, it means money tied in stock that could be used elsewhere.
- Adjust Purchasing Strategy: A high inventory-to-sales ratio might mean you’re buying too much too early. Consider tighter reorder points and smaller, more frequent orders to keep stock closer in line with sales rate.
- Leverage the Ratio for Demand Surges: When you know a sales spike is coming (seasonal peaks or promotions), you may purposefully allow the ratio to drop temporarily as sales outpace inventory – this indicates you’re squeezing more efficiency by selling stock faster. Just be cautious to avoid stockouts.
- Combine with Other KPIs: Use inventory-to-sales alongside turnover and DSI for a full picture. For instance, an increasing inventory-to-sales ratio with declining turnover and rising DSI clearly shows an overstock problem brewing on all fronts.
In summary, the inventory-to-sales ratio is a valuable “big picture” metric. It keeps you aware of whether your inventory levels are in sync with sales performance, enabling proactive adjustments. Businesses that master this balance can minimize excess stock while still meeting customer demand, boosting both profitability and responsiveness.
5. Gross Margin Return on Inventory (GMROI)
Gross Margin Return on Inventory Investment (GMROI) is a financial inventory metric that measures how much gross profit you earn for each dollar of inventory you stock. In formula terms:
GMROI = Gross Profit / Average Inventory Cost
Gross profit is revenue minus the cost of goods sold. For example, a GMROI of 2.0 means you’re earning $2 in gross margin for every $1 invested in inventory. Sometimes GMROI is also expressed as a percentage or as an annual rate.

Why It Matters: While many inventory KPIs focus on operational efficiency, GMROI focuses on inventory profitability. It answers the question: Is our investment in inventory yielding good returns? A higher GMROI means your inventory is more profitable – you’re selling higher-margin products or you’re turning inventory quickly (or both). A low GMROI might indicate that either margins are thin or inventory is sitting too long, or a combination of the two. Warehouse and inventory managers, in collaboration with purchasing and merchandising teams, use GMROI to identify which product lines or categories are most financially productive. For instance, one category might have slower turnover but very high margins, while another has fast turnover but low margins – GMROI helps normalize performance across different dynamics. Ultimately, improving GMROI contributes to better cash flow and ROI for the business’s inventory investment.
Optimization Tips:
- Increase Margins: Explore ways to improve the gross profit of your products. This could mean negotiating better supplier prices, optimizing your product mix to focus on higher-margin items, or implementing strategic pricing. Even small margin improvements raise GMROI.
- Boost Turnover (without sacrificing margin): Many strategies that increase inventory turnover will improve GMROI as well, but be careful – slashing prices to clear stock might boost turnover at the expense of margin. Aim for balanced tactics: for example, marketing efforts that increase demand at regular prices will move products faster while preserving profit per unit.
- Category Analysis: Break down GMROI by product category or SKU. This helps identify underperformers. You might discover, for example, that Product Line A has a GMROI of 3.5 (very healthy) while Product Line B is only 0.8 (losing money on inventory). With this insight, you can make decisions to discontinue, promote, or re-engineer certain lines.
- Inventory Right-Sizing: If certain items have low GMROI because of excess stock, consider reducing order quantities or implementing just-in-time supply for those. Less inventory for the same gross profit will lift GMROI.
- Remove Dead Stock: Inventory that doesn’t sell and generates no gross profit drags down your GMROI. Regularly purge truly dead stock (even at a steep discount – getting some return is better than none) to prevent it from inflating your average inventory without contributing to profits.
GMROI provides a strategic view of inventory performance, marrying the finance and operations perspectives. By working to improve GMROI, warehouse managers ensure that inventory not only moves efficiently, but also earns its keep in terms of profitability. It’s a key metric for optimizing the financial efficiency of your warehouse’s inventory management.
How CyberStockroom Helps Optimize Inventory KPIs
Modern inventory management software can be a game-changer in tracking and improving all the KPIs mentioned so far. CyberStockroom, in particular, offers a unique visual approach to inventory management that aligns perfectly with the needs of warehouse managers focused on efficiency and accuracy. Let’s discuss how CyberStockroom’s features correlate with better performance on key inventory metrics:
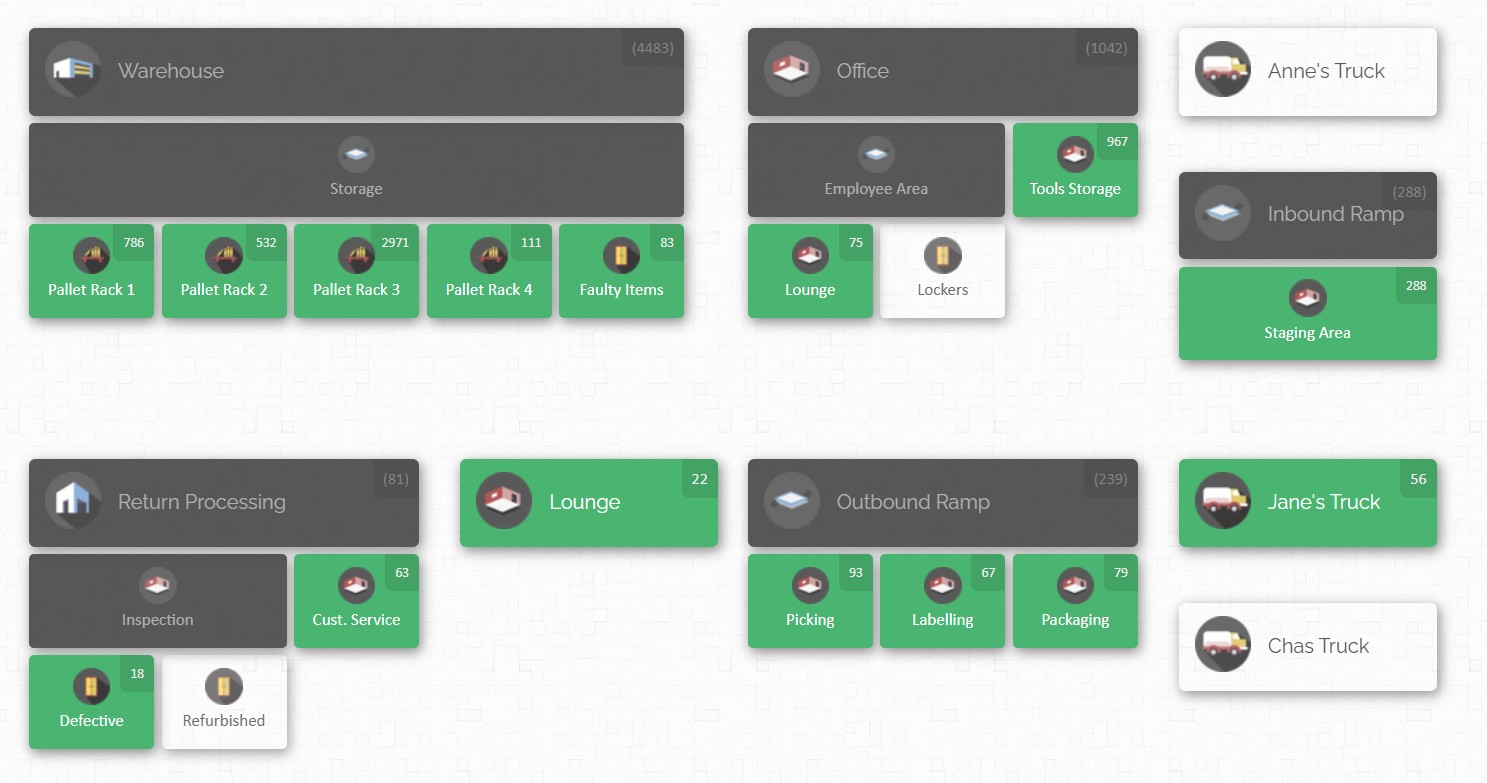
Visual Inventory Map for Enhanced Visibility
CyberStockroom provides a map-based dashboard of your warehouse or storage locations, allowing you to see your entire inventory at a glance.
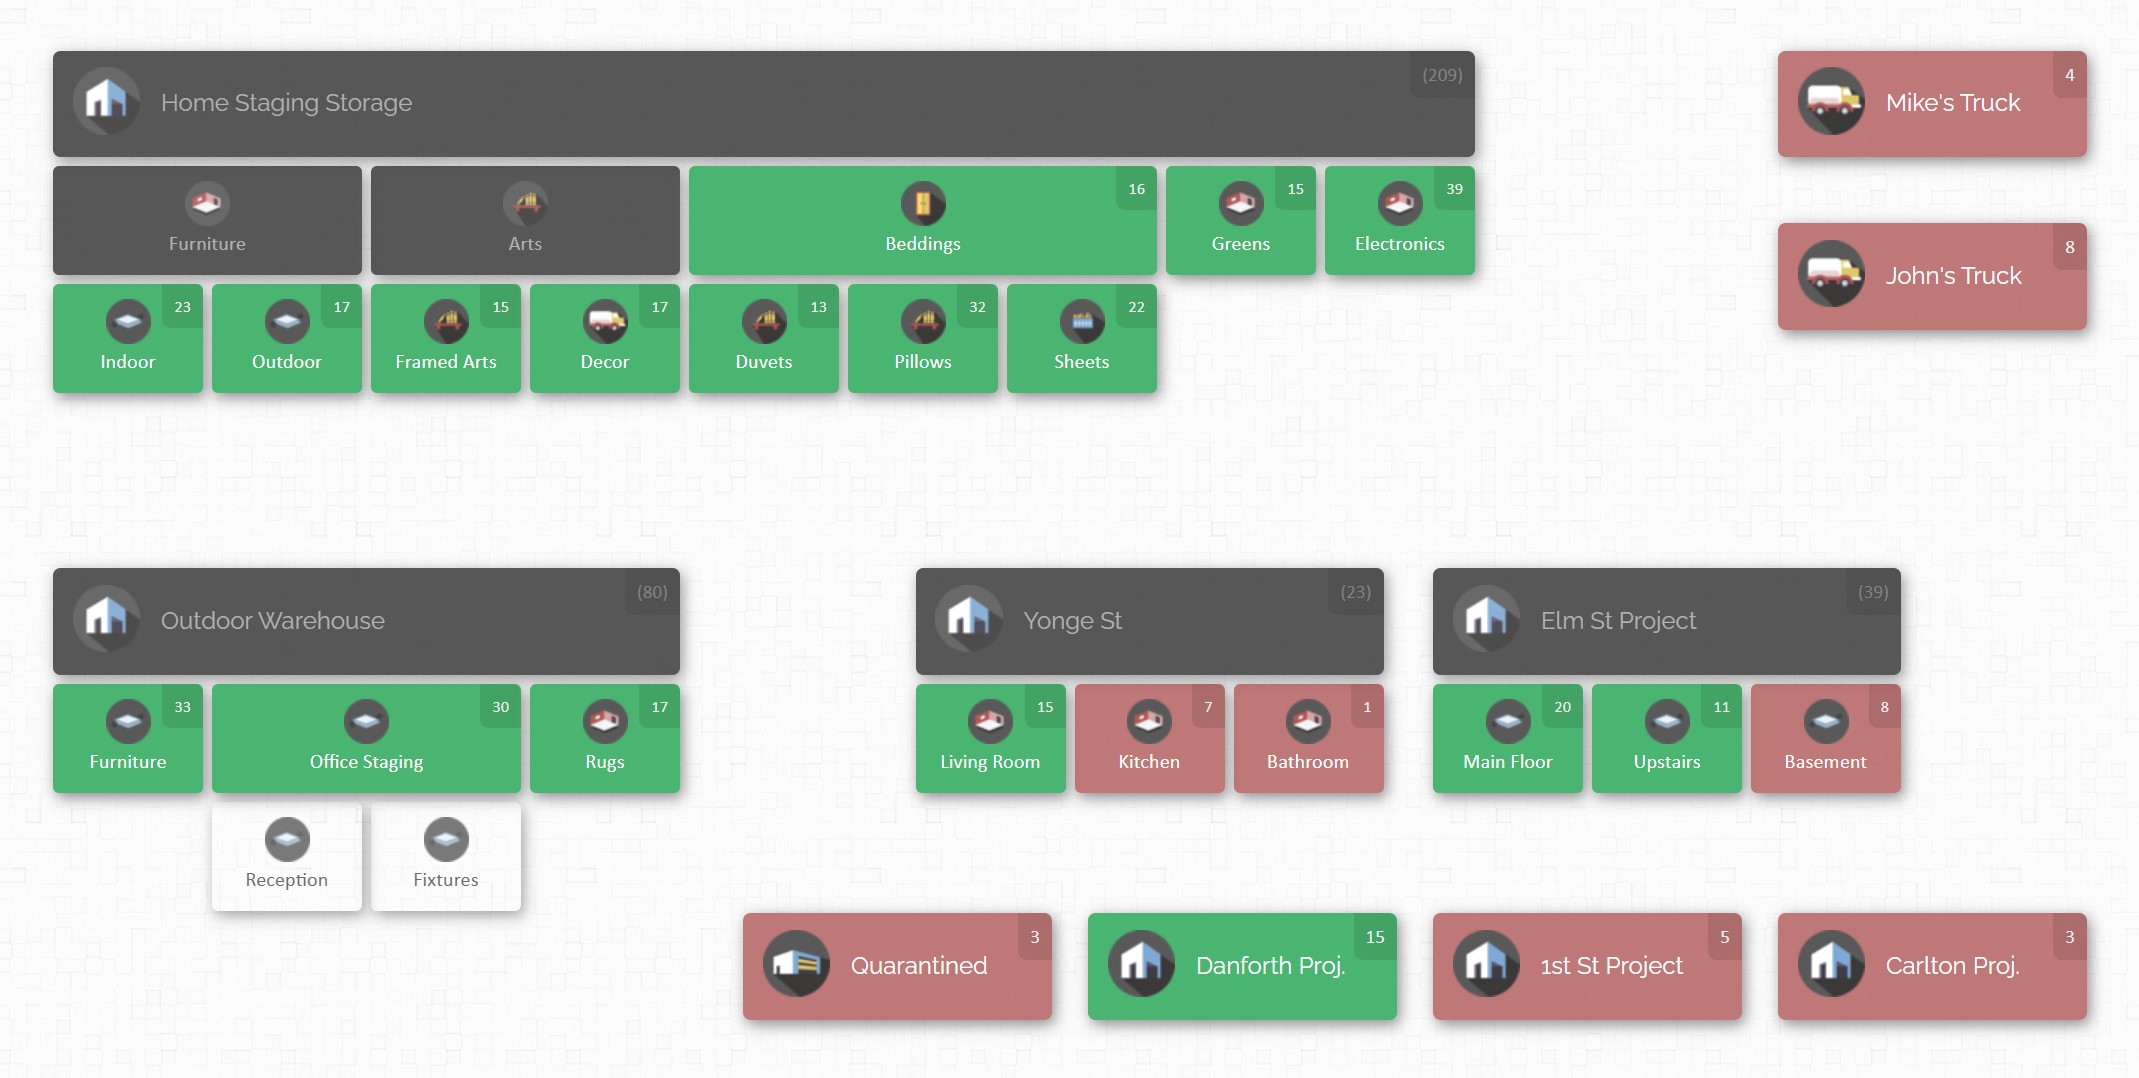
This visual representation helps in quickly identifying where every product is and how much is available in each location. For a warehouse manager, this means no more losing time combing through spreadsheets or physically searching aisles for stock – the information is readily accessible on-screen. Enhanced visibility can improve Inventory Accuracy and Order Fill Rates because you’re less likely to overlook items or misplace stock. If, for example, one location is running low on a product, the map makes it obvious so you can replenish or reallocate stock proactively before a stockout occurs.
Real-Time Updates and Centralized Data
As a cloud-based system, CyberStockroom updates inventory data in real time and is accessible from any device (computer, tablet, smartphone) with internet access. This means the moment a product is received, moved, or sold, your records reflect it. Real-time data is crucial for KPIs like Inventory Turnover and DSI – you can trust that the calculations are based on the latest information. It also supports lower Carrying Costs and better Inventory-to-Sales ratio, because managers can respond immediately to changes (like halting incoming orders for an overstocked item or expediting restock for a hot seller). The cloud accessibility ensures that even if you’re on the warehouse floor or off-site, you can monitor inventory levels and KPIs on the go, maintaining control at all times.
Drag-and-Drop Transfers and Easy Adjustments
CyberStockroom’s interface includes intuitive drag-and-drop functionality to move inventory between locations on the map. Say you notice through the system that Warehouse Zone A has a surplus of item X while Zone B is about to run out – you can easily update a transfer in the system, and physically move the stock. This not only helps prevent stockouts (improving your Fill Rate and reducing Backorder Rate), but also prevents idle stock from sitting in the wrong place. Efficient transfers and adjustments keep your inventory turnover healthy by distributing products to where they’re needed most. The system also streamlines cycle counts – you can quickly adjust counts in the software when discrepancies are found, which improves the Inventory Accuracy KPI over time.
Barcoding and Loss Prevention
CyberStockroom supports barcode scanning integration, which means you can use barcode scanners to check items in and out or do audits. This greatly reduces manual errors in data entry, a common source of inventory record inaccuracies. With every scan updating the system, you maintain a tighter control on stock levels. Barcode tracking also deters theft and shrinkage – it’s harder for items to “disappear” unnoticed when every movement is logged. CyberStockroom even offers features designed for loss and theft prevention, giving managers tools to investigate discrepancies (for instance, reviewing the activity history of product movements). By reducing unauthorized loss, you directly improve the Shrinkage KPI and protect your bottom line. Higher accuracy and lower shrinkage together contribute to a more reliable operation and better service levels.
Reporting and Analytics
A good inventory system doesn’t just collect data – it generates insights. CyberStockroom includes reporting features that let you analyze inventory metrics and trends. You can generate reports on stock levels, movements, and even derive metrics like turnover or fill rates from the data. Having these reports handy means you can regularly review your KPIs and share them with your team. For example, you might pull a monthly inventory turnover report by product category to see which lines are underperforming, then take action (markdowns, marketing pushes, etc.). The ability to customize and view KPI reports helps in setting SMART goals and benchmarks for improvement. Essentially, CyberStockroom acts as a compass for continuous improvement – with accurate data and visual cues, you can spot problems early and address them.
Collaboration and Accountability
CyberStockroom allows multiple users with role-based permissions, so your team can collaborate on inventory management. Warehouse staff can perform updates (receiving stock, fulfilling orders, doing counts) and managers can oversee and approve changes. This transparency means everyone is working off the same real-time information, significantly reducing miscommunication. From a KPI standpoint, this fosters a culture of accountability that further improves metrics like accuracy and order fulfillment. When employees know that inventory movements are being tracked and are visible to the whole team, they tend to adhere more closely to processes, resulting in fewer errors and lost items.

By using a modern system like CyberStockroom, you essentially arm yourself with accurate data and automation, which are critical for excelling in the following additional KPIs we’ll discuss next.
Additional Inventory KPIs to Monitor
We’ve covered some foundational metrics so far. There are a few more essential inventory KPIs that warehouse managers should keep on their radar to ensure all aspects of inventory management are optimized. These relate to accuracy, loss, and customer service – all key for running a high-performance warehouse.
6. Inventory Accuracy
Inventory accuracy measures the degree to which your recorded inventory matches the actual physical inventory in the warehouse. It’s typically expressed as a percentage:
Inventory Accuracy = (Count in System / Physical Count) × 100%
If your database says you have 100 units of Product Y but a physical count finds only 95 units, the accuracy for that item is 95%. Many warehouses conduct regular cycle counts or annual full counts to calculate this KPI. High accuracy means your records truthfully reflect what’s on the shelves.

Why It Matters: Accuracy is the backbone of all other inventory KPIs and operations. If your data is wrong, it leads to a cascade of problems: you’ll commit to customer orders for stock you don’t actually have (hurting your Order Fill Rate), you might re-order items unnecessarily (inflating carrying costs and messing up the inventory-to-sales ratio), and you can’t trust metrics like turnover or DSI if the inventory counts are off. In short, poor accuracy can cause stockouts, overstocks, unhappy customers, and financial losses. The average inventory accuracy for many businesses hovers around only ~65% – which suggests a lot of room for improvement. Best-in-class operations aim for 95-99%+ accuracy. Every percentage point of improvement means more reliability. High inventory accuracy also improves trust in your system: warehouse employees and managers can rely on the system’s numbers when making decisions (like promising a ship date or triggering a replenishment).
Optimization Tips:
- Regular Cycle Counting: Instead of counting everything once a year (which is time-consuming and often disruptive), implement cycle counts. Count small sections of inventory on a rotating schedule (e.g., 5% of SKUs each week). This continuous auditing catches discrepancies early and keeps accuracy high.
- Root Cause Analysis: When you find errors, don’t just correct the numbers – investigate why they happened. Common culprits include data entry mistakes, items placed in wrong locations, unreported damages, or theft. Addressing the root cause (through better training, process changes, or security measures) will prevent repeat errors.
- Technology Aids: Use barcode or RFID scanning for all inventory movements. Scanning virtually eliminates manual entry errors. If feasible, consider automation tools like warehouse management systems (WMS) which guide picking and putaway and update counts in real time. Some advanced systems even use scales or sensors to auto-update counts.
- Employee Training and Accountability: Ensure warehouse staff follow standardized processes for receiving, picking, and shipping. Even a simple step like double-checking that the right item and quantity are picked for an order can improve accuracy (and also affects order accuracy KPIs). Encourage a culture where everyone understands the importance of accurate inventory records.
- Use Inventory Audits Strategically: Do a targeted audit whenever there’s a major discrepancy or after implementing changes. Also, consider incentive programs for maintaining accuracy – for example, recognizing teams or individuals when accuracy in their section stays above a certain threshold.
Remember, accuracy underpins trust in your inventory system. When your inventory accuracy KPI is high, you gain confidence in every other metric and process, from forecasting to fulfilling orders. It ultimately leads to smoother operations and a better ability to serve customers (no more “sorry, we thought we had it in stock” moments).
7. Inventory Shrinkage
Inventory shrinkage is the loss of inventory that is recorded in the system but not available in reality. Shrinkage is usually expressed as a percentage of inventory value lost. The formula can be:
Shrinkage % = ((Recorded Inventory Value – Actual Inventory Value) / Recorded Inventory Value) × 100
Shrinkage encompasses losses due to theft (internal or external), damage, spoilage, misplacement, supplier short shipments, or administrative errors. For example, if your books say you should have $1,000,000 worth of stock but a physical count shows only $980,000, that $20,000 difference is shrinkage, which would be 2% of inventory in this case.

Why It Matters: Shrinkage hits the bottom line directly – it’s inventory you paid for but can’t sell. A certain small amount of shrinkage may be inevitable in any large operation, but beyond a point it signals serious issues. According to industry studies, average retail inventory shrink can be around 1.4–1.6% of sales, whereas in well-run warehouses (with tighter security and less public access) shrinkage might average around 0.2%. Even 1% shrinkage can translate to thousands or millions in losses annually depending on your volume. High shrinkage can indicate problems like inadequate security, poor handling practices, or even fraud. Besides the financial loss, shrinkage also distorts inventory accuracy figures and can lead to unexpected stockouts. If you think you have 50 units in stock (but 5 were stolen or damaged unknown to you), you’ll accept orders you can’t fulfill, hurting customer satisfaction and Perfect Order Rate. Thus, minimizing shrinkage is key to both cost control and reliable service.
Optimization Tips:
- Strengthen Security: Implement security cameras in storage areas, especially high-value item zones. Restrict warehouse access to authorized personnel only and use badge systems to track entries. Often, just the knowledge of surveillance can deter internal theft.
- Enhance Receiving and Shipping Controls: Many shrinkage issues start at receiving (e.g., a supplier sends 95 units but 100 were recorded, or goods are damaged on arrival and not recorded properly) or during shipping (items lost in transit or incorrectly shipped). Have strict receiving protocols: count and quality-inspect incoming goods and report discrepancies immediately. For outbound, ensure packages are double-checked and sealed securely.
- Regular Audits: As part of your cycle counting or separate loss-prevention audits, focus on discrepancy-prone categories. Some items are more prone to theft (high value, easy to pocket) – audit those more frequently. If shrinkage is discovered, investigate immediately to find out when and where the loss occurred.
- Damage Reduction: Not all shrinkage is theft; damage can be a big factor (for example, breakage in a parts warehouse or spoilage in a food warehouse). Evaluate your storage conditions and handling practices. Use proper shelving, organize heavy items low to prevent drop damage, train staff on handling fragile goods, and ensure optimal environment (temperature, humidity) for goods that need it. Write off and remove damaged goods promptly from the system to keep accuracy clean.
- Engage Employees: Sometimes employees might hide errors or small losses for fear of punishment, which then show up as shrinkage later. Create an environment where reporting mistakes or accidents is encouraged and addressed constructively. When staff feel included in loss prevention efforts rather than policed, you’ll get better cooperation. Also, rotate task assignments; for instance, don’t have the same person always responsible for inventory adjustments or counts in one area – cross-training and rotation can help prevent fraudulent practices.
By aggressively managing shrinkage, you protect your profit margins and keep inventory records accurate. A reduction in shrinkage directly improves your financial performance (imagine recovering $10,000 of would-be losses simply by tightening controls). It also means more stock available to sell, which can improve your fill rates and customer satisfaction. Aim to drive shrinkage as low as possible – zero may not be realistic, but every tenth of a percent reduction is a big win for warehouse efficiency and cost savings.
8. Order Fill Rate
Order fill rate (sometimes called order fulfillment rate or service level) is the percentage of customer orders that can be completely filled with available stock at the time of ordering, without backorders or missing items. In formula form:
Order Fill Rate = (Number of Orders Fulfilled in Full / Total Orders) × 100%
There are variations: some calculate at the order line level (what percentage of total order lines are filled immediately) or unit fill rate (what percentage of total ordered units were filled). But at its core, a fill rate of 100% means every customer got everything they ordered, when they ordered it, out of your on-hand inventory.

Why It Matters: Fill rate is a critical customer-facing KPI. A high fill rate translates to happy customers – you had the item in stock and delivered it without delay. A low fill rate means customers experience backorders or delayed fulfillment, which can erode trust and send them to competitors. For internal operations, fill rate reveals how well your inventory is positioned to meet demand. If you stock out frequently (low fill rate), it could indicate forecasting issues, insufficient safety stock, or poor inventory distribution among locations. Many companies set target fill rates depending on the business context – for example, an e-commerce retailer might target 95-98% fill rate, accepting that a tiny fraction of items might stock out, whereas a critical B2B supplier might aim closer to 99% because customers must get their parts. Improving fill rate must be balanced against inventory cost: you can reach 100% fill rate on everything if you wildly overstock, but that’s not cost-efficient. The goal is to maximize fill rate while minimizing excess inventory, finding that sweet spot via good planning.
Optimization Tips:
- Improve Demand Forecasting: The better your forecast for each product, the better you can stock to meet that demand. Use historical sales data, market trends, and input from sales teams to predict needs. Pay special attention to seasonal peaks or promotions that can spike demand.
- Set Safety Stock Levels: Determine appropriate safety stock for key items to buffer against variability in demand or supplier lead time. High-priority SKUs (maybe your top sellers or critical parts) likely warrant safety stock so that you almost never stock out. Lower-priority items can have little or none. Regularly review these levels and adjust if you find you’re still stocking out or conversely never touching the safety stock (which could mean it’s too high).
- Multi-Location Inventory Optimization: If you have multiple warehouses or stock points, ensure your inventory is allocated in the right proportions. A common issue is one warehouse running out while another sits on surplus. Implement inventory transfers (using tools like CyberStockroom’s map, as mentioned) or a fulfillment strategy that ships from the location closest to the customer with stock available. This will raise the overall fill rate across regions.
- Monitor Supplier Performance: Sometimes fill rate suffers not because of internal issues, but due to delays upstream. If a supplier delivers late or short, you might run out. Track your supplier lead times and reliability. For suppliers with inconsistent performance, either maintain extra buffer stock or qualify a backup supplier.
- Backorder Analysis: Whenever a backorder occurs, log it and analyze the cause. Which product was it? Was the stockout due to a sudden demand spike, or did an inventory accuracy error make you think you had more than you did? By diagnosing each failure to fill, you can implement fixes (like increasing stock of an unexpectedly popular item, or improving accuracy as discussed) to prevent repeat incidents.
Boosting your order fill rate directly enhances customer satisfaction and loyalty – customers get what they want, when they want it. From an operations view, it also means you’re executing well on all earlier steps: purchasing enough, tracking accurately, and picking efficiently. As your fill rate climbs, you’ll likely see reductions in backorder handling costs and fire-fighting expediting, freeing up time and money. It’s one of the clearest measures of a well-oiled inventory management machine.
9. Backorder Rate
Backorder rate complements the fill rate by measuring the proportion of orders (or order lines) that you could not fulfill immediately and had to place on backorder. It can be calculated as:
Backorder Rate = (Number of Orders with Any Backordered Items / Total Orders) × 100%
or alternatively by lines or units backordered. Essentially, if you received 1,000 orders this month and 50 orders couldn’t be filled completely (items were out-of-stock and customers waited), your backorder rate is 5%. Another way to express it: backorder rate is 100% minus the order fill rate (if defined by orders). So a 95% fill rate corresponds to a 5% backorder rate.

Why It Matters: Backorder rate is a direct reflection of customer service failures due to inventory shortages. A high backorder rate means customers often have to wait for products – a situation to minimize because it frustrates customers and can harm your reputation. Tracking backorder rate helps in identifying patterns: Is a particular product frequently backordered? Is a certain time of year more prone to stockouts? Perhaps certain product groups or suppliers are the culprits. By keeping an eye on this KPI, you can target improvements to the areas causing most backorders. The goal is to drive backorder rate as low as possible. As noted, if backorder rate is high, it indicates you need to improve forecasting, planning, or inventory visibility. Also, backorders incur additional handling costs – you have to manage an open order, perhaps split shipments, extra communication to the customer, etc. All that is operational overhead that doesn’t exist when orders fill completely. Reducing backorders thus not only keeps customers happy but also reduces these inefficiencies.
Optimization Tips:
- Identify Repeat Offenders: Analyze which SKUs go on backorder most often. Focus on those for corrective action – it could be as simple as increasing the par stock level for those items, or it could mean something like renegotiating lead times with a supplier because that item’s supply is too slow for its demand.
- Improve Inventory Tracking (Visibility): Ensure you have real-time visibility into stock levels across your system. Sometimes backorders happen because sales were promised from stock that was already allocated to someone else or wasn’t updated (e.g., sales team took an order thinking stock was available when it wasn’t). A centralized system like CyberStockroom or a WMS helps avoid that by giving everyone a single source of truth. This ties back to accuracy and system integration – all channels should see current inventory to prevent accidental overselling.
- Communication & Partial Fulfilling: This doesn’t reduce the rate, but it mitigates the pain – if an order has multiple items and one is backordered, communicate proactively with the customer. Offer to ship the available items first or suggest alternatives for the backordered item if possible. Good communication can turn a backorder situation from a negative to a neutral (or even positive if handled really well) in the customer’s eyes. Internally, track these partial shipments; you might even measure a line fill rate to get granular insight (e.g., “97% of all ordered lines were filled, but 5% of orders had at least one line backordered”).
- Safety Stock & Reorder Point Adjustments: If backorders are rising, revisit your safety stock levels for the affected items. Maybe the service level targets for those items need to be higher. For example, for a critical part, you might change from planning safety stock for a 90% service level to 99% service level. This will raise inventory holding on that item but should drastically cut backorders. Use this selectively for items where the backorder pain (lost sales or customer dissatisfaction) is greater than the cost of holding extra stock.
- Collaboration with Sales & Marketing: Sometimes promotions or sales campaigns can unintentionally cause backorders by spiking demand beyond what was forecasted. Encourage your sales/marketing team to coordinate with operations – if they plan a big push on a product, make sure inventory levels are adjusted in advance. Conversely, if you see stock levels dropping fast, alert the sales team so they don’t commit beyond what you can deliver (or so they can focus on selling something you do have plenty of).
A decreasing backorder rate is a strong signal of improved inventory management and customer service. It often goes hand in hand with rising fill rates. Keep in mind, zero backorders might not be 100% attainable all the time, especially in businesses with highly unpredictable demand, but the closer you get, the better your processes likely are. Many companies celebrate sustained periods of no backorders on key products as a major achievement. Reducing backorders means you’re selling what you have, not turning away business – it’s a direct contributor to revenue and customer retention.
10. Perfect Order Rate
Perfect order rate is a holistic KPI that measures the percentage of orders that are delivered without a single error or issue. An order is “perfect” if it meets all the following criteria: delivered on time, in full (complete order filled), with the correct items, undamaged, and with proper documentation (invoice, packing slip, etc.). In formula:
Perfect Order Rate = (Orders with No Errors / Total Orders) × 100%
If even one aspect of an order is wrong – e.g., one item was missing or the shipment arrived a day late or the package was damaged – that order is not counted as perfect. For instance, if out of 500 orders this week, 450 were delivered flawlessly with no complaints or corrections, the perfect order rate is 90%.

Why It Matters: Perfect order rate is effectively the ultimate customer satisfaction KPI in fulfillment. It rolls up inventory effectiveness (having the items in stock), operational accuracy (picking and packing correctly), and delivery performance. For warehouse managers, it’s a great high-level metric because a lot of things have to go right to achieve a perfect order. If your perfect order rate is, say, 85%, that means 15% of orders had some issue – which is significant. Those issues could be inventory-related (stockouts leading to partial shipments), process-related (wrong item picked or order packed incorrectly), or logistics-related (late delivery or damage in transit). Many companies monitor perfect order rate as a key indicator of overall operational excellence. Improvements in other KPIs (accuracy, fill rate, on-time shipping) will naturally drive up the perfect order metric. Customers remember problems more than smooth orders; increasing the percentage of error-free orders boosts customer trust and loyalty. Also, internally, reducing errors and problems saves costs (less re-shipping, fewer return handling, less firefighting). It’s said that “the best service failure is the one that never happens” – the perfect order rate is a measure of preventing failures in the first place.
Optimization Tips:
- Address Components Individually: Break down your perfect order metric into its components (on-time delivery, complete fulfillment, accuracy, damage-free, correct docs). Track each sub-metric. This way you can see where most imperfections come from. If you notice on-time delivery is 98% but order accuracy is 92%, you know to focus on improving picking/packing accuracy. Conversely, if accuracy is great but on-time is lagging, you might need to work on carrier performance or shipping schedules.
- Implement Quality Control Checks: Introduce checks at critical points. For example, have a second person or a barcode scan verify the contents of each order before sealing the box (to catch picking errors), or use weight checks (if you know an order of X items should weigh Y lbs, a deviation might signal a missing or extra item). Ensure labels and documents are double-checked for correctness. These quality assurance steps can significantly reduce errors that reach the customer.
- Process Standardization and Training: Make sure every team member follows standardized processes for order fulfillment. Variability in how people pick or pack can lead to mistakes. Train new staff thoroughly and provide refreshers for existing staff. Sometimes, minor process tweaks (like a specific packing workflow or a staging area for completed orders to verify address labels) can prevent common mistakes.
- Leverage Technology: Use your WMS or inventory system’s capabilities – many systems can, for instance, flag if an order is short on inventory before you close it, ensuring you don’t call something complete when it isn’t (helps perfect order by not forgetting backorders). Some advanced warehouses use automated picking technologies or voice picking which can increase accuracy. Also, track error rates by individual or shift if possible; not to punish, but to identify if more training or support is needed somewhere.
- Continuous Improvement: Treat every non-perfect order as a learning opportunity. Conduct periodic reviews (maybe weekly or monthly) of imperfect orders. What went wrong and why? If a trend emerges (e.g., a specific item is often mis-picked because its SKU is similar to another), implement a fix (change labeling or storage positions to differentiate them better). Encourage a mindset of zero defects, even if zero is aspirational, the idea is to always be chasing the last few problems.
A rising perfect order rate is something to be proud of – it means your warehouse is consistently executing well across the board. Achieving high levels (95%+ perfect orders) often translates to cost savings (fewer re-shipments, claims, or compensations) and increased sales (happy customers mean repeat business and good word-of-mouth). It’s a unifying KPI that encapsulates the success of all the moving parts in warehouse operations working together correctly. As you optimize individual KPIs like accuracy, fill rate, and on-time shipping, you’ll see the perfect order rate climb as a rewarding confirmation that you’re delivering excellence.

Driving Operational Excellence with Inventory KPIs
In the dynamic world of warehouse management, what gets measured gets managed. By focusing on these key inventory KPIs – from turnover and DSI to accuracy, shrinkage, and service-level metrics – warehouse and operations managers can obtain a clear picture of how well the inventory is being controlled and where to improve. Each KPI offers a different lens: some highlight efficiency and cost (turnover, carrying costs, GMROI), others spotlight reliability and customer satisfaction (fill rate, backorders, perfect orders), while others ensure the foundation is solid (accuracy and shrinkage). Tracking them is only half the battle; the real gains come from analyzing the results and taking action to optimize each area.
Implementing the right tools and practices is essential to improve these KPIs. As we discussed, technologies like CyberStockroom’s map-based inventory management system can provide a significant boost by increasing visibility, data accuracy, and responsiveness in your operations. Coupling software solutions with best practices – regular cycle counts, lean inventory strategies, employee training, and continuous process refinement – creates a powerful combination that drives performance upward.
For a warehouse manager or supervisor, making KPIs a central part of your routine means you’re managing proactively rather than reactively. Instead of responding to fires (like last-minute stockouts or frantic searches for lost products), you’ll be planning and preventing issues guided by data. Over time, even small incremental improvements in KPIs can translate to substantial benefits: lower operating costs, faster order fulfillment, less capital tied up in stock, and most importantly, happier customers and team members.
Remember that every warehouse is unique – not all KPIs will carry equal weight for every operation. It’s okay to prioritize those that align most with your business goals (for example, an e-commerce fulfillment center might prioritize order accuracy and cycle time, whereas a bulk distributor might focus on turnover and carrying cost). However, maintaining a balanced view is crucial; the KPIs often influence one another. Improving inventory accuracy will naturally boost a host of other metrics, and reducing carrying costs might involve improving turnover, and so on.
Key inventory KPIs are more than just numbers – they are a continuous feedback mechanism. By tracking, analyzing, and optimizing these metrics, you create a culture of operational excellence. The warehouse becomes not just a storage space, but a well-orchestrated engine of efficiency within the supply chain. Managers can make informed decisions, employees have clear targets to strive for, and executives can see tangible performance improvements. Ultimately, mastering these KPIs leads to a warehouse operation that is cost-effective, agile, and reliably delivers the right products at the right time – which is the cornerstone of outstanding supply chain management and customer satisfaction.
By staying vigilant with your inventory KPIs and leveraging modern tools like CyberStockroom, you’ll be well on your way to maximizing efficiency and optimizing performance in your warehouse. Here’s to moving the needle on those metrics and reaping the rewards of a highly efficient inventory management system!


Leave a comment