
Why Inventory Visibility Matters Today?
In today’s global economy, supply chains are more complex and dynamic than ever. Manufacturers, industrial construction firms, and logistics providers often manage thousands of parts and products across dozens of locations – from sprawling factories and warehouses to remote job sites, vehicles in transit, and multiple distribution centers around the world. In this environment, achieving 100% inventory visibility means knowing exactly what is in stock, what has been consumed, and what remains on hand at any moment across all locations. Full visibility gives companies a single, real-time picture of their inventory, enabling confident decision-making and agile operations.
Operational efficiency and responsiveness depend on this visibility. When managers have real-time data on stock levels and locations, they can prevent costly stockouts and avoid excess overstock. For example, if a construction project runs short of a critical component, a manager can instantly check other sites’ inventories instead of scrambling for urgent suppliers. Likewise, manufacturing planners can synchronize production runs with parts on hand rather than guessing. Without visibility, teams often resort to emergency orders or expedited shipping — costly measures that could be avoided. In industries that run on lean or Just-in-Time (JIT) models, even a single part shortfall can halt an assembly line or a building project. Hence, 100% visibility is essential to keep projects and production on schedule, minimize waste, and optimize capital tied up in inventory.

Moreover, modern business conditions make visibility essential for agility. Demand can shift suddenly – markets change, project scopes evolve, or disruptions occur (supplier delays, transportation hiccups, geopolitical events). Companies need to react in real time. Cloud-based platforms, mobile scanners, and wireless sensors now allow every transaction (receipts, issues, transfers) to be instantly recorded. Decision-makers across the world get updates the moment inventory moves. For example, if a delayed shipment of components finally arrives early, the system shows the change immediately so procurement can re-route extra parts. With full visibility, teams are not waiting on outdated spreadsheets; they have the most current data at their fingertips to adjust plans on the fly.
In this comprehensive overview, we will explain the core components of inventory visibility and describe the key tools and technologies that enable it.
Core Components of Inventory Visibility

Achieving full inventory visibility is not about one single product or tech; it’s the result of several core components working together. Every company must address these fundamental elements:
- Standardized Item Identification: Each product or part needs a unique identifier (SKU, serial number, barcode, RFID tag, etc.) so it can be recognized by systems. Without standardized IDs, it’s impossible to know if “Part 123” in Warehouse A is the same as “Widget X” in Site B. Using consistent codes or tags ensures each item is counted and tracked correctly.
- Real-Time Data Capture: Visibility requires up-to-the-minute information. Core to this is capturing data at the moment inventory moves. That means using scanning devices, sensors, or mobile apps whenever goods are received, moved, or used. For example, a barcode scan at receiving or a weight sensor on a bin should immediately update the system. Real-time capture eliminates lag and error from manual entry.
- Unified Data Platform: Inventory data must flow into one central system or interconnected platforms so that all locations share a single source of truth. If Site A is using a spreadsheet and Site B uses a separate database, overall visibility will be fragmented. Cloud-based platforms or integrated ERP/WMS modules aggregate inventory data in real time across warehouses, plants, vehicles, and job sites, giving a consolidated view.
- Location Tracking: Full visibility means knowing where every item is stored. This requires sub-location tracking down to aisles, racks, shelves, bins, or even on vehicles or tools. The system should reflect physical locations (e.g. “Warehouse 1 – Rack 5 – Bin 3”) so anyone can pinpoint exactly where to find a part. Mapping these locations, whether with coordinates or a visual map, ensures nothing gets “lost” in the system.
- Automated Processes and Alerts: Visibility is not only about data entry – it’s also about processing it. An automated system can trigger notifications or actions when certain conditions occur (low stock alerts, order triggers, expiry alerts for perishable items, etc.). For instance, if a warehouse falls below a threshold for a critical part, the system should flag it or even automatically create a replenishment order. This ensures nothing slips through the cracks.
- Analytics and Reporting: Core to visibility is transforming data into insight. Dashboards and reports provide analytics on inventory performance (turnover rates, stock-outs, fill rates, dead stock, etc.). By monitoring these metrics, managers can spot trends or issues in the inventory flow that raw data alone might not reveal. For example, a dashboard might show that certain parts consistently understock at one site but overstock at another, prompting a balance adjustment.
- Cross-Functional Collaboration: Visibility isn’t just a technology issue – it involves people and processes. Inventory data should be accessible to all relevant stakeholders: purchasing, production, warehouse, logistics, and even sales teams. A collaborative approach, supported by role-based access in the system, ensures everyone from warehouse clerks to executives sees the same information. When everyone works off one shared data set, decisions are faster and more coordinated.
Combining these components – accurate identification, real-time capture, centralized systems, precise location tracking, automation, analytics, and collaboration – forms the foundation of complete inventory visibility. The following sections will dive into the technologies that make each part possible.
Barcode and QR Code Systems

Barcodes (and their 2D cousin QR codes) are perhaps the simplest and most ubiquitous tools in inventory management. A barcode is a machine-readable code printed on labels, boxes, or individual items. Barcode scanners read these codes and instantly capture product information into the inventory system. Similarly, QR codes (quick-response codes) can store more data or direct scanners to digital product records.
How they work: Items are labeled with a unique barcode or QR code. When inventory is received or moved, warehouse staff use a handheld scanner or mobile device with a camera to scan the code. The scan sends the item’s ID to the inventory platform, which updates quantities and locations. This replaces manual entry (where an operator would type item details into a spreadsheet) with a fast, near-error-free process.
Why they help visibility:
- Affordability and simplicity: Barcodes and labels are very low cost. Most manufacturing and logistics operations already use them. They provide immediate visibility improvement with minimal investment. Every scanned transaction (receiving, picking, shipping) instantly updates the record of that item.
- Fine-grained tracking: By labeling cartons, pallets, or even individual parts with unique codes, companies can track movement at the very granular level. If 100 identical widgets arrive on a pallet, each widget can have its own barcode. Scanning each one as it’s used or moved lets the system know exactly how many remain and where they went.
- Integration with mobile devices: Modern smartphones and tablets can scan barcodes or QR codes with an app. This makes it easy to implement mobile inventory audits (cycle counts) or have field techs scan parts on a jobsite to update the system.
- Standardization: Many industries use standard barcode formats (like GS1) so parts can be tracked across companies. For example, OEM parts in automotive or aerospace often come with industry-standard barcodes, which suppliers and customers both scan. This common language improves visibility across the supply chain.
Practical Example: In a warehouse, incoming boxes arrive with shipment manifest. A worker scans each pallet’s barcode at the dock. The cloud inventory system instantly increases the on-hand count for each item and notes the items’ initial receiving location. Later, when those boxes are put away into racks, each rack has a location barcode. The worker scans the pallet, then scans the rack barcode – the system now knows those items are in that rack. Throughout this process, everyone gets real-time visibility of stock levels and whereabouts via the shared system.
While barcodes significantly improve visibility, they do have limits. They require line-of-sight scanning, meaning someone or something (like a scanner or smartphone) must physically scan the code each time. This is fine for most situations, but if you need to track hundreds of items moving quickly, you may look to RFID (below) or other automation to supplement barcoding. Still, for most manufacturers and logistics operations, barcoding remains a core inventory visibility tool due to its simplicity and cost-effectiveness.
RFID (Radio-Frequency Identification) and Electronic Tagging

RFID uses wireless radio-frequency tags to track items without requiring line-of-sight scanning. An RFID tag (or smart label) contains a chip and antenna. When it passes near an RFID reader or antenna field, the tag is energized and sends back its stored ID number. This technology has become a powerful inventory visibility tool in settings where barcodes might be too slow or impractical.
Key features:
- Bulk Scanning: Unlike barcodes, RFID readers can scan many tags at once from a distance. For example, a reader on a pallet gate or inside a doorway can read all tagged items passing through, updating the system automatically. This is ideal for situations like counting pallets on a dock, or inventory moving through conveyors, or quickly checking an entire shelf of items.
- No Line-of-Sight: RFID tags can be read through packaging or when hidden. A box packed with smaller tagged parts will still report its tags when scanned. This speeds up processes, as workers don’t need to manually pick up and scan each label.
- Durability: RFID tags can be more durable than paper barcodes in harsh environments. Some tags are even designed to be affixed to heavy equipment or exposed to outdoor conditions.
- Active vs. Passive Tags: Passive RFID tags (most common in inventory) have no battery and are triggered by the reader’s energy. They are inexpensive and last virtually forever. Active tags have a small battery and can transmit signals at longer range, useful for tracking containers or vehicles across a yard or site.
How RFID boosts visibility:
- High-Value and High-Volume Tracking: RFID is especially popular when items have high value or when operations are fast-moving. For instance, in aircraft maintenance, expensive parts (like landing gear components or avionics) may have RFID tags so ground crews know exactly which parts are on which airplane. In logistics, RFID-tagged pallets let a system instantly identify dozens of pallets on a forklift or inside a truck.
- Real-Time Location Sensing: By placing RFID readers at key points (doorways, loading docks, shelf portals), companies automatically see movements without manual scanning. If an RFID-tagged item leaves a zone without being put on an outbound manifest, the system can flag it (helping prevent theft or misplacement).
- Integration with WMS: Many Warehouse Management Systems integrate RFID. For example, when an RFID-equipped conveyor moves parts, the WMS database is updated in real time. This removes double-handling and data entry.
Practical Example: A heavy-machinery parts distributor tags large bins of components with passive RFID labels. At the end of each aisle, RFID readers connected to the inventory system automatically scan bin contents. If a bin moves from the receiving dock into Aisle 5, the system notes the move. When a batch of parts leaves on a truck, the gate reader scans the load and immediately decreases the inventory in the system. The company’s logistics dashboard now shows exactly how many of each part are in the warehouse, on trucks, or still incoming. This reduces manual counts and ensures the database always matches reality.
Considerations: RFID requires more investment per tag than barcodes, and setting up readers and infrastructure takes planning. Tagging every small item might be expensive, so companies often tag containers or high-value items. In manufacturing, a tagged pallet of raw materials might be tracked, while its individual contents use barcodes. Also, RFID signals can be affected by metal or liquids, so tags must be chosen and placed carefully (some companies use rugged on-metal tags for equipment parts). Despite these factors, RFID remains a powerful tool for achieving near-automatic, real-time inventory visibility in demanding industrial settings.
Smart Sensors

The Internet of Things refers to networks of smart devices and sensors connected via the internet. In inventory management, IoT extends visibility beyond scan points to real-time sensing and tracking of inventory and assets throughout the entire supply chain.
Types of IoT devices for inventory:
- GPS/Cellular Trackers: Rugged IoT trackers can be attached to high-value cargo, trailers, containers, or even equipment. These devices report location, movement, and sometimes status (like door open/closed) over cellular or satellite networks. For example, a global logistics company might attach IoT trackers to shipping containers carrying critical parts. As ships and trucks move, the trackers send coordinates, letting headquarters see exactly where items are en route. This adds a layer of visibility even when inventory is between warehouses.
- Environmental Sensors: Some inventory items require environmental monitoring (temperature, humidity, vibration). IoT sensors placed in a warehouse zone or on specific containers can continuously monitor conditions. If conditions go out of tolerance (too hot, too cold, too humid), alerts are triggered and logged. This is key for items like chemicals, medicines, or electronic components. The system therefore not only knows where the inventory is, but whether its environment is safe.
- Proximity and Presence Sensors: These include RFID readers (as mentioned) but also Bluetooth beacons and other local sensors. For instance, small Bluetooth tags on tools or machines can let the system know when they enter or leave a site. A warehouse might have weight sensors on shelves or bins that instantly measure stock levels and report those weights to the cloud inventory system, triggering a scan or automatic count when thresholds change.
- Smart Pallets and Forklifts: Entire pallets can be IoT-enabled – with built-in scales and tags – so the act of loading or unloading a pallet is recorded. Even forklifts can be smart; when a forklift with a mounted scanner moves an item, the inventory count is updated automatically.
Why IoT matters for visibility:
- Continuous Tracking: Unlike barcodes or even RFID which require passing points, IoT devices can provide continuous or very frequent updates. For high-value or time-critical inventory, this means truly live data feeds on location and status.
- Remote Sites and Harsh Environments: In industries like mining or construction, IoT is invaluable. Imagine a remote quarry storing explosives: IoT sensors can monitor stock levels of blasting caps and ingredients, sending updates over satellite if no Wi-Fi is available. Even in deep indoor or underground facilities, mesh networks (like LoRaWAN) let sensors relay data back to the main system.
- Predictive Maintenance and Usage Tracking: In manufacturing, IoT can blur the line between inventory and equipment. Smart machines might deduct parts from inventory as they use them. For example, a production robot could automatically signal when it draws 10 components from stock to build a unit, instantly reducing the inventory count of that part.
- Integration with Analytics: IoT data feeds enrich visibility with context. Knowing location alone is helpful, but if the system also knows temperature or shock events, managers can make better decisions (e.g., quarantine spoiled goods, plan alternative transport, etc.).
Practical Example: A logistics provider outfits its trailers with GPS-enabled IoT devices. Each trailer reports its location every hour. The carrier’s operations team logs into a dashboard and sees a map with all in-transit inventory in real time, color-coded by ETA. One morning, a critical truck hauling essential parts stops unexpectedly for over an hour. The system flags it, and a dispatcher calls the driver to check on the delay. Without IoT, the manager might not have known about the holdup until it caused a site to run out of parts.
Meanwhile, inside the warehouse, IoT weight sensors on bulk material silos continuously measure how much raw material is left, auto-reporting to the inventory system. When a silo dips below a preset threshold, the system alerts purchasing to order more, avoiding any production stoppage.
By combining IoT with a robust inventory platform, companies can approach 100% visibility even into areas once considered opaque or too remote for standard scanning.
Cloud-Based Inventory Management Platforms

At the heart of inventory visibility lies the software platform that collects and displays all the data. Cloud-based inventory management systems (IMS) and enterprise resource planning (ERP) platforms have become essential tools. Unlike legacy on-premise databases, cloud platforms offer anywhere-access, real-time data sharing, and easy scalability – all crucial for global visibility.
Key advantages of cloud platforms:
- Centralized Data Access: A cloud IMS serves as a single repository for inventory data from all sites. When warehouses in different countries update inventory records, the cloud database instantly reflects the changes. Authorized users worldwide (from plant managers to executives) can log in on any device to see the same up-to-date information. This unification eliminates the “silos” that used to plague companies using independent systems.
- Real-Time Updates and Collaboration: Cloud systems often provide dashboards and notifications. As soon as an item is scanned or a sensor sends data, the cloud updates. Teams can collaborate on the same platform: a buyer in London sees purchases and stock levels at a factory in China. Workflows like approval processes or maintenance orders can be managed within the system, further tying inventory to operations.
- Mobility and Field Access: With cloud platforms, even mobile workers stay connected. Field technicians can use smartphone or tablet apps to check inventory at a remote site, submit stock transfers, or perform cycle counts offline (synchronizing later). This level of access improves visibility for off-site and project-based inventory, common in construction and oil & gas industries.
- Scalability: Cloud solutions can grow with the business. Adding a new warehouse or an additional user is typically straightforward and cost-effective in a cloud model. The system auto-scales storage and processing as data volume increases. Businesses don’t have to invest in new servers or IT infrastructure for each expansion.
- Integration Capabilities: Modern cloud IMS are built to integrate with other systems via APIs. For example, connecting an inventory platform to a company’s ERP, accounting software, or e-commerce portal (even though e-commerce is not our focus here) means that purchase orders, invoices, and shipments flow seamlessly. This end-to-end integration ensures that inventory data is consistent across functions, contributing to visibility (e.g. when a sales order is shipped, the inventory is immediately decremented in the IMS).
- Advanced Features: Many cloud systems now include built-in analytics, forecasting tools, and AI-driven features. For example, a cloud IMS might analyze historical usage and suggest reorder quantities or predict stockouts days in advance. Having these analytics on the cloud lets managers leverage big-data insights without maintaining their own data centers.
Practical Example: A mid-sized manufacturing company adopts a cloud inventory platform as its central system. When a warehouse worker in Singapore scans incoming materials, those additions appear instantly for the production planner in Germany to see. The purchasing manager in Houston generates a report showing that a certain raw material will run out in two days, triggering an urgent order with suppliers. Later, during a remote project, a site engineer checks the cloud app on a tablet to confirm the exact count of spare parts left on the project stockpile. Every action feeds into one synchronized database, giving the entire company a clear, real-time view of inventory across continents.
By contrast, older systems using spreadsheets or local servers often suffer from version discrepancies, latency, or data lock-in. A cloud-based platform solves these issues by ensuring that there is always “one version of the truth” accessible at any location, on demand. For the goal of 100% visibility, having a cloud-based inventory platform is practically indispensable in modern supply chains.
Warehouse Management Systems (WMS)

A Warehouse Management System (WMS) is a specialized type of software that optimizes warehouse and distribution center operations. While a general inventory system tracks quantities, a WMS goes deeper – managing specific locations within a warehouse, orchestrating picking and putaway, and often interfacing with automation equipment. In large-scale warehousing and logistics, a WMS is a key tool for achieving high accuracy and visibility.
Role of WMS in visibility:
- Location-Level Tracking: WMS software keeps precise records of where every pallet or bin is stored. It uses location identifiers (aisles, shelves, rack positions) down to very granular levels. When combined with scanning or RFID, the WMS knows that “Item A” is at Rack 12, Shelf 3. This pin-point location data improves visibility because it answers exactly where an item can be found within a facility, not just which building it’s in.
- Inbound/Outbound Coordination: WMS systems manage the entire inbound (receiving, put-away) and outbound (picking, packing, shipping) processes. When goods arrive, the WMS can generate a warehouse map directing staff where to place them for optimal space use. Each put-away scan updates the inventory location. Similarly, when items are picked for an order, scanning decrements stock in the WMS. This granular transaction logging ensures that inventory records stay accurate to the minute.
- Integration with Automation: Many modern warehouses use conveyors, sorters, automatic storage/retrieval systems (ASRS), and robotics. A WMS interfaces with these machines. For example, when a conveyor passes a pallet past an RFID portal, the WMS records its movement. If a forklift guided by a vision system picks up an item, the WMS updates location. This seamless machine integration yields extremely high visibility in fast-moving environments where manual scanning would be too slow.
- Cycle Counting and Auditing: WMS often includes sophisticated cycle counting capabilities, where it prompts staff to count certain items at intervals. By constantly reconciling physical counts with system records, a WMS maintains higher inventory accuracy. This reliability means that any view a manager has of stock is more likely to reflect the true physical state, crucial for 100% visibility.
- Reporting and KPIs: WMS dashboards track warehouse-specific metrics (order fulfillment rate, picking accuracy, dock-to-stock time). These reports are part of visibility too – they tell managers where bottlenecks or discrepancies might be happening. For example, if a particular part has frequent picking errors, further investigation can be triggered to ensure it doesn’t undermine visibility.
Practical Example: A large distribution center uses a WMS that assigns every incoming case to an exact slot. Workers use RF guns (handheld scanners) to scan an item and then the bin location label. The WMS confirms placement. Later, when an order comes in, the system identifies which bins hold that item and directs a picker to the optimal locations. Each pick is scanned, and inventory levels update. If a manager queries the WMS, it shows exactly how many cases of each SKU remain and precisely where to find them. Meanwhile, a dashboard might show that some items have low turnover, indicating the warehouse is holding dead stock – a visibility insight used for lean management.
WMS vs. Basic Inventory Systems: While an inventory management platform (cloud IMS) can track stock across sites, a WMS is focused on maximizing accuracy and efficiency within a warehouse. Many businesses use both in tandem: the WMS handles the day-to-day flow inside warehouses (communicating with scanners, conveyors, etc.), and it feeds consolidated data into the central inventory platform. Together, they ensure that local warehouse transactions are captured and rolled up into the global inventory picture.

Digital Twin and Virtual Inventory Models
A digital twin is a virtual replica of a physical object, system, or environment. In inventory and supply chain management, a digital twin typically means creating a virtual model of a warehouse (or entire supply chain) that mirrors real-world inventory status and operations. This concept is an advanced tool for achieving visibility and optimization.
Benefits of a digital twin for inventory visibility:
- Virtual Visualization: Instead of viewing inventory in lists or charts, a digital twin lets managers “see” the inventory in a virtual space. For example, a 3D model of a factory floor or warehouse could be populated with icons or visuals representing actual stock. If a manager clicks on a virtual shelf, they might get a live feed of how many pallets are there, or even a drone photo. This immersive view can make it easier to understand where inventory is concentrated and how it moves through space.
- Real-Time Simulation: Because a digital twin connects to live data (from scans, sensors, etc.), it updates in real time as physical inventory changes. This means an operations manager could simulate a shipment arriving virtually: as the goods get scanned in the real warehouse, the twin’s model shows them appearing in the virtual layout. Such synchronization ensures the virtual model stays in lock-step with reality, offering an intuitive visibility layer on top of raw data.
- What-If Analysis: One of the powerful features of digital twins is the ability to run simulations. For example, a planner could simulate a sudden influx of materials and see if the current warehouse layout and staffing can handle it. Or test what happens if a machine goes down by rerouting tasks in the digital twin. For inventory, this might translate into forecasting storage needs, or planning emergency transfers if one location’s stock is compromised. By simulating these scenarios, companies gain visibility not just on what is, but what could be, enabling proactive decision-making.
- Training and Communication: A digital twin can also serve as a training tool. New warehouse staff could virtually walk through the warehouse layout to learn where items belong. Cross-functional teams (like design, production, and inventory) can use the twin to visualize how inventory moves from raw materials to finished goods. This enhances a shared understanding of inventory flows.
Real-world Example: A large manufacturing plant creates a digital twin of its production floor and adjoining warehouse. When parts are issued to the production line, the factory’s digital twin updates to show stock levels dropping. If a major order comes in, planners use the twin to visualize how assembly schedules will affect inventory depletion in each area. They can even run scenarios like “What if we move this storage rack to a different aisle?” to see the impact on picking efficiency. Meanwhile, a regional manager using a tablet sees the virtual plant and can click into any section to see a current inventory report, thereby achieving visibility through an intuitive interface.
Current Status: Digital twins are still an emerging technology in the inventory field. They often require advanced software (sometimes leveraging augmented or virtual reality) and strong integration of IoT and data feeds. Large enterprises and tech-forward companies are exploring them under the broader Industry 4.0 umbrella. However, even without a full 3D twin, the concept highlights the importance of connected data and visualization: at a minimum, inventory systems that offer a graphical “map view” (like CyberStockroom) are stepping stones toward the digital twin vision. Over time, digital twins will become more common as computing power and software capabilities grow.
Analytics Dashboards and Business Intelligence

Collecting inventory data is one thing; making sense of it is another. Analytics dashboards and BI tools turn visibility from raw data into actionable insight. In any technology stack for inventory visibility, dashboards are what allow managers to monitor and interpret the data at a glance.
Key elements of analytics dashboards:
- Real-Time Metrics and KPIs: Dashboards can display live metrics like current stock levels by location, inventory turnover rates, or fill rates (percentage of orders shipped complete). By seeing these numbers in real time, managers always know where things stand. For instance, a KPI might show that Warehouse A is at 90% capacity while Warehouse B has space, indicating that transfers might be needed.
- Alerts and Exceptions: Good dashboards highlight anomalies. For example, an alert might pop up if actual inventory deviates from expected by more than a certain percentage (indicating possible theft or counting error), or if a part’s stock goes below a critical threshold. This exception management is critical for 100% visibility – it flags issues that might undermine accuracy.
- Historical Trends and Forecasts: Dashboards often chart historical data. Trends in usage, lead time, or seasonal demand can be graphed. This historical perspective helps with forecasting. Some systems incorporate AI to predict when inventory will dip below par based on patterns, giving teams time to reorder. In short, by analyzing trends, the dashboards help prevent stockouts or overstocks before they happen.
- Custom Reporting: Every industry has its own needs. A manufacturing plant might want reports on machine downtime vs. spare parts usage; a construction firm might track parts usage by project. Modern inventory dashboards allow custom reports and filters – for instance, showing inventory age (how long items have sat in stock) or cost tied up in each category. This deeper analytics helps drive strategic decisions.
- Multi-Location Comparison: If a company has multiple warehouses or production sites, dashboards can compare their inventories side by side. Perhaps a manager sees that two facilities both receive shipments of a raw material, but one uses it faster – indicating that stock could be rebalanced. Without this comparative visibility, such optimization might be missed.
- User-Friendly Visuals: Effective dashboards use charts, heat maps, and indicator icons (green/yellow/red). This visual approach lets even non-technical stakeholders immediately understand the inventory situation. For example, a heat map of a warehouse floor (or map of all facilities) could color-code aisles by stock levels, showing at a glance which areas are under-stocked or overstocked.
Practical Example: A logistics company implements an inventory analytics dashboard that managers view on large screens daily. The dashboard shows key indicators: one for “Stock Accuracy %” (the correlation between system records and actual counts), “Average Days of Supply” for critical parts, and a bar chart of stock turns (how many times inventory cycles per year). One morning, the dashboard alerts that Stock Accuracy has slipped below 95% in Warehouse C. The team investigates and finds a misplaced shipment that hadn’t been scanned. Because the dashboard flagged the drop in accuracy, they corrected it before it caused an order error.
Another example: A procurement manager uses the system’s trend report to see that several raw materials have become more volatile in usage. The system’s predictive analytics warns that if usage spikes as forecasted, safety stock should be increased in advance. The manager places orders accordingly, averting what would have been a disruptive shortage.By combining inventory tracking tools with powerful dashboards, organizations don’t just see their current stock – they also see the implications and patterns within that data. This transforms visibility into foresight, which is essential for maintaining near 100% accuracy over time.
CyberStockroom: Visual, Cloud-Based Inventory Management
CyberStockroom is a modern inventory management solution that exemplifies how technology can drive visibility. Designed for businesses that need to manage inventory across multiple sites and locations, it adopts a map-based, visual approach to inventory tracking. Rather than just lists and numbers, CyberStockroom lets users build a digital map of their physical spaces – warehouses, stores, trucks, or job sites – and populate it with items.
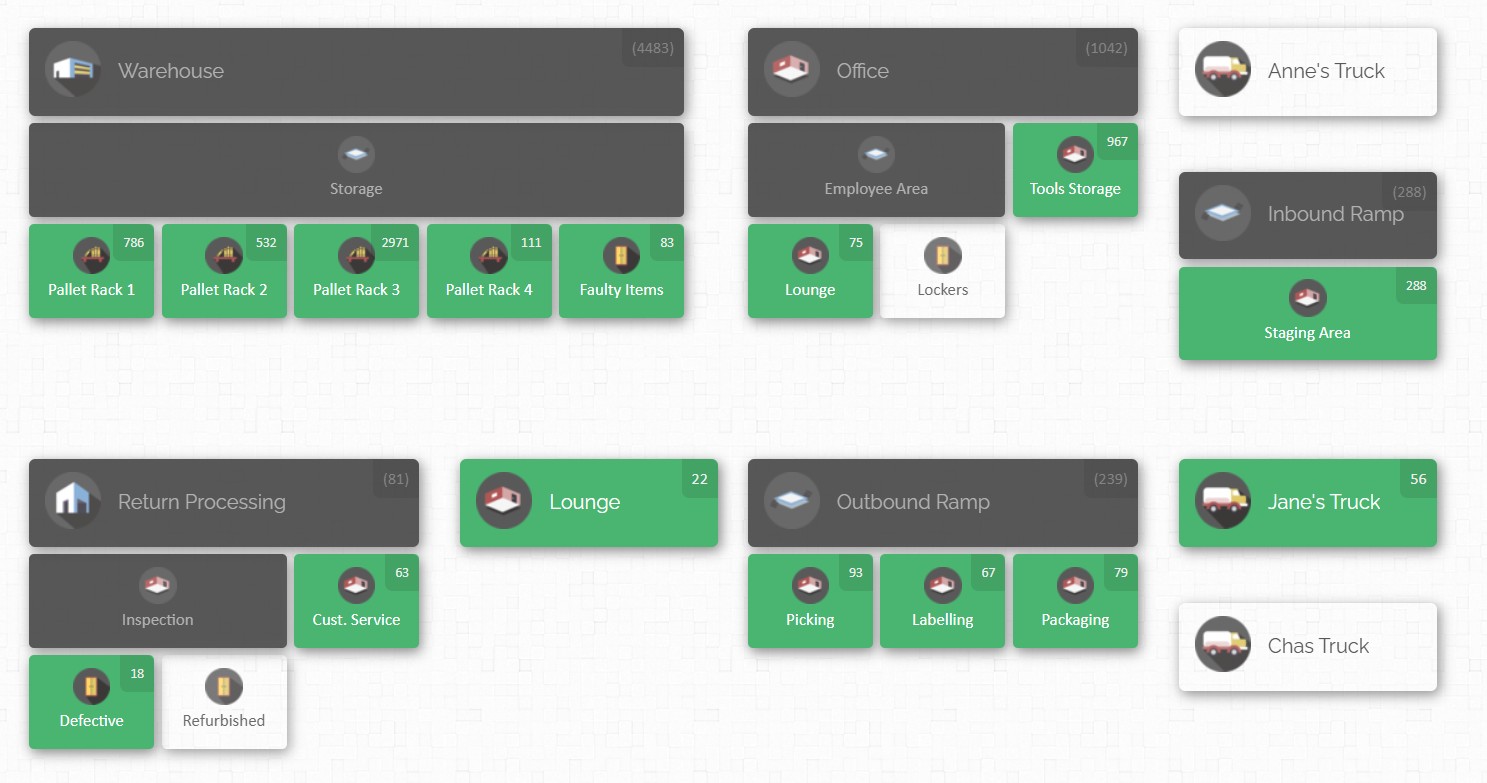
How CyberStockroom Works
- Inventory Mapping: Administrators define locations (e.g. Warehouse A, Assembly Line 1, or Field Site East) and sub-locations (like shelves, bins, or equipment). Each location is represented as a part of the map. Items are then assigned to these locations. On the visual map, each item shows a count or icon. This “bird’s-eye” view gives an immediate sense of distribution. For instance, a warehouse floor plan can show empty shelves in red (low stock) and full shelves in green (healthy stock), making imbalances obvious.
- Drag-and-Drop Transfers: CyberStockroom makes moving items easy. To transfer stock, a user drags an item icon from one location to another on the map. The system logs this as an automatic check-out and check-in. This intuitive interface dramatically simplifies internal transfers compared to typing forms or codes.
- Barcode Scanning: CyberStockroom supports scanning with any standard barcode scanner or smartphone. Items can have barcodes attached. For example, a technician on site can scan a part they are using, and CyberStockroom deducts it from that location’s count on the map.
- Inventory “X-Ray” View: One standout feature is CyberStockroom’s ability to click on a product and see an “X-ray vision” of where that item exists across all locations. In other words, without manually checking each location, the system highlights every place that item is stored. This gives instant multi-site visibility: a manager sees, for instance, that Item 123 exists in Site A, Warehouse B, and the delivery van. This directly addresses the need for consolidated visibility.
- Batch and Worksheet Processing: For tasks like receiving a shipment or doing cycle counts, CyberStockroom provides worksheets for reporting.
Why CyberStockroom is a Strong Choice
For the target industries (manufacturing, industrial construction, logistics), CyberStockroom offers several advantages geared toward achieving full visibility:
- Multi-Site Coordination: Companies with multiple plants or remote jobsites will value the platform’s multi-location design. CyberStockroom’s cloud architecture means every site’s inventory data is shared. A central office can oversee all sites. This consolidates visibility in one pane rather than multiple spreadsheets.
- Ease of Use and Training: The visual, map-driven interface is intuitive. Staff with minimal IT training can learn it quickly. Rather than navigating complex menus, users interact with a map and icons. For example, field engineers or warehouse workers often prefer “point and click” over complex WMS screens. Lowering the technical barrier encourages adoption, which is crucial – a visibility system is only as good as its data input.
- Agility and Customization: CyberStockroom allows customizing fields and categories, so it can adapt to specialized industries. For instance, a mining company might add a custom field for “dig location,” while an aviation parts supplier might track “lot number” or “expiry date.” This flexibility ensures the visibility platform fits the business rather than forcing business processes to fit the tool.
- Comprehensive Tracking: Beyond basic stock levels, CyberStockroom logs check-in/check-out history for each item, essentially acting as an audit trail. Managers can review who moved what, and when. This level of tracking helps in compliance situations (e.g., proof of chain-of-custody) and audits. It’s a key part of “visibility” – knowing not just where things are, but how and when they got there.

Implementation Strategies for 100% Visibility
Having the right tools is only half the battle – the other half is implementing them effectively. The journey to 100% inventory visibility should be approached methodically:
- Define Your Inventory Scope: Start by mapping out what “inventory” includes for your business. Is it raw materials, work-in-progress parts, finished goods, spare parts, tools? In project-based industries, inventory might also include rented equipment or consumables at job sites. Clearly categorizing each inventory type and its locations is key.
- Standardize Processes and Data: Ensure that all sites use consistent item IDs, naming conventions, and data entry rules. For example, the same part shouldn’t be known by different codes at different sites. Implementing standard operating procedures for how and when to scan or log items is crucial. This consistency makes the visibility system reliable; if one location forgets to scan items properly, visibility gaps occur.
- Integrate Incrementally: Rather than ripping out legacy systems overnight, integrate new tools in phases. For instance, start by rolling out barcode scanning and cloud inventory at a few pilot sites. Use this to clean existing data and iron out process wrinkles. Gradually connect those sites to others, and consider integrating with your ERP or purchasing systems to unify information. Incremental deployment helps manage change and mitigate risk.
- Equip the Workforce: Visibility is a people-driven goal. Train staff on using the new tools: scanning devices, mobile apps, and dashboards. Emphasize why visibility matters (fewer errors, less firefighting) so teams buy in. In the field, ensure that technicians have convenient access (e.g., tablets) and encourage them to scan parts when used. Cycle counting should become part of routine rather than an occasional chore – easy mobile scanning and simplified processes help.
- Leverage Automation: Wherever possible, automate data capture to minimize human error. Use RFID gates or readers at high-throughput points, employ sensors where inventory is always present (like in bins or trucks), and connect conveyors or dock stations to the system. The less manual typing required, the more accurate your visibility.
- Maintain Data Hygiene: Regularly audit and reconcile inventory records. Conduct cycle counts and spot checks to validate that the system matches reality. If discrepancies appear, address root causes (training gaps, process faults, or system misconfiguration) immediately. Clean data is the backbone of visibility; consider implementing reminders or alerts for items that haven’t moved or been counted in a while.
- Use Analytics Proactively: Don’t just collect data – use it to improve. Monitor your inventory dashboards and KPIs. If a dashboard shows chronic shortages of a part, investigate and fix procurement or stocking policies. If overstock is tying up capital, adjust reorder levels. Continuous improvement based on analytics ensures the visibility system is not static but evolves with your business needs.
- Align Inventory and Finance Goals: Work closely with finance and business planning teams. A visible inventory means better financial planning – lower working capital needs and more accurate forecasts. When inventory policies (safety stock levels, reorder points) align with real usage data and budgets, the entire organization benefits. This cross-department alignment reinforces the importance of keeping inventory data visible and accurate.
- Plan for Change Management: Implementing new visibility tools can disrupt routines. Communicate clearly about the benefits and provide support during the transition. Celebrate early wins (like finding a lost part or avoiding a stockout thanks to the new system) to build momentum.
Following these strategies, a company can steadily increase its inventory accuracy and transparency. Remember, 100% visibility is an ideal target – in practice, even achieving 95–99% accuracy is exceptional. Tools and technologies get you there faster, but process discipline and a culture that values data are equally important.
Key Takeaways
- 100% inventory visibility is critical for complex manufacturing, construction, and logistics operations. It means knowing exactly what inventory exists, where it is, and how it is moving at all times.
- Core components of visibility include standardized item identification (barcodes/RFID), real-time data capture, centralized data platforms, precise location tracking, and automated alerts and analytics. Each component reinforces the others.
- Barcode and QR code systems provide a low-cost foundation for tracking, enabling fast, accurate scans of items and locations. They are ubiquitous and easy to implement across industries.
- RFID tagging allows for wireless, bulk scanning of goods, improving efficiency in high-volume or automated environments. It overcomes line-of-sight limitations of barcodes and adds a layer of automation.
- Sensors extend visibility by continuously monitoring inventory conditions and locations, even in remote or harsh environments. GPS trackers, environmental sensors, and smart bins feed live data into the system.
- Cloud-based inventory platforms are essential for unifying data. They give global teams a real-time, single source of truth that is accessible anywhere. Cloud solutions also simplify updates, scaling, and integration with other systems.
- Warehouse Management Systems (WMS) provide location-level precision inside distribution centers and integrate closely with automation (conveyors, robotics). They handle inbound/outbound processes and help maintain very high accuracy in large warehouses.
- Digital twin technology is an emerging tool that creates a virtual replica of physical inventory environments. It offers immersive visualization and simulation capabilities, further enhancing proactive management of stock.
- Analytics dashboards and BI tools turn raw data into insight. Real-time metrics, trend analysis, and predictive analytics help managers spot problems before they occur and continuously optimize inventory levels and flow.
- CyberStockroom represents a modern approach: it combines cloud-based inventory management with an intuitive map interface. It excels at multi-site visibility, drag-and-drop transfers, and real-time collaboration. Compared to traditional systems, its visual design and offline mobile support make it particularly well-suited for industrial and construction contexts.
- Implementation best practices include defining clear inventory policies, integrating tools incrementally, training staff, and continuously auditing data. People and processes are just as important as technology in achieving full visibility.


Leave a comment